Abstract
Background:
Quantification of dynamic biomechanical strain in articular cartilage in vivo, in situ using non-invasive MRI techniques is desirable and may potentially be used to assess joint pathology.
Purpose:
To demonstrate the use of static mechanical loading and continuous 3D-MRI acquisition of the human knee joint in-vivo to measure the strain in the tibiofemoral articular cartilage.
Study Type:
Prospective
Subjects:
Five healthy human volunteers (4 women, 1 man (age 25.6 ± 1.7) underwent MR imaging at rest, under static mechanical loading condition and during recovery.
Field Strength/Sequence:
A field strength of 3T was used. The sequence used was 3D-continuous golden angle radial sparse parallel (GRASP) MRI and compressed sensing (CS) reconstruction.
Assessment:
Tibiofemoral cartilage deformation maps under loading and during recovery were calculated using an optical flow algorithm. The corresponding Lagrangian strain was calculated in the articular cartilage.
Statistical Tests:
Range of displacement and strain in each subject, and the resulting mean and standard deviation were calculated.
Results:
During the loading condition, the cartilage displacement in the direction of loading ranged from a minimum of −673.6 ± 121.9 μm to a maximum of 726.5 ± 169.5 μm. Corresponding strain ranged from a minimum of −7.0 ± 4.2 % to a maximum of 5.4 ± 1.6%. During the recovery condition, the cartilage displacement in the same direction reduced to a minimum of −613.0 ± 129.5 μm and a maximum of 555.7 ± 311.4 μm. The corresponding strain range reduced to a minimum of −1.6 ± 7.5 % to a maximum of 4.2 ± 2.6%.
Data Conclusion:
This study shows the feasibility of using static mechanical loading with continuous GRASP-MRI acquisition to measure the strain in the articular cartilage. By measuring strain during the loading and recovery phases, dynamic strain information in the articular cartilage might be able to be investigated.
Keywords: magnetic resonance imaging, cartilage deformation, strain, tibiofemoral joint
INTRODUCTION
The tibiofemoral joint has a thin articular cartilage with a primary biomechanical function of lubricating load bearing joints (1). Pathologies such as osteoarthritis (OA) manifest in varying degrees of cartilage degeneration resulting in altered deformation behavior during joint loading (2). In addition, cartilage degeneration may also affect post-load bearing recovery dynamics (3). Thus it is important to characterize dynamic strain behavior in normal and diseased cartilage under dynamic loading and recovery conditions. Effective non-invasive characterization and quantification of cartilage deformation under load bearing conditions and subsequent recovery dynamics have the potential to be used as a biomarker for diagnosis and monitoring novel treatments for OA.
Different approaches have been employed to characterize internal strains within the articular cartilage, but they remain technically challenging. Computed tomography (CT) has been used but provides low soft tissue contrast, while scanning electron microscopy (SEM) cannot measure the cartilage thickness (4,5). Magnetic resonance techniques offer non-invasive methods, with excellent soft tissue contrast and ability to make 3D measurements during loading and recovery (6,7).
The advent of non-invasive MR imaging to assess strain was in myocardial studies that analyzed the myocardium during the cardiac cycle using techniques such as myocardial tagging, phase contrast velocity mapping, displacement encoding, and strain encoding(8). In applications of assessing strain in articular cartilage in vivo, fast low angle shot (FLASH) sequence was used to measure cartilage thickness in vivo after simple knee exercises(9). Spoiled gradient echo (SPGR) technique was used to measure the articular cartilage contact area under load in a standing position in an open bore MRI system(10). These techniques did not however, characterize the deformations occurring in the articular cartilage. More recently, displacements under applied loading (dualMRI) technique was reported that used a low frequency static loading synchronized to the MRI acquisition capable of measuring sub-voxel deformation changes to cartilage. This technique requires synchronizing the load with the MRI acquisition and it utilizes an oscillating load making it difficult to perform dynamic loading studies (11). Magnetic resonance elastography (MRE) is useful to measure strains in soft tissue such as in liver (12) and ex-vivo applications (13,14), but they are not well-suited for use in cartilage in-vivo, due to the inherent stiffness of cartilage and MRE requirements to transmit high frequency shear waves to the target tissue (14).
Measurement of dynamic strain using MRI is challenging as it requires synchronization between loading and recovery conditions and the data acquisition, requires high spatial resolution and needs to account for bulk motion artifacts. The golden angle radial sparse parallel (GRASP) technique introduced earlier for dynamic volumetric imaging in the abdomen provides a flexible time-windowing MR technique providing high spatial and temporal resolution (15). The goal of this study was to develop a technique to quantify dynamic strain in vivo in the tibiofemoral cartilage using a combination of static mechanical loading of the articular cartilage in the MR scanner with an ergometer, and using a continuous 3D GRASP based MR acquisition.
MATERIALS AND METHODS
Design of Experiments
In this study, mechanical loading of the knee cartilage was performed to simulate static standing loads during the MRI scan. Mechanical loading was achieved using a MR-compatible ergometer (Orthospect, Ergospect GmbH, Innsbruck, Austria) capable of providing static mechanical loads during the imaging session. The ergometer used pneumatic resistance provided by an external air compressor system (16). Control of the pneumatic force was manually set by an external controller to deliver the desired amount of load to the knee. To ensure the ergometer setup did not move during the loading condition, a vendor provided vacuum platform was used with an external vacuum system situated outside the MR suite. Pressure and vacuum hoses connected to the ergometer were used to deliver the desired load and the operation of the vacuum base, respectively. To immobilize movement of the volunteer during the load a custom designed harness with a vest (Ergospect GmbH, Innsbruck, Austria) was used that distributed the fixation pressure during the loading condition to the shoulder and the waist.
The experiment followed a rest-loading-recovery scheme with a total imaging time of 18 minutes. The resting phase was for 2 minutes to establish the baseline strain levels. The mechanical loading condition was for 8 minutes duration where a standing load was delivered to the subject from the ergometer, with uniform load being delivered to both legs. Similar to previous studies reported (11,17), the amount of load delivered to each leg for each subject was half the weight of the subject or the maximum the subject could comfortably bear. In this study the loading force ranged from 200–320 N/leg. The subject was instructed to not bend knees during the loading condition in order to simulate a standing load. Following the loading condition was the recovery phase for 8 minutes, where the load delivered by the ergometer was reduced to baseline.
MR imaging protocol and data acquisition
All MRI scans were performed on a clinical 3T MRI scanner (Prisma, Siemens Healthineers, Erlangen, Germany) with a vendor provided flexible 12 channel-array coil.
The imaging sequence used was a 3D-golden angle radial stack-of-stars trajectory that acquires in-plane radial (kx-ky) and through-plane Cartesian sampling (kz). The TR/TE = 51.8ms/2.5ms, flip angle = 12°, matrix size= 256 x 256 x 40 giving a resolution of 0.6 x 0.6 x 3.3 mm3, slab thickness =132 mm, FOV = 162 x 162 mm2, receiver bandwidth = 590 Hz/pixel, radial spokes = 4500. Each subsequent radial was incremented by the golden angle(15) (111.246°) and all through plane radials were acquired at the same time. The in-plane direction was along the sagittal orientation.
Strain Phantom Experiments: Repeatability
Strain phantom experiments were performed to estimate the repeatability of the technique, and to characterize the variation of strain under different loads. A silicone-gel phantom was constructed (Sylgaard 184 dielectric gel, Dow Corning, Midland, MI) that was embedded with contrasting markers (vitamin E tablets). The two parts of the dielectric gel were vigorously mixed in a ratio of 10:1, and cured for 24 hours to remove air-bubbles. The gel phantom was placed on hard plastic substrate. For loading, a fixed calibrated load was applied from top during imaging, which allowed for unconfined compression along four sides of gel material. All the MR imaging parameters used were same as the in vivo experiments. For the repeatability experiments, the loading and recovery experiment was repeated 5 times with a fixed load of 20 N. To characterize the variation of strain under load, the loading experiment was done with loads of 0, 10, 15, 20, 25 N. The 0N condition was used as the reference condition to calculate the strain.
In-vivo experiments
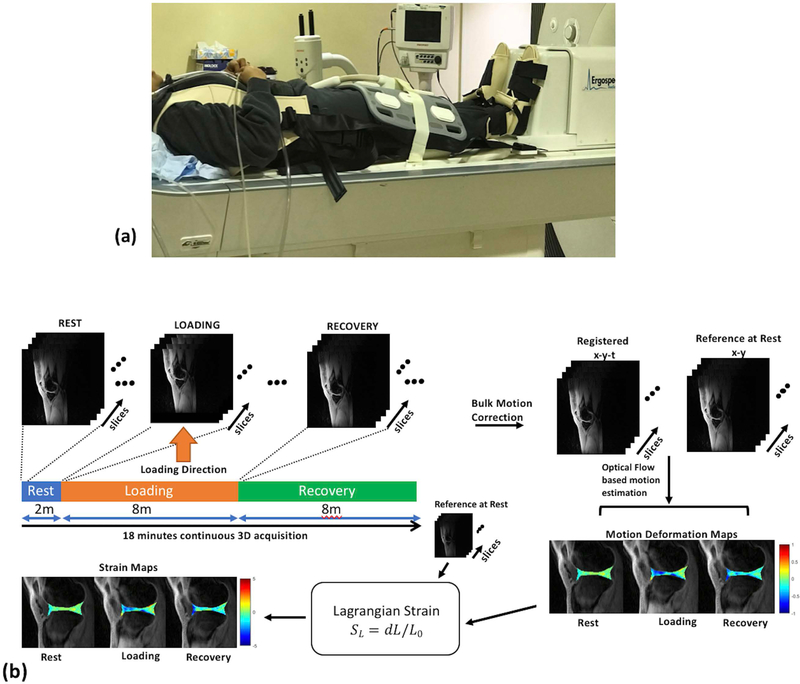
This prospective study was approved by the institutional review board (IRB) and was Health Insurance Portability and Accountability Act (HIPAA) compliant. Following written informed consent, five healthy subjects (4 females, 1 male; age, 25.6 ± 1.7; weight, 64.9 ± 12.9 kg; body mass index, 25.3 ± 5.3 kg/m2) were recruited for the imaging study. Inclusion criteria for this study required that none of the subjects had a history of knee injury or knee pain. Figure 2(a) shows the experimental setup that was used. Subjects were positioned supine on the scanner table, and they wore the fixation vest with straps connected to the ergometer base. The subject’s feet were in the ergometer shoe inserts and were instructed to keep the knees straight throughout the experiment. The flexible receive array coil was centered on the knee joint.
Figure 2.
Experiment setup and post-processing pipeline. (a) shows a photograph of the experimental setup used for mechanical loading during the MRI scan (b) Continuous data acquisition is performed during the rest, simulated static standing load phase and the recovery phase. Following CS reconstruction, the image time series are corrected for bulk motion, and registered. An optical flow algorithm is then used to calculate motion deformation maps. From these, the Lagrangian strain is calculated for each phase (rest through recovery).
Image post-processing and data analysis
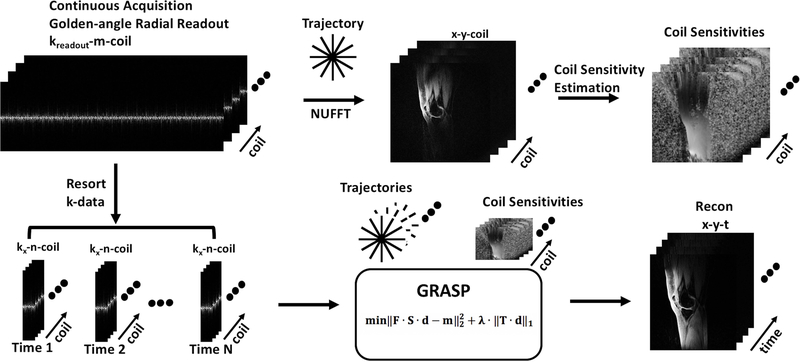
Figure 1 shows the reconstruction pipeline used (15). The raw data from the scanner is used for offline reconstruction. All data were reconstructed using custom software scripts in MATLAB (v. 9.2.0, Mathworks, Natick, MA). Fast Fourier transform (FFT) was applied along the z-dimension, to enable parallel reconstruction of the 3D data. Coil sensitivity maps are calculated using the central k-space data using ESPIRiT (18) on a synthesized Cartesian k-space area obtained from non-uniform FFT (NUFFT) reconstructed images of each coil.(19). The continuously acquired radial spokes were regrouped using 250 spokes to form a sparse dataset for each temporal frame giving a temporal resolution of 1 minute. The iterative GRASP reconstruction was formulated as follows:
| (Equation 1) |
where represents the reconstructed image. The size of is Nx x Ny x Nt where Nx and Ny are the in-plane dimensions, Nt is the number of images to be made with the desired temporal resolution. The vector y represents the captured k-space data, S is the sampling trajectory, F is the Fourier transform, C is coil sensitivity matrix. λ is the regularization parameter, and T is the sparsifying transform. Here the sparsifying transform used was spatial temporal finite differences (STFD) with the temporal order set to 1 and the spatial order set to 1(20,21). The value of λ was determined by running a series of test values on a log scale for one dataset and using that value for subsequent reconstructions (21). In this version of GRASP, fast iterative shrinkage thresholding algorithm with fast gradient projection (FISTA-FGP) was used for minimization of the cost function (20).
Figure 1.
Reconstruction schematic. Continuous golden angle radial acquisition is used to estimate coil sensitivity maps. The continuously acquired data are resorted with desired number of spokes to form an under sampled image time series. The under sampled k-data, and coil-sensitivity maps are used as input to the iterative CS algorithm to form the reconstructed images.
Following CS reconstruction, the images reconstructed during transition periods of rest to loading condition and loading to recovery condition contained considerable motion artifacts and were discarded. There is bulk motion between the rest, loading and recovery conditions. These images are corrected for motion using translation based rigid body motion correction using the first imaging time point as the reference position. This resulted in a motion corrected time-series for each slice in the dataset.
Deformation under load are not discernible visually using MRI (11). To determine sub voxel deformation of the knee cartilage under load, we employed an optical flow algorithm that estimates voxel image intensity based velocity field under the assumption of gray level conservation during displacement where each gray level intensity variation is attributed to motion. The optical flow algorithm used here proposed by Zachiu, et al is an extension of Horn and Schunk’s method with additional constraints that assume that the motion field is smooth in the neighborhood of the estimation point. A user defined weighting factor alpha is set that reflects the elasticity of the tracked object. For the 3D motion tracking for this application the value of alpha was set to 0.4 as a good compromise between performance and accuracy. (22,23). The ROIs are manually segmented for each slice and binary masks were created to represent femoral and tibial articular cartilage. The binary masks and the motion corrected 3D-time-series are used as input to the optical flow measurement algorithm (22). The 3D-flow tracking algorithm uses the image intensity levels to estimate the 3D-motion deformation maps between each time point with reference to the first image in the time series. The Lagrangian strain (SL) is calculated from the deformation fields and the reference images as the signed change in length dL relative to a reference state L0(24):
| (Equation 2) |
Displacement and strain fields were calculated during rest, loading and recovery conditions. The mean and standard deviation of the ranges of displacement and percent strain along the three principal axes (X, Y and Z) were calculated. The post-processing pipeline is shown in figure 2(b).
RESULTS
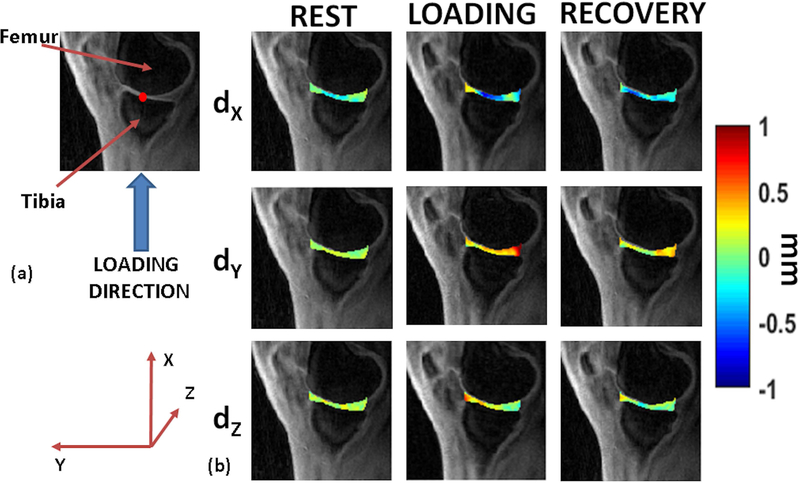
All volunteers were able to perform the simulated standing load task with brief instructions prior to the scan. Figure 3(a) shows the direction of loading in our study. Figure 3(b) shows representative motion deformation maps in the articular cartilage for rest, during loading and recovery conditions.
Figure 3.
Motion deformation maps. (a) shows the direction of static loading targeted to the tibiofemoral articular cartilage. The figure also serves as the anatomical reference for (b), with red dot the assumed point of contact (b) shows example deformation maps in the articular cartilage showing displacement (dX, dY, and dZ) for the rest, loading and recovery phases.
To examine the variation of displacement and strain during the rest, loading and recovery conditions, displacement and strain maps were calculated for each time point. During the loading condition for this subject cohort, the cartilage displacement in the direction of loading (X) ranged from a minimum of −673.6 ± 121.9 μm to a maximum of 726.5 ± 169.5 μm. Corresponding strain ranged from a minimum of −7.0 ± 4.2 % to a maximum of 5.4 ± 1.6%. During the recovery condition, the cartilage displacement in the same direction reduced to a minimum of −613.0 ± 129.5 μm and a maximum of 555.7 ± 311.4 μm. The corresponding strain range reduced to a minimum of −1.6 ± 7.5 % to a maximum of 4.2 ± 2.6%.
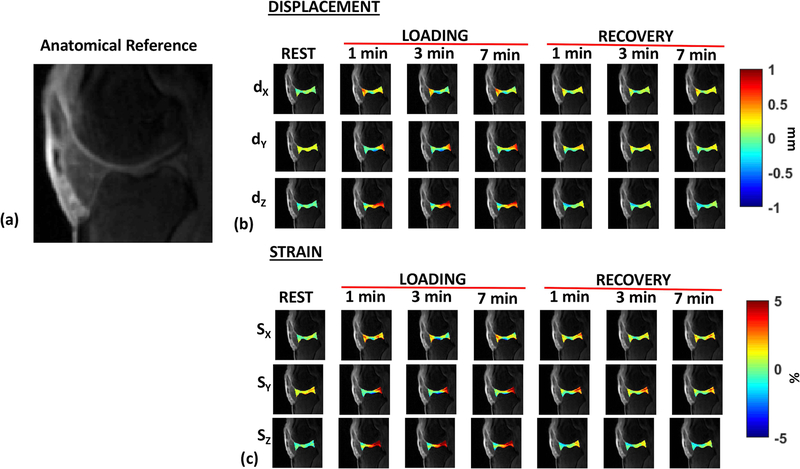
Figure 4(a) shows the variation of calculated displacement in the articular cartilage, dX, dY, and dZ, in a representative subject along the X, Y and Z directions through rest, loading and recovery conditions. Figure 4(b) shows the calculated Lagrangian strain (SX, SY and SZ) in the same subject through the rest, loading and recovery conditions. The range of minimum and maximum displacement and strain during the loading and recovery phases calculated in each direction are shown in Table 1. While along the loading directions certain contact areas exhibit compressive strain, other parts of the articular cartilage exhibit complex heterogeneous strain variations during loading and recovery conditions.
Figure 4.
Representative dynamic displacement and strain maps. (a) shows the anatomical reference for the cartilage joint (b) shows the displacement (dX, dY, and dZ) for the rest, loading condition (1, 3 and 7 minutes into the loading phase), and recovery condition (1, 3 and 7 minutes into the recovery phase). (c) shows the corresponding strain (SX, SY, and SZ) along the X, Y and Z directions for the rest, loading and recovery phases.
Table 1:
Displacement and Strain Ranges. (a) shows the range of minimum and maximum displacement (μm), and strain (%) in the loading condition for all subjects. (b) shows the range of minimum and maximum displacement (μm), and strain (%) during the recovery condition for all subjects.
| LOADING CONDITION | |||||||||||||
|---|---|---|---|---|---|---|---|---|---|---|---|---|---|
| Displacement Range (μm) | Strain Range (%) | ||||||||||||
| dX |
dY |
dZ |
SX |
SY |
SZ |
||||||||
| Min | Max | Min | Max | Min | Max | Min | Max | Min | Max | Min | Max | ||
| Sub 1 | −616.7 | 727.2 | −626.2 | 869.0 | −475.5 | 1323.6 | −5.3 | 7.0 | −11.5 | 14.1 | −2.9 | 20.1 | |
| Sub 2 | −560,0 | 670.9 | 0.0 | 669.4 | −365.0 | 345.1 | −10.0 | 4,9 | 0.0 | 11.2 | −2.2 | 2.2 | |
| Sub 3 | −834.9 | 440.6 | −988.6 | 1574.3 | −242,7 | 711.2 | −13.8 | 2,7 | −9.5 | 20.7 | −1.8 | 3.7 | |
| Sub 4 | −804.9 | 917.0 | −606.9 | 1115.4 | −369.1 | 1645.7 | −2,9 | 5.4 | −4,3 | 12.4 | −0.4 | 15.4 | |
| Sub 5 | −551.4 | 876.6 | −2175.9 | 919.0 | −312.5 | 1584.4 | −3.1 | 7.2 | −13.3 | 10.5 | −1.4 | 14.5 | |
| Mean | −673.6 | 726.5 | −879.5 | 1029.4 | −353.0 | 1122.0 | −7.0 | 5.4 | −7.7 | 13.8 | −1.7 | 11.1 | |
| (a) | STD | 121.9 | 169.5 | 721.7 | 307.2 | 76.4 | 510.1 | 4.2 | 1.6 | 4.9 | 3.7 | 0.9 | 7.0 |
| RECOVERY CONDITION | |||||||||||||
| Displacement Range (μm) | Strain Range (%) | ||||||||||||
|
dX |
dY |
dZ |
SX |
SY |
SZ |
||||||||
| Min | Max | Min | Max | Min | Max | Min | Max | Min | Max | Min | Max | ||
| Sub 1 | −384.1 | 472.6 | −357.8 | 439.0 | −477.6 | 346.0 | −1.8 | 5.7 | −3.8 | 7.1 | −3.1 | 3.3 | |
| Sub 2 | −637.8 | 346.1 | −250,4 | 414.4 | −487,9 | 55,2 | −8.8 | 2,8 | −1.2 | 5,5 | −3.8 | 0.0 | |
| Sub 3 | −771.2 | 160.5 | −358.5 | 543.5 | −497.7 | 491.7 | 12,8 | 0.4 | −4,3 | 5.9 | −3.3 | 1.8 | |
| Sub 4 | −684.6 | 756.5 | −728.6 | 756.7 | −494.3 | 980.3 | −5,3 | 4.0 | −5.5 | 8.0 | −1.7 | 9.0 | |
| Sub 5 | −587.3 | 1042.9 | −1093.8 | 646.7 | −523.2 | 1167.1 | −4.7 | 8.1 | −10.2 | 7.3 | −3.2 | 10.6 | |
| Mean | −613.0 | 555.7 | −557.8 | 560.0 | −496.1 | 608.1 | −1.6 | 4.2 | −5.0 | 6.7 | −3.0 | 4.9 | |
| (b) | STD | 129.5 | 311.4 | 313.2 | 128.3 | 15.1 | 409.6 | 7.5 | 2.6 | 3.0 | 0.9 | 0.7 | 4.1 |
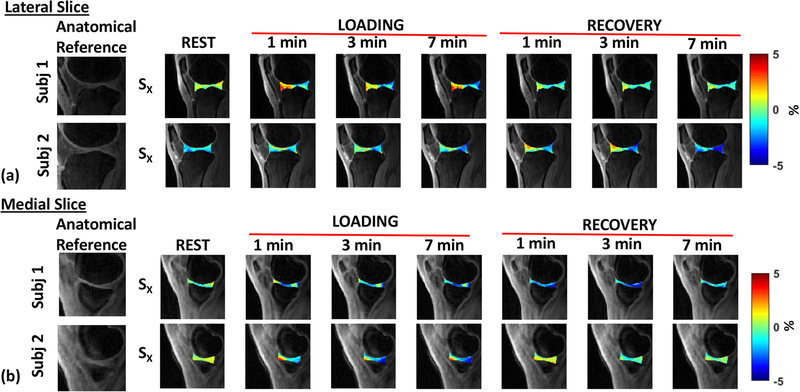
Figure 5(a) and 5(b) shows the temporal strain variation through rest, during loading and recovery in two representative subjects in a lateral slice and a medial slice, respectively. There is significant variation of strain across time among subjects as it depends on a number of factors, including subject dependent biomechanics, cartilage contact areas, BMI, gender, and other experimental factors.
Figure 5.
Strain Maps. (a) shows the strain maps in the loading direction (X) for the lateral slice of two representative subjects in the three phases (rest, load, and recovery), (b) shows the strain maps in the loading direction (X) for the medial slice of two representative subjects in the three phases (rest, load, and recovery). The first image in each row shows the corresponding anatomical reference.
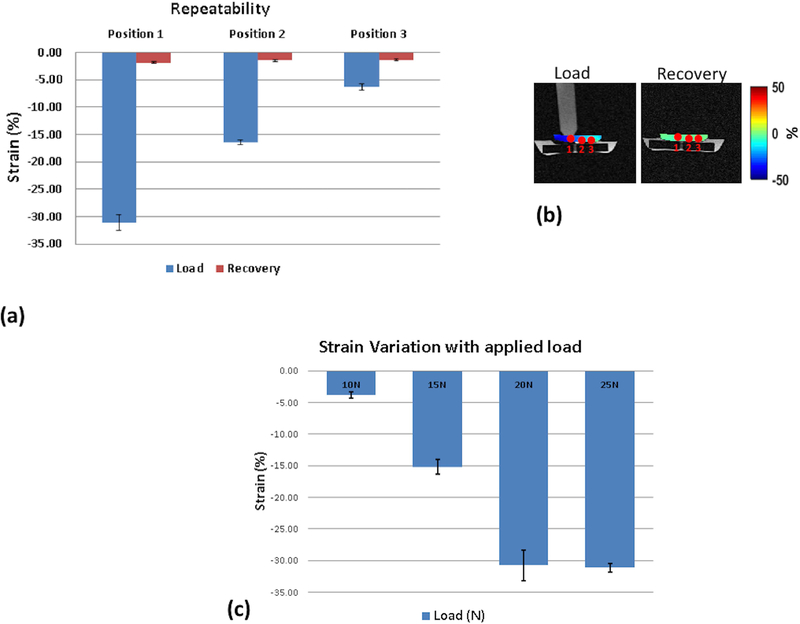
Figure 6(a) shows the repeatability tests from a fixed load of 20N on the silicone-gel phantom. The recovery following the release of the load is also shown. The strain was calculated at 3 positions as shown in figure 6(b) progressively moving away from the load contact point. After 5 measurements the mean strain and standard deviation in the loading condition in position 1, closest to the load contact point, was −31.08 ± 1.41 %, position 2 was −16.40 ± 0.44, and position 3 was −6.29 ± 0.56. After 5 measurements, the mean strain and standard deviation in the recovery position in position 1, 2 and 3 were −1.86 ± 0.17, −1.48 ± 0.20, and −1.34 ±0.22 respectively.
Figure 6.
Silicone-gel phantom results (a) shows the repeatability measures after 5 measurements using a fixed load of 20 N. (b) shows the positions where the strain was measured during load and recovery. (c) shows the variation of strain with varying load
DISCUSSION
In this study, we demonstrated the use of static mechanical loads with continuous MRI acquisition through rest, under mechanical loading condition and subsequent recovery to measure the evolution of strain in the articular cartilage. To our knowledge, this is the first study that reports measurement of cartilage strain during the application of a static mechanical loading and recovery of articular cartilage. This paradigm of experiments looking at the effect of static standing loads on the articular cartilage can potentially allow us to investigate changes in strain response to loads in healthy, injured and degenerative conditions.
Our in vivo data from human volunteers showed that compressive strain is the highest at the contact areas, but is heterogeneous and complex in other areas of the articular cartilage in the loading direction (X) and in other directions (Y and Z). These results comply with other studies that have been reported previously (11,25). A clear increase in the strain during the loading phase and the gradual normalization of the strain during the recovery phase is seen. The contact areas of cartilage vary based on individual biomechanics. In our study the peak strain was achieved shortly after the application of the load in the cartilage contact areas. The recovery of strain to normative values after the release of load was more gradual but was typically achieved in the time frame of the experiment. With altered micro-environments, we speculate that the time to recovery following load will be significantly altered in injury or pathological conditions.
A few of the previous studies report the use of an initial tibiofemoral flexion angle during the loading position (11,26). Since the efficacy of using a flexion angle is debatable, we used a 0° flexion angle as we constrained the movement of the knee from the fully horizontal position.
The use of continuous acquisition using GRASP offers some benefits in the context of dynamic strain imaging. First, the GRASP technique allows to scan continuously without having to synchronize the data acquisition with the experimental conditions. Second, the ability to retrospectively discard bulk motion corrupted spokes corresponding to transition periods from rest to loading condition and loading to recovery condition. Third, the use of radial spokes has inherent robustness towards motion and has increased acquisition signal to noise ratio (SNR) due to repeated sampling of the center of k-space. Radial spokes in the GRASP technique are acquired following a golden angle ordering scheme, in which the angle between two consecutive radial spokes is increased by 111.246° (15). This approach allows an almost uniform coverage of k-space to be obtained for an arbitrary number of consecutive spokes, thus providing the advantage of allowing continuous data acquisition and retrospective sorting of the spokes into several temporal frames. Depending on the temporal resolution desired, fewer spokes may be used as input to the CS reconstruction. In this study, we used 250 spokes to generate an image dataset for one time-point. It is possible to use as low as 50 spokes per time point for the reconstruction of an image dataset, effectively resulting in 5 times improvement in the current temporal resolution. When combined with sparse reconstruction capability of CS this technique offers high flexibility in terms of temporal resolution, which may be a potentially useful diagnostic feature that was not explored in this study. Disadvantages of using the GRASP technique for strain imaging involves retrospective reconstruction of images, higher computation power needed for compressed sensing, and manually discarding the spokes that are motion corrupted. The application chosen in this study was for knee cartilage loading, and may also be used for other articulating joints.
This study has the following limitations. The size of the ergometer is about 18 inches long and is placed on the MRI table. As such, this reduces the available table length for the subject and this limited the maximum height of the subjects allowable in this study to be below 67 inches. It may be possible create a custom table extension to resolve this limitation in the future. The bulk motion correction of reconstructed images between rest and loading, and between loading and recovery conditions had to be carefully performed. Between the condition changes (rest to load and load to recovery) there were subtle in-plane and through-plane shifts even after the lateral knee motion was constrained. An automated technique to register, align and segment the cartilage between individual slices and time-points would significantly improve the post-processing work-flow. The optical flow algorithm was run on the entire image for free form deformation between the reference image and the target image, which may possibly introduce errors in its estimation. The age of the participants in this study did not vary significantly. A larger and more diverse cohort will give enough data to explore relationships of the effect of age, BMI, femoral condyle size and loading on the articular cartilage.
In conclusion, we have demonstrated the feasibility of using of standing static mechanical loads with continuous GRASP-MRI data acquisition and retrospective sorting of the spokes into several temporal frames with flexibility in temporal resolution to measure the strain in the articular cartilage in-vivo. By measuring strain during the loading and recovery phases, dynamic strain information in the articular cartilage can be investigated.
Supplementary Material
Supplementary Figure 1: Silicone-gel phantom results (a) shows the displacements measured in the loading direction at rest, loading (1, 3 and 5 minutes into the loading condition) and recovery (1, 3 and 5 minutes into recovery) (b) shows the strain in the loading direction (X), (c) shows the strain in the Y direction, and (d) shows the strain in the Z direction
Acknowledgements:
The authors would like to acknowledge insightful discussions with Drs. Corey Neu PhD, and Matthew Muckley PhD.
Grant Support: This study was supported by NIH grants R01 AR067156, and R01 AR068966, and was performed under the rubric of the Center of Advanced Imaging Innovation and Research (CAI2R), a NIBIB Biomedical Technology Resource Center (NIH P41 EB017183).
REFERENCES
- 1.McCann L, Ingham E, Jin Z, Fisher J. Influence of the meniscus on friction and degradation of cartilage in the natural knee joint. Osteoarthritis Cartilage 2009;17(8):995–1000. [DOI] [PubMed] [Google Scholar]
- 2.Setton LA, Elliott DM, Mow VC. Altered mechanics of cartilage with osteoarthritis: human osteoarthritis and an experimental model of joint degeneration. Osteoarthritis Cartilage 1999;7(1):2–14. [DOI] [PubMed] [Google Scholar]
- 3.Chan DD, Neu CP. Transient and microscale deformations and strains measured under exogenous loading by noninvasive magnetic resonance. PLoS One 2012;7(3):e33463. [DOI] [PMC free article] [PubMed] [Google Scholar]
- 4.Eckstein F, Schnier M, Haubner M, et al. Accuracy of cartilage volume and thickness measurements with magnetic resonance imaging. Clin Orthop Relat Res 1998(352):137–148. [PubMed] [Google Scholar]
- 5.Kaab MJ, Ito K, Clark JM, Notzli HP. The acute structural changes of loaded articular cartilage following meniscectomy or ACL-transection. Osteoarthritis Cartilage 2000;8(6):464–473. [DOI] [PubMed] [Google Scholar]
- 6.Neu CP, Hull ML. Toward an MRI-based method to measure non-uniform cartilage deformation: an MRI-cyclic loading apparatus system and steady-state cyclic displacement of articular cartilage under compressive loading. J Biomech Eng 2003;125(2):180–188. [DOI] [PubMed] [Google Scholar]
- 7.Song Y, Greve JM, Carter DR, Koo S, Giori NJ. Articular cartilage MR imaging and thickness mapping of a loaded knee joint before and after meniscectomy. Osteoarthritis Cartilage 2006;14(8):728–737. [DOI] [PubMed] [Google Scholar]
- 8.Attili AK, Schuster A, Nagel E, Reiber JH, van der Geest RJ. Quantification in cardiac MRI: advances in image acquisition and processing. Int J Cardiovasc Imaging 2010;26 Suppl 1:27–40. [DOI] [PMC free article] [PubMed] [Google Scholar]
- 9.Eckstein F, Lemberger B, Stammberger T, Englmeier KH, Reiser M. Patellar cartilage deformation in vivo after static versus dynamic loading. J Biomech 2000;33(7):819–825. [DOI] [PubMed] [Google Scholar]
- 10.Gold GE, Besier TF, Draper CE, Asakawa DS, Delp SL, Beaupre GS. Weight-bearing MRI of patellofemoral joint cartilage contact area. J Magn Reson Imaging 2004;20(3):526–530. [DOI] [PubMed] [Google Scholar]
- 11.Chan DD, Cai L, Butz KD, Trippel SB, Nauman EA, Neu CP. In vivo articular cartilage deformation: noninvasive quantification of intratissue strain during joint contact in the human knee. Sci Rep 2016;6:19220. [DOI] [PMC free article] [PubMed] [Google Scholar]
- 12.Glaser KJ, Felmlee JP, Manduca A, Kannan Mariappan Y, Ehman RL. Stiffness-weighted magnetic resonance imaging. Magn Reson Med 2006;55(1):59–67. [DOI] [PubMed] [Google Scholar]
- 13.Hardy PA, Ridler AC, Chiarot CB, Plewes DB, Henkelman RM. Imaging articular cartilage under compression--cartilage elastography. Magn Reson Med 2005;53(5):1065–1073. [DOI] [PubMed] [Google Scholar]
- 14.Lopez O, Amrami KK, Manduca A, Ehman RL. Characterization of the dynamic shear properties of hyaline cartilage using high-frequency dynamic MR elastography. Magn Reson Med 2008;59(2):356–364. [DOI] [PubMed] [Google Scholar]
- 15.Feng L, Grimm R, Block KT, et al. Golden-angle radial sparse parallel MRI: combination of compressed sensing, parallel imaging, and golden-angle radial sampling for fast and flexible dynamic volumetric MRI. Magn Reson Med 2014;72(3):707–717. [DOI] [PMC free article] [PubMed] [Google Scholar]
- 16.Sigmund EE, Baete SH, Patel K, et al. Spatially resolved kinetics of skeletal muscle exercise response and recovery with multiple echo diffusion tensor imaging (MEDITI): a feasibility study. MAGMA 2018. [DOI] [PMC free article] [PubMed]
- 17.Souza RB, Stehling C, Wyman BT, et al. The effects of acute loading on T1rho and T2 relaxation times of tibiofemoral articular cartilage. Osteoarthritis Cartilage 2010;18(12):1557–1563. [DOI] [PubMed] [Google Scholar]
- 18.Uecker M, Lai P, Murphy MJ, et al. ESPIRiT--an eigenvalue approach to autocalibrating parallel MRI: where SENSE meets GRAPPA. Magn Reson Med 2014;71(3):990–1001. [DOI] [PMC free article] [PubMed] [Google Scholar]
- 19.Fessler JA. On NUFFT-based gridding for non-Cartesian MRI. J Magn Reson 2007;188(2):191–195. [DOI] [PMC free article] [PubMed] [Google Scholar]
- 20.Zibetti MVW, Baboli R, Chang G, Otazo R, Regatte RR. Rapid compositional mapping of knee cartilage with compressed sensing MRI. J Magn Reson Imaging 2018;48(5):1185–1198. [DOI] [PMC free article] [PubMed] [Google Scholar]
- 21.Zibetti MVW, Sharafi A, Otazo R, Regatte RR. Accelerating 3D-T1rho mapping of cartilage using compressed sensing with different sparse and low rank models. Magn Reson Med 2018;80(4):1475–1491. [DOI] [PMC free article] [PubMed] [Google Scholar]
- 22.Zachiu C, Denis de Senneville B, Dmitriev ID, Moonen CTW, Ries M. A framework for continuous target tracking during MR-guided high intensity focused ultrasound thermal ablations in the abdomen. J Ther Ultrasound 2017;5:27. [DOI] [PMC free article] [PubMed] [Google Scholar]
- 23.Horn BKP, Schunk BG. Determining optical flow. Artificial Intelligence 1981;17:185–203. [Google Scholar]
- 24.Chitiboi T, Axel L. Magnetic resonance imaging of myocardial strain: A review of current approaches. J Magn Reson Imaging 2017;46(5):1263–1280. [DOI] [PubMed] [Google Scholar]
- 25.Chan DD, Neu CP, Hull ML. Articular cartilage deformation determined in an intact tibiofemoral joint by displacement-encoded imaging. Magn Reson Med 2009;61(4):989–993. [DOI] [PMC free article] [PubMed] [Google Scholar]
- 26.Mazzoli V, Schoormans J, Froeling M, et al. Accelerated 4D self-gated MRI of tibiofemoral kinematics. NMR Biomed 2017;30(11). [DOI] [PubMed] [Google Scholar]
Associated Data
This section collects any data citations, data availability statements, or supplementary materials included in this article.
Supplementary Materials
Supplementary Figure 1: Silicone-gel phantom results (a) shows the displacements measured in the loading direction at rest, loading (1, 3 and 5 minutes into the loading condition) and recovery (1, 3 and 5 minutes into recovery) (b) shows the strain in the loading direction (X), (c) shows the strain in the Y direction, and (d) shows the strain in the Z direction


