Abstract
Point-of-care screening for hemodialysis vascular access dysfunction requires tools that are objective and efficient. Listening for bruits during physical exam is a subjective examination which can detect stenosis (vascular narrowing) when properly performed. Phonoangiograms (PAGs)—mathematical analysis of bruits—increases the objectivity and sensitivity and permits quantification of stenosis location and degree of stenosis (DOS). This work describes a flexible and body-conformal multichannel sensor and associated signal processing methods for automated DOS characterization of vascular access. The sensor used an array of thin-film PVDF microphones integrated on polyimide to record bruits at multiple sites along a vascular access. Nonlinear signal processing was used to extract spectral features, and cardiac cycle segmentation was used to improve sensitivity. PAG signal processing algorithms to detect stenosis location and severity are also presented. Experimental results using microphone arrays on a vascular access phantom demonstrated that stenotic lesions were detected within 1 cm of the actual location and graded to three levels (mild, moderate, or severe). Additional PAG features were also used to define a simple binary classifier aimed at patients with failing vascular accesses. The classifier achieved 90% accuracy, 92% specificity, and 91% sensitivity at detecting stenosis greater than 50%. These results suggest that point-of-care screening using microphone arrays can identify at-risk patients using automated signal analysis.
Keywords: Phonoangiogram (PAG), flexible microphone array, vascular access monitoring, PVDF, spectral flux, spectral centroid
I. INTRODUCTION
HEMODIALYSIS is a life-sustaining treatment for individuals with end stage renal disease. During the treatment, arterial blood is filtered in an extracorporeal circuit and returned to the venous system, most often through an upper extremity vascular access. Widely used vascular accesses include arteriovenous fistulas and grafts or central venous catheters [1]. Long-term dialysis efficacy and the lifetime cost of treatment is heavily dependent on maintaining the patency of the vascular access – the so called “Achilles Heel” of hemodialysis [2].
Vascular access dysfunction is the leading cause of hospitalization for patients on hemodialysis, accounting for 20– 30% of hospital visits [3]. The dominant cause of arteriovenous access dysfunction is stenosis (vascular narrowing) which increases the risk of thrombosis (vascular occlusion caused by clotting). These two have a combined incidence of 6673% in arteriovenous fistulas (AVFs) and 85% in arteriovenous grafts (AVGs) [2]. Vascular access maintenance is thus a key objective of Kidney Disease Outcomes Quality Initiatives and dialysis care in general [1], [3].
Regular monitoring for vascular access dysfunction at the point of treatment can identify patients at risk of access thrombosis before full loss of access patency. This approach is enabled by the high frequency of treatment, commonly three times per week. Early detection enables the use of imaging to rule out false positives and treatment planning to avoid emergency interventions. Prominent monitoring strategies include physical exam and dialysis-based measures such as venous pump pressure, blood recirculation, and dialysate flow mismatch. These strategies have sensitivity of 75–82% (physical exam) and 35–48% (dialysis equipment measures) for detecting dysfunctional vascular accesses [5]–[9]. Monthly access blood flow measurement is widely used, but there is a lack of agreement over actionable cutoffs, and studies have reported sensitivities of 24–88% depending on cutoff threshold [10], [11]. By contrast, duplex Doppler ultrasound scanning has 91% sensitivity of detection [10], but this is not typically used unless other evidence of vascular access dysfunction is detected [12], [13].
Monitoring programs in the dialysis center must be efficient and objective to reduce the labor burden and impact to clinical workflow. Physical exam is increasingly disused as it requires additional time per patient and is a subjective measure requiring skill and experience [5], [14]. One important aspect of physical exam is auscultation, in which a stethoscope is used to detect bruits (pathological blood flow sounds caused by vascular stenosis or other abnormalities). Mathematical analysis of bruits, i.e. phonoangiograms (PAGs), has enabled stenosis estimation from bruits spectral properties [15]. However, previous work on PAGs has been limited by using stethoscopes to record bruits from one or two locations on a vascular access [16]–[19]. To enable prospective monitoring at the point of care or in the patient’s home, large-scale microphone arrays can be combined with data recording and digital signal processing circuitry for real-time quantification of vascular access stenosis (Fig. 1). It should be noted that other new technologies for access surveillance in this environment include bilateral photoplethysmography analysis [20] and scanning Doppler capacitive micromachined ultrasonic transducer arrays [21]. These emerging systems can potentially produce more sensitive diagnoses. PAGs, on the other hand, are based on an established element of physical exam, are easy to measure from the skin surface, and are specifically produced by vascular access structures.
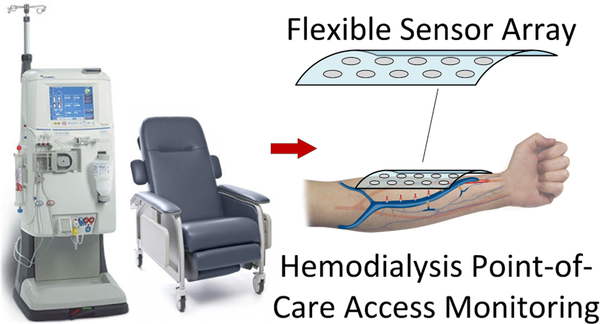
Fig. 1.
Overview of dialysis vascular access monitoring with a flexible array of sensors capable of recording and processing blood flow sounds to determine stenosis risk [4].
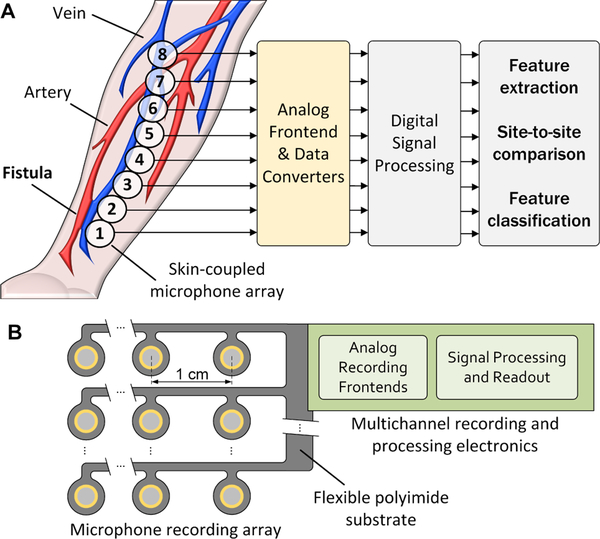
In this work we describe two new elements to enable automated quantification of vascular access bruits: thin-film microphone arrays integrated on polyimide flexible PCBs and a new approach to bruit spectral analysis which separates systole and diastole components. Compared to using stethoscopes, microphone arrays have a significant benefit for pinpointing vascular abnormalities. Further, thin-film contact microphones have greater sensitivity and bandwidth than conventional stethoscopes. In a prospective monitoring scenario, microphone arrays can be used to simultaneously record from many sites along a long and tortuous vascular access (Fig. 2). Correlated signal processing between channels can be used to reject ambient noise and detect site-to-site differences in bruit spectra. Classifier algorithms or other quantification techniques can then be used to automatically detect at-risk patients for follow-up imaging.
Fig. 2.
Prospective monitoring of dialysis vascular access using multi-site PAGs with custom analog front-end and signal processing units (A); a 2D array of microphone sensors that can automatically localize stenosis and produce outputs to determine a map of vascular access function and predict access risk (B).
The paper is organized as follows. Section II presents an overview of prior work in bruit analysis. Section III describes the microphone array fabrication process, transducer characterization, and analog interface. The experimental setup and PAG signal acquisition procedure are described in Section IV. Section V presents a new signal processing approach leveraging channel-to-channel spectral differences for enhanced stenosis detection. Section VI presents stenosis detection performance data from a vascular access phantom, while Section VII concludes the paper.
II. PRIOR WORK IN PHONOANGIOGRAM DETECTION OF VASCULAR ACCESS STENOSIS
Previous studies have analyzed PAGs from humans, vascular bench phantoms, and computer simulations of blood flow. Computational fluid dynamic models have shown that the presence of a stenotic lesion causes turbulent blood flow to occur at distance 1–3 times the vessel diameter distal to stenosis [22], [23]. Turbulent vortices create high-pitched blood flow sounds related to the degree of stenosis (DOS). DOS is defined as the ratio of the stenosed cross-sectional area of the blood vessel to the proximal (non-stenosed) lumen diameter. When DOS exceeds 50%, turbulent flow begins and PAG pitch increases.
The relationship between pitch increase and DOS depends on many factors, including flow rate, pressure, blood viscosity, among others [16]. Therefore, there is little consensus on whether or not turbulent flow causes increased spectral content in a specific band of frequencies, at specific times in the cardiac cycle, or simply produces a general increase in auditory pitch. Moreover, although most studies agreed that DOS caused enhanced high-frequency spectral power [16]–[18], [24]–[32], one prominent study described an opposite effect [15]. This was perhaps due to the effect of DOS to reduce blood flow because blood pressure is regulated; reduced flow would produce lower overall bruit amplitudes due to reduced turbulence [22], [23]. Further, if the location of stenosis is known a priori and recordings are made proximally and distally, DOS can be reasonably estimated using various classifier algorithms [16], [18], [24], [28], [30], [33]–[35].
III. DEVELOPMENT OF THIN FLEXIBLE MICROPHONE ARRAYS FOR PHONOANGIOGRAM RECORDING
Prior studies determined several aspects to motivate the need for improved microphone arrays for PAG detection of stenosis. First, the presence of stenosis affects spectral power in the range of 200–1,000 Hz [15], [17], [18], [25]–[35] which exceeds the neutral bandwidth of stethoscope diaphragms [36]. Second, DOS can be estimated by comparisons of proximal and distal recordings, which requires multiple recording sites, or a priori knowledge of the stenosis location. This effect implies that the location of stenosis can be estimated through recording at all sites along a vascular access and detecting regions of spectral variation caused by local turbulent flow. If a stenotic location is detected, DOS can be quantified by spectral analysis. Third, due to the long length, tortuous, and variable anatomy of vascular accesses in patients, large-scale, flexible microphone arrays are needed to conform to the skin for accurate PAG recordings.
Piezoelectric polymers are widely used in flexible sensing applications where signal frequencies typically above 10 Hz are recorded. Polyvinylidene fluoride (PVDF) is a piezoelectric polymer that is mechanically flexible and sensitive to applied strain, while remaining thin, light-weight and inexpensive which makes it suitable to portable and disposable sensing device. PVDF has been widely used in biomedical signal detection applications such as detection of cardiac rhythm [37], and recording of joint sounds in healthy collegiate athletes [38]. PVDF material has comparable recording properties compared to other piezoelectric crystals for frequency detection above 1 kHz [39] and can be coated in flexible polymers such as polydimethylsiloxane (PDMS) to damp resonant modes or control frequency response in dynamic conditions [40]. This technique has also been used to develop a sensor patch for simultaneous heartbeat and respiration monitoring, with differential layers of PDMS used for mechanical impedance matching [41], [42].
Thin-film PVDF microphones must be constructed appropriately for the desired application and frequency response. First, the mechanical impedance of the microphones must be matched to that of skin for improved sensitivity. Second, the PVDF layer must be differentially coated so it is not located in a neutral plane where it will not encounter strain. Third, the microphone size and backing materials must be selected for the appropriate frequency response. Determination of the microphone size and backing materials was presented in [4] and is summarized in subsequent sections.
Here, we present fabrication details to construct PVDF microphone arrays on conventional polyimide flexible PCBs. This approach supports system-level integration of an analog front-end (AFE) and digital signal processing (DSP) electronics co-located on the polyimide substrate.
A. Thin-Film Microphone Construction
Microphone diaphragms were constructed with 2-mm diameter using 28 μm silver ink metallized PVDF film (Measurement Specialties MEAS). Because the films are polarized, they cannot be heated, so the fabrication method did not expose the film to temperatures above 50°C. Films were cut into required sizes by laser cutter (Versa LASER, Models VLS2.30 and VLS 3.50) in two steps. In all stages of laser cutting, 40 psi of compressed air was jetted onto the substrate for cooling. First, an annular ring of 0.5 mm of metallization was removed from one sensor surface by raster-scanning at 14% power and 30% speed to weaken the metal ink-PVDF bond. Weakened regions were exfoliated by kapton tape prior to cutting through the PVDF film to prevent shorting of the metal across the cut film. A final thickness cut made at 17% power and 100% speed released each transducer element.
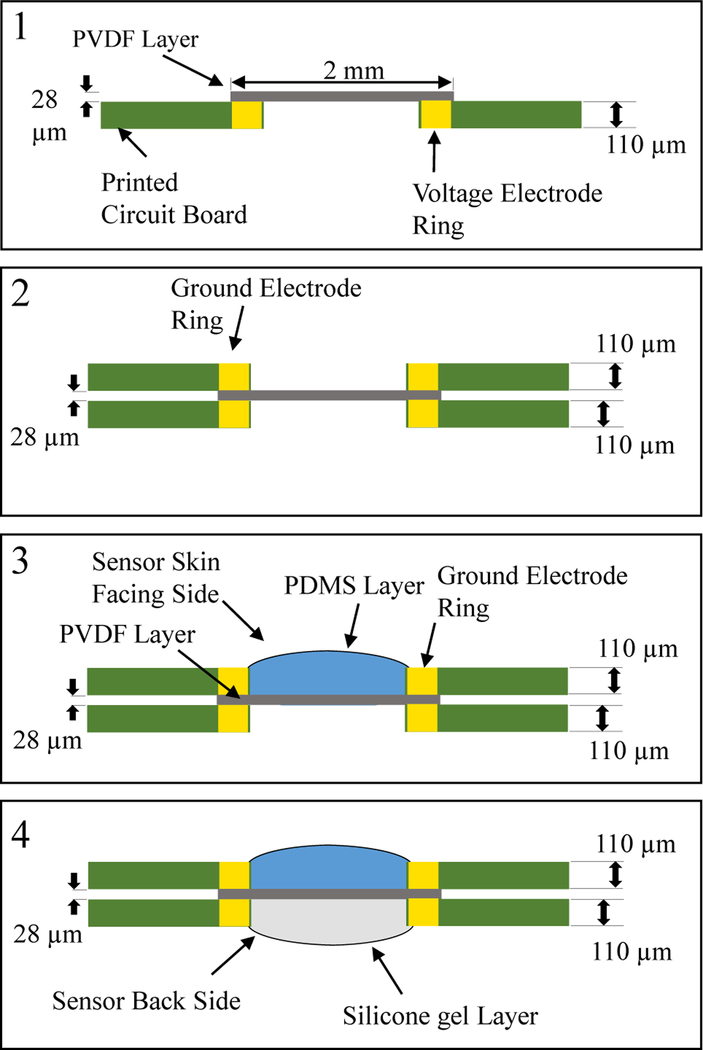
Two-layer polyimide substrates were fabricated using 0.5-oz copper finished with nickel-gold plating. A polyimide coverlay with solder contact openings was applied to both boards for a total finished thickness of 110 μm. Transducers were laminated between two identical PCBs with annular electrical contacts surrounding drilled holes to electrically contact each side of the film separately (Fig. 3). PCB electrodes were attached to the PVDF film using silver conductive epoxy adhesive (MG Chemicals, Model 8331). The skin-facing side of the PVDF film was electrically grounded and covered in a 1 mm PDMS film (Ecoflex 00–10) with similar mechanical impedance as muscle. The opposite side was coated in 110 μm-thick silicone gel (Dow Corning SYLGARD 527 dielectric gel) and sealed with polyimide tape. The 2 mm microphone diameter and gel backing was chosen to optimize acoustic sensitivity and frequency response [4].
Fig. 3.
Microphone construction begins with PVDF film bonded to one side of the circuit board (1). A second board is bonded on the opposite side for electrical connection to both film sides (2) A PDMS layer is deposited to the skin facing side for mechanical impedance matching (3) and silicone gel is applied to the other side for improved acoustic sensitivity (4).
B. Prototype Microphone Array Development
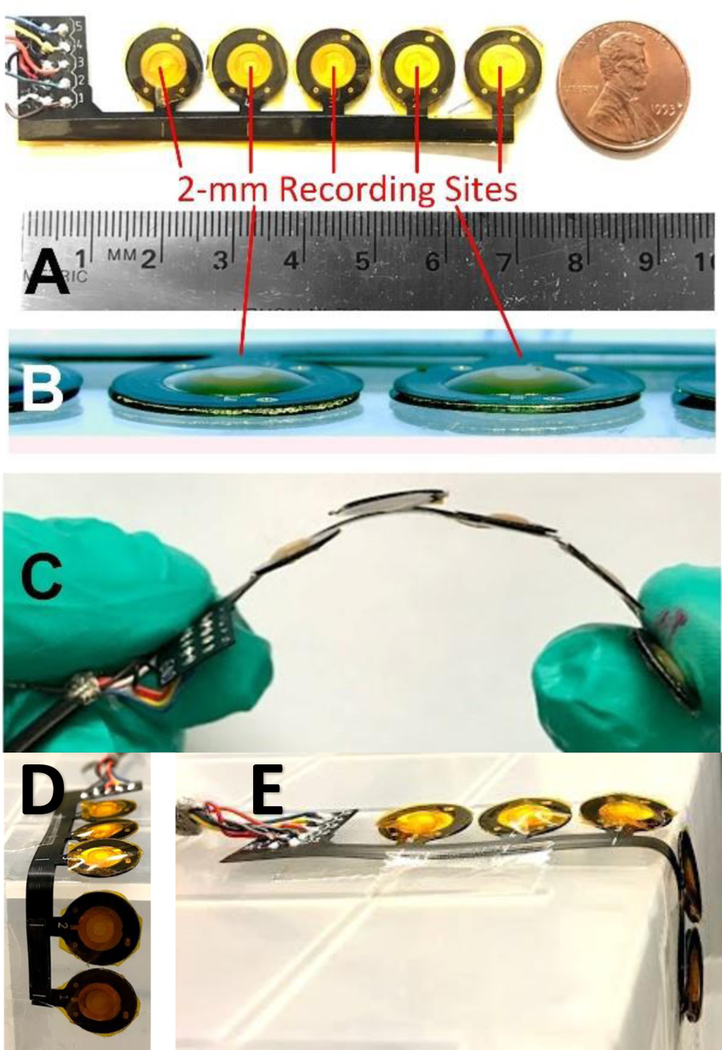
A prototype 5-channel microphone array was developed using the 2-mm PVDF microphone construction. The limited size of this array was sufficient to determine sensor performance, including spatial crosstalk and stenosis localization on a vascular phantom (described below). Analog interface electronics were assembled on a conventional rigid PCB and wired to the flexible microphone array. The array was laid out in a 1 × 5 configuration with 1 cm spacing between microphone centers. This 1 cm spacing was chosen to match the expected distance of turbulent blood flow occurring distal to stenosis [22], [23]. Polyimide PCBs were laser-cut to remove extra material between microphone sites to reduce substrate coupling and crosstalk between channels. Assembled microphone arrays were tested at bends up to 90 degrees with a bending radius of 0.6 cm (Fig. 4).
Fig. 4.
Prototype PAG sensor array based on 2 mm diameter PVDF microphones on polyimide substrate with silicone skin-coupling interface (PDMS) (A). The PAG array was thinner than 1 mm (B) and flexible to conform to vascular access shape (C). Arrays were tested by bending up to 90 degrees (D) with bending radius of 0.6 cm (E) without damage.
C. Microphone Analog Circuit Interface
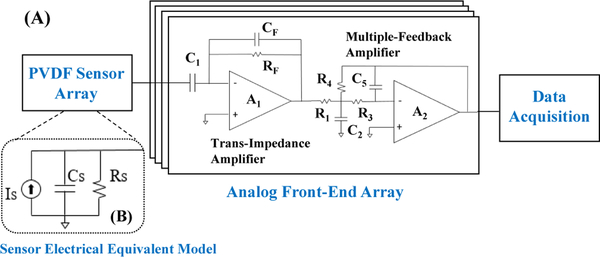
The impedance of the PVDF microphones was measured for 10 assembled devices and averaged to develop a small-signal circuit model (Fig. 5B). An impedance analyzer (Hioki IM3570) was used to obtain the resistance and reactance from 5–5000 Hz and a parallel resistor/capacitor model was fitted. Average values over the tested frequencies were calculated to simplify the model (Table I). To model the equivalent output current for the PVDF film, a precision current amplifier (Stanford Research Systems SIM918) was used to convert current to voltage while recording PAGs from a calibrated vascular phantom. This phantom (described below) produced bruits with less than 2% spectral variance compared to those measured in humans [43]. Typical sensitivity for the 2 mm PVDF microphone over a range of blood flow rates was 15 to 30 nArms equivalent output current.
Fig. 5.
(A) Schematic of the PVDF sensor array and analog front-end, including the trans-impedance amplifier (TIA) and multiple-feedback amplifier (MFA). (B) Electrical equivalent circuit model for a single PVDF sensor.
TABLE I.
MODELED PARAMETERS OF THE PVDF SENSOR AND DESIGN VALUES FOR ANALOG FRONT-END
| Parameter | Value |
|---|---|
| Nominal sensor current (Is) | 15–30 nA |
| Sensor modeled frequency | 100 Hz |
| Modeled sensor capacitance (Cs) | 1 nF |
| Modeled sensor resistance (Rs) | 12.4 MΩ |
| TIA feedback impedance (RF, CF ) | 1 MΩ, 100 pF |
| TIA trans-impedance | 1 V/μA |
| TIA bandwidth | 1.5 kHz |
| Simulated input-referred noise | 1.61 pArms |
| MFA resistors (R1, R3, R4) | 5.23 kΩ, 7.5 kΩ, 182 kΩ |
| MFA capacitors (C2, C5) | 22 nF, 200 pF |
| MFA voltage gain | 33 dB |
| MFA bandwidth | 2 kHz |
The AFE consisted of two stages (Fig. 5A). The first was a trans-impedance amplifier (TIA) A1 to convert the microphone’s output current to voltage with a 1.5-kHz low pass response to set the signal bandwidth, while the second A2 was a multiple-feedback amplifier (MFA) and a low-pass filter with a cutoff at 2 kHz to limit pole splitting with the first stage dominant pole. Both stages used the same CMOS op-amp (TLV9002, Texas Instruments); design parameters are listed in Table I. PVDF sensor values were determined by an equivalent RC model measured at 100 Hz using an LCR Meter (Hioki IM3536). Sensor source current was measured with the sensor placed on a vascular phantom, to estimate the signal level when measuring PAGs from humans. Details of this phantom are in Section V below. A precision current amplifier (Stanford Research Systems SIM918) was used to characterize the range of sensor current when measuring blood flow sounds from the phantom. These nominal sensor values were used to design the AFE transimpedance gain and bandwidth.
D. Microphone Array Performance Characterization
1). Microphone Acoustic Response Characterization:
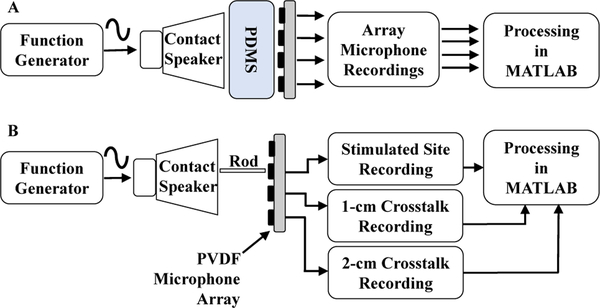
Microphones were characterized for acoustic bandwidth and signal-to-noise ratio (SNR) using a bench setup. A function generator (Agilent 33522A) was used to drive a contact speaker with a variable frequency sinusoid signal from 1 to 10,000 Hz. To avoid harmonics due to overdriving, the driving voltage was limited to 50 mVpp. SNR of the function generator source was measured at 100, 1000 and 1500 Hz using a dynamic signal analyzer (Stanford Research Systems Model SR 785) and the average SNR while driving the contact speaker was 80 ± 2 dB. Low-frequency variation caused the function generator peak output voltage to vary by 1% throughout the test, which could have limited maximum SNR for devices under test. A 6 mm thick section of tissue-mimicking PDMS (Ecoflex 00–10) was placed on top of the speaker to mimic the impedance of human tissue (Fig. 6A). The frequency response of the setup was estimated by using a reference contact microphone (Tyco Electronics CM-01B) to find the inherent transfer function, thus accounting for the non-flat frequency characteristics of the contact speaker and PDMS sections. PVDF microphone recordings were processed through the inverse transfer function to obtain the frequency response, as described in [4]. SNR was also calculated with this setup using fixed tones at 100, 1,000, and 1,500 Hz. The averaged SNR values at each test frequency (Table II) confirmed that the proposed PVDF sensors have excellent SNR compared to similar recording devices.
Fig. 6.
Test setup for frequency response measurement (A) and inter-channel crosstalk measurements at 100 Hz (B).
TABLE II.
MEASURED SNR OF ACOUSTIC SENSORS AT 100, 1000 AND 1500 HZ
| Frequency (Hz) |
SNR (mean ± SD ) | ||
|---|---|---|---|
| Stethoscope (n=3) |
Microphone (n=9) |
PVDF sensor (n=9) |
|
| 100 | 18.7 | 15.5 ± 0.47 | 19.6 ± 4.2 |
| 1000 | 0.06 | 14.4 ± 0.2 | 26.9 ± 7.8 |
| 1500 | 0.018 | 15.0 ± 0.5 | 26.7 ± 8.6 |
2). Inter-channel Crosstalk Characterization:
One major concern with multichannel sensing is the effect of crosstalk between channels. For stenosis localization, low crosstalk is required to detect sudden changes in spectral content caused by turbulent blood flow. Crosstalk was measured on the bench using a similar setup as used for frequency response but with a different coupling method for the contact speaker (Fig. 6B). Instead of placing tissue-mimicking PDMS directly on the speaker, a 2 mm diameter, 10 cm long wooden rod was attached to the voice coil and positioned against the PDMS section to minimize acoustic spreading in the PDMS and approximate an acoustic point source. The point source was placed directly over one microphone in the array while recording from all other sites, and a 100-Hz test tone was applied. Crosstalk was measured as the power ratio of the excited microphone relative to other microphones in the array. The resulting power dropped approximately 41 dB at 1 cm and 53 dB at 2 cm, thus confirming low crosstalk (Table III).
TABLE III.
MEASURED CROSSTALK BETWEEN ADJACENT CHANNELS
| Distance from Source (cm) |
Power (dB) (mean ± SD ) |
Crosstalk value (dB) |
|---|---|---|
| 0 | 29.71 ± 1.12 | |
| 1 | −11.76 ± 4.96 | −41 |
| 2 | −23.81 ± 4.21 | −53 |
IV. CARDIAC-CYCLE BASED PAG SIGNAL PROCESSING
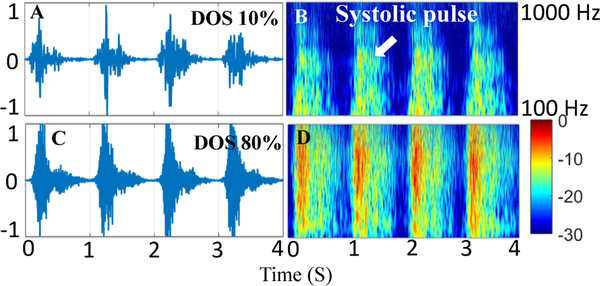
Previous PAG signal processing techniques have used a variety of spectral approaches, including wavelet transform, short-time Fourier transform, and Burg autoregressive spectral estimates [16], [18], [24], [28], [30], [33]–[35]. However, all these methods have operated on aggregate PAG recordings, without time-domain segmentation. Here, we describe a method for cardiac-cycle-based analysis, in which systole and diastole segments are processed separately and spectral comparisons are performed differentially. This method has two distinct advantages. First, cardiac cycles are treated as independent recordings, enabling averaging of values over multiple cycles to reduce spurious interference. Second, because fluid simulations estimate that turbulent flow occurs only during forward blood movement in systole, comparing the spectral gain in systole to diastole reduces variability caused by changes in aggregate blood flow rate or ambient interference measured in both cycles as can be seen in Fig. 7. The spectral power increases in higher spectral bands when the DOS increases from 10% to 80%. Signal processing is used to quantify the properties of spectral change through feature calculation.
Fig. 7.
PAG and Spectrogram recorded from a vascular access phantom with low 10% DOS (A and B) and high 80% DOS (C and D) showing increase in power in higher frequency bands with DOS.
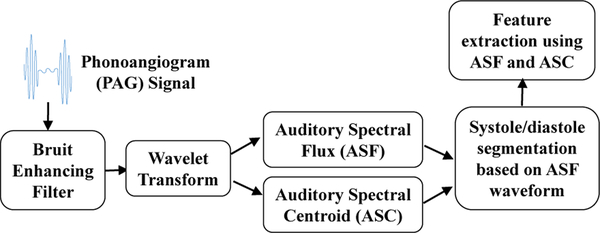
The signal processing approach described here has three stages (Fig. 8). First, raw PAG signals are normalized to the same power level for each recording. This reduces dependence on microphone sensitivity, AFE channel gain, and local pressure on each microphone during recording. This normalization does not affect spectral-based signal processing and feature extraction, discussed later. PAGs are then pre-processed using an autoregressive bruit enhancing filter. Next, auditory analytical waveforms are calculated over entire recordings. Finally, waveforms are separated into systole and diastole segments and features are extracted. After features are calculated, stenosis severity and location are determined by classification methods, discussed in a later section.
Fig. 8.
Overview of the proposed approach for processing PAG signals and extracting relevant features.
A. Autoregressive Bruit-Enhancing Filter
The bruit-enhancing filter (BEF) is based on sub-band frequency domain linear prediction (SB-FDLP) and enhances frequency components nonlinearly based on prominence. Effectively, the BEF enhances the systole portion of recordings because it is in this portion that most high frequency power occurs. A secondary effect of the BEF is to reduce skin scratch and pop noise artifacts obtained due to movement of the recording transducer over the skin. The development of the BEF was based on recordings from hemodialysis patients and described previously [44]. Briefly, SB-FDLP envelopes are calculated from the discrete-cosine transform (DCT) values of the PAG using linear predictive coding (LPC) of the DCT coefficients. When applied in the time domain, LPC estimates the frequency response as an autoregressive model. FDLP applies LPC to frequency-domain DCT coefficients to form an autoregressive model for the time-domain envelope. This implementation uses LPC to model the spectral envelope using a P-th order, all-pole FIR filter defined as
| (1) |
where P is the order of the filter polynomial and P(z) is its z-transform. LPC uses least-squares iterative fitting to determine the coefficients ak of the filter P(z) such that the error in determining the next value of a series is minimized. The calculated filter is an autoregressive model with significantly lower variance than the Hilbert envelope, aiding in noise rejection [44]. SB-FDLP simply applies the LPC to sub-bands of the DCT coefficients, i.e. P(z) in each individual band is represented as Hm(z) where m is for the m-th sub-band. Thus, the impulse response of Hm(z), denoted by Hm[n], predicts the time-domain envelope produced by frequencies of x[n] within the m-th sub-band. Because the poles of Hm(z) are fitted by order of prominence, only the most prominent time-domain occurrences of each sub-band contribution are approximated by the sub-band envelopes.
The N sub-band envelopes Hm[n] are finally combined to produce a bruit-enhanced envelope EBEF[n] using sub-band weights Wm, as follows:
| (2) |
The sub-band weights were chosen empirically based on over 3,000 PAG recordings as described in [44] and in Table IV. After EBEF[n] is constructed, the original signal x[n] is multiplied by EBEF[n] to produce the bruit-enhanced output signal
TABLE IV.
SELECTED BANDS FOR FREQUENCY-DOMAIN MODELING
| Sub-band width | Sub-band weight | |
|---|---|---|
| Band 0 | 25–225 Hz | 5% |
| Band 1 | 350–700 Hz | 50% |
| Band 2 | 650–1000 Hz | 30% |
| Band 3 | 950–1200 Hz | 15% |
B. PAG Auditory Feature Calculation Analysis
After the enhanced PAG is produced, a continuous wavelet transform (CWT) is computed to describe the spectral variance over time. The wavelet transform over k scales W[k, n] was computed as follows:
| (3) |
where ψ[n/k] is the analyzing wavelet at scale k. We used the complex Morlet wavelet because it has a good mapping from scale to frequency.
Next, two fundamental n-point waveforms were calculated from the set of CWT coefficients: Auditory Spectral Flux (ASF) and Auditory Spectral Centroid (ASC). Both ASF and ASC are spectral analytical signals from which auditory features can be extracted.
ASF describes the rate at which the magnitude of the auditory spectrum changes, and approximates a spectral first-order difference or first derivative. It is calculated as the variation between two adjacent time frames:
| (4) |
where W[k, n] is the CWT of the PAG obtained over a total of K scales.
ASC describes the spectral “center of gravity” at each point in time, and is commonly used to estimate the average pitch of audio recordings. For Gaussian-distributed white noise (same spectral power at all frequencies), ASC would be centered at a pseudofrequency F[K/2]. Higher values of the centroid correspond to “brighter” textures with more high frequency content [45]. It is defined as
| (5) |
where fc[k] is the center frequency for the k-th CWT scale.
C. Cardiac Cycle Segmentation of PAG Analytical Signals
During pulsatile blood flow, the high velocity flow in systole produces significant turbulence, causing the characteristic pitch of the bruit [16]. Therefore, the systolic portion of the bruit contains spectral content related to turbulent flow and can be analyzed separately from diastole to improve sensitivity. We implemented a segmentation technique to segment the pulse into systole and diastole periods. Segmentation relied on analyzing the time-domain ASF waveform to identify these epochs. First, 50% of the RMS value of the ASF waveform was calculated as a threshold to identify the start and end of each cardiac cycle.
An initial identification of systole and diastole phases was performed by locating alternating threshold crossings (below threshold to above threshold for start of systole, and the opposite for end of systole). Then selected systolic segments were filtered through two stages. This filtering was reduced threshold double-crossings or crossings caused by transient recording artifacts. In the first stage all detected segments were considered as candidates while in the second stage, valid segments meet two conditions: maximum systolic segment length less than 1 sec and greater than 40% of the longest systolic segment from stage 1. This removed spurious segments caused by recording noise peaks.
D. Segment-Based Spectral Feature Extraction
Previously, we demonstrated the calculation of 13 acoustic features from PAG recordings [43]. We also used ANOVA and principal component analysis (PCA) to determine that ASC mean value and ASF RMS value (ASFRMS) were the two most sensitive for detecting the DOS [43]. In this work, we further enhanced the performance of these features by calculating them separately for systole and diastole cardiac cycle segments. The segmented features were then used independently and through linear combinations to provide augmented features with improved sensitivity. Statistical testing was again used to determine the 4 segment features most strongly variable with DOS, namely systole ASC mean systole ASF RMS (ASFRMS,S), difference between systole ASC and diastole ASC means and multiplication of systole ASC mean and systole ASF RMS
These parameters are defined as follows. First,
| (6) |
where D and S are the start times of a diastole and systole segment respectively. Second,
| (7) |
where Di and Si are the start times of the ith diastole and systole segments, respectively. Finally, the RMS ASF value for each systole segment is calculated as
| (8) |
E. Example of PAG Feature Extraction from a Human Bruit Recording
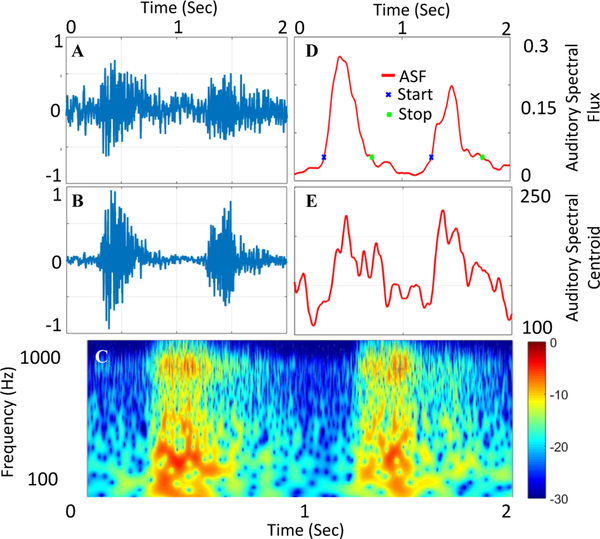
Human bruit recordings were recorded from 24 hemodialysis patients over 18 months and can be processed using the same technique to demonstrate the signal processing steps (Fig. 10 B). First the raw signal is enhanced using bruit-enhancing filter. CWT of the enhanced PAG is next computed (Fig. 10 C) and the coefficients are used to calculate ASF and ASC (Fig. 10 D and E). ASF is then used to segment the waveforms into systole and diastole segments (Fig. 10 D). Then are calculated as discussed above.
Fig. 10.
PAG Signal Processing for human recording showing unprocessed PAG signal (A), denoised using bruit-enhancing filter (B). Continuous wavelet transform (CWT) of the enhanced signal is calculated for auditory feature extraction (C). Auditory Spectral Flux (ASF) approximates a spectral first derivative and is used to segment the waveforms into segments for segmented feature extraction (D). Auditory Spectral Centroid (ASC) is the spectral ”center of gravity” (E).
V. STENOSIS LOCALIZATION AND QUANTIFICATION PERFORMANCE ON VASCULAR ACCESS PHANTOM
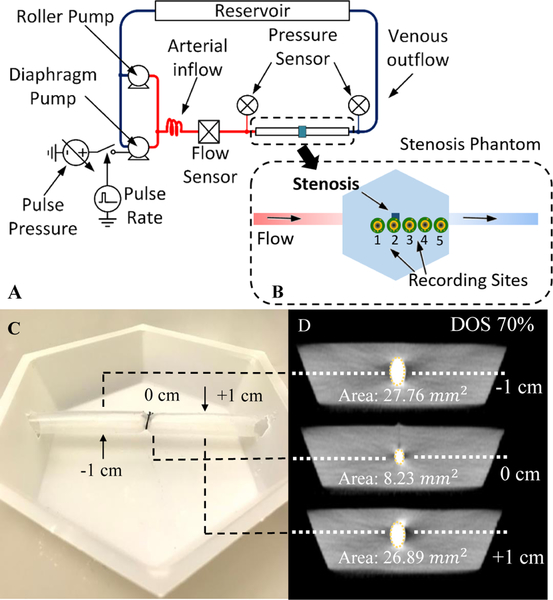
To simulate how the sensor would perform on a real patient (but in a controlled environment), recordings were made on a vascular access phantom. The phantom consisted of a 6 mm silicone tube embedded in PDMS rubber (Ecoflex 00–10) at 6 mm depth. Stenosis was simulated in the center of the phantom with a silk band tied around the tube to produce an abrupt narrowing. The DOS was controlled by tying the band around metal rods with fixed diameters (Fig. 11 C). DOS was later confirmed by calculating the percentage of lumen diameter reduction from CT scans of phantoms (Fig. 11 D).
Fig. 11.
(A) Vascular stenosis phantom flow diagram. Two pumping systems produced pulsatile flows in a vascular access phantom within physiological ranges of flow and pressure. The recording sites are shown in the stenosis phantom diagram (B). 10–85% stenosis is simulated in the center of phantom by tying the band around 6-mm silicone tubing (C). Computed CT Slices validates degree of stenosis (DOS) in the phantom (D).
The phantom was connected to a pulsatile flow pumping system (Cole Parmer MasterFlex L/S, Shurflo 4008) to simulate human hemodynamic flow from 700–1200 ml/min. Pulsatile pressures and aggregate flow rate were measured with a pressure sensor (PendoTech N-038 PressureMAT) and flow sensor (Omega FMG91-PVDF) respectively (Fig. 11 A).
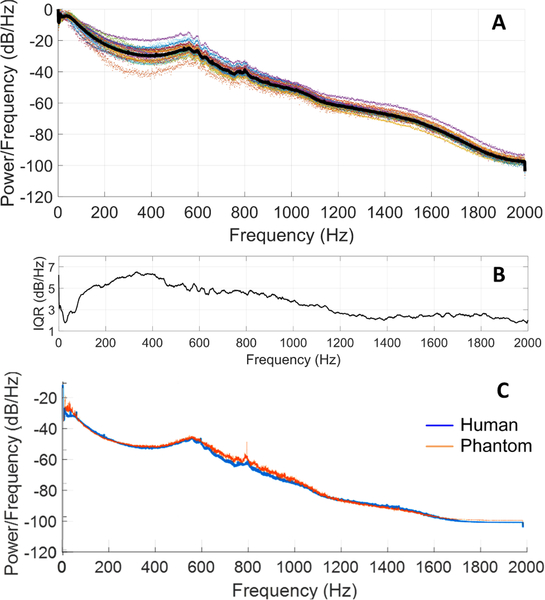
To validate the phantom auditory signals, recordings were made using a digital stethoscope (Littman 3200) and compared to recordings from humans. An aggregate power spectrum was produced from 3,441 unique 10 sec recordings obtained from 24 hemodialysis patients over 18 months (Fig. 12). Despite large anatomical differences in this patient group, the interquartile range of all measurements from the mean spectrum was within 3–5 dB. The vascular phantoms were therefore tuned to produce a power spectrum to match the aggregate human power spectrum with the expectation that this would capture the range of human spectral power within 5 dB. Spectral comparisons between human and phantom data were used to reduce time-domain variability, for example due to heart rate differences. Human and phantom spectra followed similar spectral trends and showed similar dynamic range in time-domain analysis. Quantitatively, the normalized RMS error of the aggregate power spectrum was calculated over the aggregate human PAG spectra range. The vascular phantoms matched the aggregate human PAG spectra with a 1.84% normalized RMS error, scaled to the total power spectrum range [43]. This comparison suggested that the vascular stenosis phantoms adequately replicated PAGs as measured from humans, but with control over vascular access flow rate and stenosis severity.
Fig. 12.
PAG spectra from 24 hemodialysis patients over 18 months (3,441 recordings) (black line is the average power spectrum) (A), after [43]. Power differences in each frequency bin showed an interquartile range (IQR) of 3–5 dB/Hz between subjects (B). The tuned vascular phantom power spectrum matched the average human spectrum by 98.2% (C).
A. Stenosis Severity Detection from Recorded PAGs at Variable Flow Rates
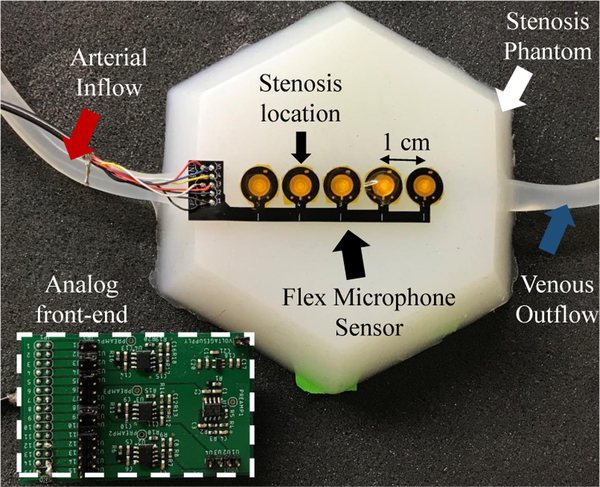
We investigated PAGs from 10 phantoms with DOS from 10–85% to simulate a varying patient population. A set of 10 s recordings were made with the flexible sensor array (discussed earlier) at 6 flow rates (700 – 1200 mL/min) to represent nominal physiological flow rates in functional vascular accesses [43]. PAGs were recorded at four locations simultaneously spaced 1 cm apart, with one being proximal, one on the stenosis and two others distal to stenosis (Fig. 13) with Labview software and National Instruments data acquisition hardware at a sampling rate of 10 kHz. 5 g weights were placed on the back of each sensor to produce 50 mN of contact force. This light force reduced vibration artifacts and improved recording sensitivity. After recording, signals were transferred to MATLAB for signal processing and calculation of ASF and ASC waveforms. Signals were segmented into systole and diastole phases and features calculated separately. Because the ASF had a significant pulsatile component, RMS ASF values were used; otherwise mean ASC values were calculated in each cardiac segment.
Fig. 13.
Banded silicone tubing embedded in silicone rubber was used as a vascular stenosis phantom. Audio recordings from the phantom at sites along the direction of flow were made using the PVDF microphone array and a multi-channel front-end amplifier board.
Features were extracted for each PAG based on previous work [43]. These features are based on ASC and ASF values that are analyzed with two primary outcomes: localization of the stenosis, and differentiation of the DOS. Balanced Analysis of Variance (ANOVA) was conducted to detect differences in PAGs at different locations and at different DOS over a range of flows. The effect of flow on ASC and ASF was not studied; variable flow was used to represent this confounding variable in humans [16]. ANOVA was used to test the differences between means for statistical significance. The total number of recordings were 50 per location including all phantoms and flow rates. After segmentation there were approximately 350 systole and diastole segments for each phantom-location combination in this analysis.
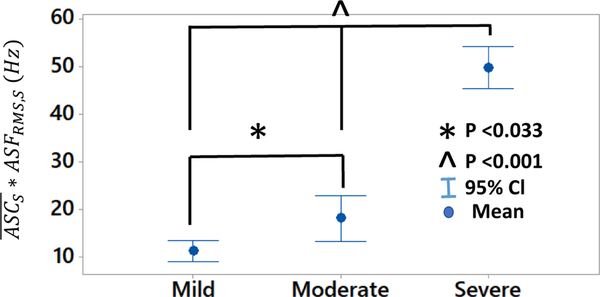
performed well in differentiating degree of stenosis in 3 grades: mild (DOS<40%), moderate (40%<DOS<60%) and severe (DOS>60%) as used in clinical settings for severity classification [46], [47]. Independent to flow rate, showed statistical significant different means in mild, moderate and severe DOS grades at location 3 and 4 combined. Also, we observed a monotonic increase in the with increase in DOS (Fig. 14). This result suggests that simple threshold-based detection can be used for classification of stenosis severity.
Fig. 14.
The feature demonstrated good stenosis classification, allowing for differentiation between mild (DOS<40%), moderate (40%<DOS<60%), and severe (DOS>60%) stenosis at flow levels ranging between 700 and 1,200 mL/min.
B. Stenosis Location Detection Based on Channel-to-Channel Acoustic Centroid Shift
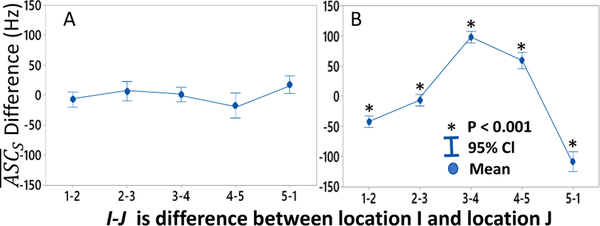
The difference in between adjacent locations was calculated to estimate the most likely location of the stenosis. The interval plot (Fig. 15) indicates that there is a positive shift between differences from proximal to distal locations. In this experiment, the actual stenosis was located directly under location 2; location 1 was recorded 1 cm proximal, and locations 3, 4 and 5 were 1, 2 and 3 cm distal to stenosis. In general, differences between locations 3 and 4 and 4 and 5 were positive by at 50–70 Hz while the other site differences were negative. This suggests that a simple threshold difference of 70 Hz in between adjacent array recording locations can identify stenosis proximally to the recording sites within a range of 1–2 cm
Fig. 15.
Difference in between adjacent locations showed no significant variation for 0% DOS (P>0.05) (A). A large spectral shift at locations distal to stenosis (stenosis center at location 2) (B) Data plotted for phantoms with 30%<DOS<90%, p<0.001 for all locations
C. Threshold-Based Classifier for Point-of-Care Detection of Failing Vascular Access
For point-of-care use, a simple scheme is needed to identify which patients have a failing vascular access or are at risk for thrombosis. This would identify patients with a hemodynamically-significant stenosis, defined clinically as DOS > 50% [48]. Based on ASC and ASF values discussed above, we designed a binary classifier to classify DOS into two groups (Table V). Such patients might be selected for an imaging study or entered into a vascular surveillance program to reduce emergency interventions or for treatment planning.
TABLE V.
BINARY CLASSIFIER FOR QUANTIFYING DOS SEVERITY
| Degree of stenosis (DOS) |
Type | Target vector output |
|---|---|---|
| Below 50% | Normal (healthy) | 0 |
| Above 50% | Pathological (unhealthy) | 1 |
Classifier performance was measured by receiver operating characteristic (ROC). For each selected threshold of detection, true positive was counted when the recording feature exceeded the threshold with DOS greater than 50%. Similarly, detection of DOS less than 50% was classified as true negative detection. We tested the classifier on independently for each recording location.
Threshold optimization was performed by maximizing Youden’s Index (J), which is a function of sensitivity (q) and specificity (p) and is a commonly used measure of overall diagnostic effectiveness. It is defined as
| (9) |
over all threshold points c. The optimum threshold J0 for J was calculated for each classifier and for each location.
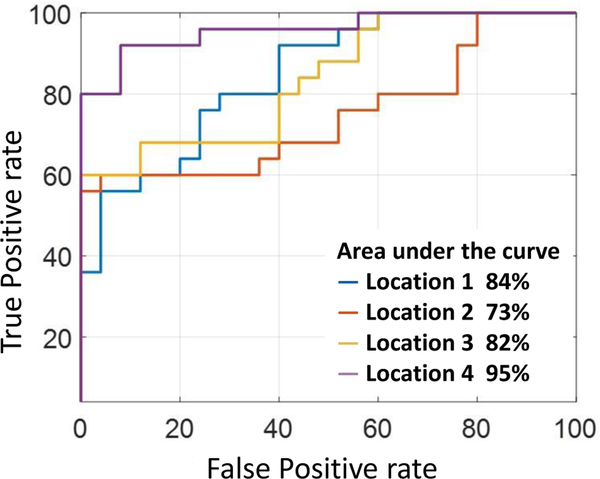
The feature had best sensitivity at Location 2 and best specificity at Location 4. Location 2 was recorded directly over the point of stenosis and Location 4 was at the turbulent flow vortex. A similar trend was seen for Overall, both ASC features performed well with high sensitivity (68–92%). The ASFRMS,S feature had good specificity at locations distal to stenosis. Sensitivity and specificity were generally inversely proportional in nature, i.e., when sensitivity increased, the specificity decreased. Thus which is the product of (high sensitivity) and ASFRMS,S (high specificity) achieved good overall sensitivity and specificity at Location 4. This combined feature classified DOS > 50% with an accuracy of 90%, specificity of 92%, and sensitivity of 92% (Figure 16). Best achieved area-under-the-curve was at Location 4 with 95%.
Fig. 16.
ROC curve of . Greatest area-under-the curve (95%) was achieved at Location 4 distal to the stenosis.
VI. DISCUSSION
Patients with end-stage renal disease (ESRD) have significant mortality, co-morbidity, and hospitalizations compared to the general population. Longitudinal recordings of PAGs are therefore difficult to interpret due to uncontrollable factors. There is also wide variation in vascular access anatomy in patients with ESRD, especially with malformations such as pseudo-aneurysm. This anatomic variance was not investigated in our study. To study PAGs in a controlled setting our study used vascular stenosis phantoms with controlled degree of stenosis and variable physiologic blood pressure and flow. PAG spectra from the tuned phantoms were 98% spectrally matched to the aggregate PAG spectrum from humans with ESRD. This controlled model allowed us to for the first time precisely describe how certain acoustic features of PAGs are affected by degree of stenosis. Further, with a priori knowledge of stenosis location, we demonstrated that recording arrays can detect local regions of turbulent blood flow. Most importantly, our presented statistical analyses for each DOS spanned a wide range of blood flow rates (700 – 1,200 mL/min).
Consideration must be given to how these sensor arrays would be used in the clinic or patient’s home. Our study used linear, 5-channel recording arrays, but larger, 2-dimensional arrays might be needed to cover the full vascular access anatomy. The presented fabrication method supports development of larger, conformal, 2-dimensional arrays to cover the full vascular access anatomy. These arrays could be bonded to removable vinyl cuffs (as used for blood pressure measurement) and wrapped around the vascular access during recording to maintain pressure on all microphone sites. Arrays were flexible enough to bend around 0.6-mm radius curves at 90 degrees and microphones required only 50 mN of force against the skin for accurate recording. Additionally, the array materials exposed to skin (polyimide and silicone) have been previously demonstrated in wearable applications without causing skin allergy. As larger arrays are fabricated, acoustic bandwidth matching between channels will be more challenging, as large changes in microphone frequency response could affect spectral analysis. Clinical testing with larger arrays is needed to determine how well these constraints can be met in human use.
Finally, our results suggested thresholds which could be used for clinical monitoring of stenosis formation. We estimated that site-to-site differences in systolic ASC greater than 70 Hz were caused by the presence of vascular stenosis. In terms of stenosis classification, we demonstrated a simple threshold-based binary classifier based on a combined feature. Compared with more complex training-based classifiers, a simple threshold-based classifier is potentially more generalizable e.g. to develop clinical standards for interpretation, and less susceptible to over-fitting. Additionally, because the ASC and ASF calculations average out spurious peaks, a simple threshold might be sufficient for clinical use. However, although the PAG processing reduces the impact of noise, the use of binary threshold could be too simplistic for complex cases. Therefore, clinical testing will be needed to determine how robust the detection is to false positives due to motion artifacts or insufficient sensor contact pressure.
VII. CONCLUSION
This work had two primary goals: to detect the location of a stenotic lesion, and to detect stenosis > 50% using PAGs, regardless of the level of blood flow in the vascular access. Our in vitro tests on vascular phantoms spanned a range of simulated stenosis severity (10–85%) over blood flows ranging from 700–1200 mL/min. These values were chosen to represent adequate blood flow in vascular accesses to support dialysis treatment. Despite having sufficient blood flow, however, accesses with significant stenosis (> 50% ) represented patients who would be at-risk for clotting or rapid stenosis progression due to cell growth. The clinical challenge, in this case, is that patients with significant stenosis still receiving dialysis treatment might not be identified. PAG-based detection of stenosis location, and severity could help to screen at-risk patients as they are receiving treatment. This study demonstrated for the first time that a stenotic lesion can be located within 1 cm and graded by severity using a non-invasive microphone array and spectral signal processing. Future clinical testing is needed to determine how accurately these arrays can detect the formation of vascular access stenosis in real time.
Fig. 9.
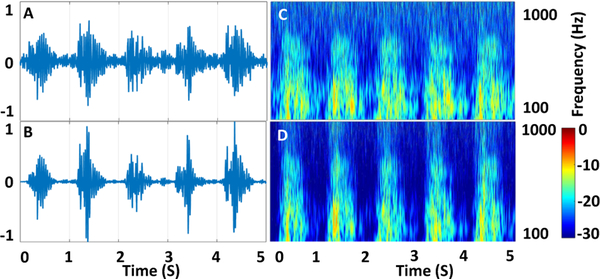
PAG signal and its spectrogram before the bruit-enhancing filter (A and C), and after the filter (B and D). The filter enhances the systole while reducing inter-systole noise.
Acknowledgments
This work was funded by the U.S. Department of Veterans Affairs Rehabilitation Research and Development Service under grant RX001968–01, the Advanced Platform Technology Center of the Louis Stokes Cleveland Veterans Affairs Medical Center, and Case Western Reserve University. The contents do not represent the views of the US Government.
Biography

Binit Panda (M’18) received the B.Tech. degree in electronics and telecommunication engineering from Mukesh Patel School of Technology Management and Engineering in Mumbai, India, in 2016 and the M.S. in Biomedical Engineering from Case Western Reserve University in 2019. During his M.S. degree, he worked at Philips Healthcare in CT/AMI imaging focusing on Image Reconstruction Physics. He now works for Cleveland Clinic as a Research Engineer in Cleveland, OH, USA. He has 5 peer-reviewed publications, and holds 2 pending patents. His research interests include developing flexible wearable sensors, low-power wireless sensors for physiology research and image reconstruction algorithms. His work is dedicated to his mother.

Soumyajit Mandal (S’01-M’09-SM’14) received the B.Tech. degree in electronics and electrical communications engineering from IIT Kharagpur, India, in 2002, and the M.S. and Ph.D. degrees in electrical engineering from the Massachusetts Institute of Technology (MIT), Cambridge, MA, USA, in 2004 and 2009, respectively. He was a Research Scientist at Schlumberger-Doll Research, Cambridge, MA, USA, from 2010 to 2014. He is currently the T. and A. Schroeder Assistant Professor in the Department of Electrical Engineering and Computer Science, Case Western Reserve University, Cleveland, OH, USA.
Dr. Mandal’s research interests include analog and biological computation, magnetic resonance sensors, low-power analog and RF circuits, and precision instrumentation for various biomedical and sensor interface applications. He was a recipient of the President of India Gold Medal (2002), MIT Microsystems Technology Laboratories (MTL) Doctoral Dissertation Award (2009), T. Keith Glennan Fellowship (2016), and IIT Kharagpur Young Alumni Achievers Award (2018). He has over 125 publications in peer-reviewed journals and premier conferences, and has been awarded 18 patents.

Steve J.A. Majerus (S’07-M’14–SM’16) received the B.S. and M.S. degrees in electrical engineering from Case Western Reserve University (CWRU) in 2007 and the Ph.D. degree in electrical engineering with a focus in integrated circuit design and implantable medical devices from the same university in 2014.
He was a Biomedical Engineer in the Advanced Platform Technology Center (APTC) at the Louis Stokes US Dept of Veterans Affairs (VA) Medical Center in Cleveland, Ohio, USA from 2007 to 2015. He also worked as a Senior Research Associate at CWRU in wide bandgap SiC JFET ASICs from 2014 to 2016 and as a high-temperature aeronautic CMOS ASIC designer for Scientific Monitoring, Inc. from 2010 to 2014. Since 2015, he has been a Research Scientist with the APTC. He also holds a secondary appointment in the Nephrology Service of the Northeast Ohio VA Healthcare System after receiving the Louis Stokes Research Fellowship Award in 2018. He has contributed to more than 40 peer-reviewed publications, and holds 6 issued or pending patents. His current research interests include passive acoustic detection of vascular access stenosis, temporal-spectral signal processing of blood sounds, flexible microphone arrays, implantable ultralow-power bio-sensors, and flexible sensor systems for cardiovascular health monitoring.
Contributor Information
Binit Panda, Department of Biomedical Engineering, Case Western Reserve University, Cleveland, OH 44106, USA..
Soumyajit Mandal, Department of Electrical, Computer, and Systems Engineering, Case Western Reserve University, Cleveland, OH 44106, USA..
Steve J. A. Majerus, S. Majerus is with the Advanced Platform Technology Center, Louis Stokes Cleveland VA Medical Center, Cleveland, OH 44106, USA..
REFERENCES
- [1].Hemodialysis Adequacy 2006 Work Group, “Clinical practice guidelines for hemodialysis adequacy, update 2006.” American journal of kidney diseases : the official journal of the National Kidney Foundation, vol. 48 Suppl 1, pp. 2–90, 7 2006. [DOI] [PubMed] [Google Scholar]
- [2].Pisoni RL et al. , “Trends in US Vascular Access Use, Patient Preferences, and Related Practices: An Update From the US DOPPS Practice Monitor With International Comparisons,” American Journal of Kidney Diseases, vol. 65, no. 6, pp. 905–915, 6 2015. [DOI] [PubMed] [Google Scholar]
- [3].Feldman HI et al. , “Hemodialysis vascular access morbidity.” Journal of the American Society of Nephrology, vol. 7, no. 4, 1996. [DOI] [PubMed] [Google Scholar]
- [4].Panda B et al. , “Skin-Coupled PVDF Microphones for Noninvasive Vascular Blood Sound Monitoring,” in 2018 IEEE Signal Processing in Medicine and Biology Symposium (SPMB) IEEE, 12 2018, pp. 1–4. [DOI] [PMC free article] [PubMed] [Google Scholar]
- [5].Tessitore N et al. , “The Rise and Fall of Access Blood Flow Surveillance in Arteriovenous Fistulas,” Seminars in Dialysis, vol. 27, no. 2, pp. 108–118, 3 2014. [DOI] [PubMed] [Google Scholar]
- [6].Krivitski NM, “Theory and validation of access flow measurement by dilution technique during hemodialysis.” Kidney international, vol. 48, no. 1, pp. 244–50, 7 1995. [DOI] [PubMed] [Google Scholar]
- [7].Greenberg J et al. , “Long-Term Outcomes of Fistula First Initiative in an Urban University Hospital-Is It Still Relevant?” Vascular and endovascular surgery, vol. 51, no. 3, pp. 125–130, April 2017. [DOI] [PMC free article] [PubMed] [Google Scholar]
- [8].Kazemzadeh G et al. , “Primary patency rate of native av fistula: Long term follow up,” International journal of clinical and experimental medicine, vol. 5, pp. 173–8, 04 2012. [PMC free article] [PubMed] [Google Scholar]
- [9].White JJ et al. , “Influence of Luminal Diameters on Flow Surveillance of Hemodialysis Grafts: Insights from a Mathematical Model,” Clinical Journal of the American Society of Nephrology, vol. 1, no. 5, pp. 972–978, 9 2006. [DOI] [PubMed] [Google Scholar]
- [10].Krivitski N, “Why Vascular Access Trials on Flow Surveillance Failed,” The Journal of Vascular Access, vol. 15, no. 7_suppl, pp. 15–19, 5 2014. [DOI] [PubMed] [Google Scholar]
- [11].Tessitore N and Poli A, “Pro: Vascular access surveillance in mature fistulas: is it worthwhile?” Nephrology Dialysis Transplantation, vol. 34, no. 7, pp. 1102–1106, July 2019. [DOI] [PubMed] [Google Scholar]
- [12].H. Inc for OSORA CMS, “Medicare Claims Processing Manual Chapter 8-Outpatient ESRD Hospital, Independent Facility, and Physician/Supplier Claims Transmittals,” Tech. Rep. [Google Scholar]
- [13].Salman L and Beathard G, “Interventional Nephrology: Physical Examination as a Tool for Surveillance for the Hemodialysis Arteriovenous Access,” Clinical Journal of the American Society of Nephrology, vol. 8, no. 7, pp. 1220–1227, 7 2013. [Online]. Available: https://cjasn.asnjournals.org/content/8/7/1220 [DOI] [PubMed] [Google Scholar]
- [14].Maldonado-Carceles AB´ et al. , “Performance of physical examination versus ultrasonography to detect stenosis in haemodialysis arteriovenous fistula,” The Journal of Vascular Access, vol. 18, no. 1, pp. 30–34, January 2017. [DOI] [PubMed] [Google Scholar]
- [15].Mansy HA et al. , “Computerised analysis of auscultatory sounds associated with vascular patency of haemodialysis access.” Medical & biological engineering & computing, vol. 43, no. 1, pp. 56–62, 1 2005. [DOI] [PubMed] [Google Scholar]
- [16].Sung PH et al. , “Hemodialysis vascular access stenosis detection using auditory spectro-temporal features of phonoangiography,” Medical and Biological Engineering and Computing, vol. 53, no. 5, pp. 393–403, 2015. [DOI] [PubMed] [Google Scholar]
- [17].Hsien-Yi Wang H-Y et al. , “Novel Noninvasive Approach for Detecting Arteriovenous Fistula Stenosis,” IEEE Transactions on Biomedical Engineering, vol. 61, no. 6, pp. 1851–1857, 6 2014. [DOI] [PubMed] [Google Scholar]
- [18].Wang Y-N et al. , “The Detection of Arteriovenous Fistula Stenosis for Hemodialysis Based on Wavelet Transform,” Tech. Rep, 2011. [Google Scholar]
- [19].Du Y-C et al. , “Residual Stenosis Estimation of Arteriovenous Grafts Using a Dual-Channel Phonoangiography With Fractional-Order Features,” IEEE Journal of Biomedical and Health Informatics, vol. 19, no. 2, pp. 590–600, 3 2015. [DOI] [PubMed] [Google Scholar]
- [20].Wu JX et al. , “Bilateral photoplethysmography analysis for peripheral arterial stenosis screening with a fractional-order integrator and info-gap decision-making,” IEEE Sensors Journal, vol. 16, no. 8, pp. 2691–2700, April 2016. [Google Scholar]
- [21].Lemmerhirt DF et al. , “An electronically-scanned CMUT-in-CMOS transducer for hemodialysis vascular access monitoring,” in IEEE International Ultrasonics Symposium, IUS, 2011, pp. 2193–2196. [Google Scholar]
- [22].Gaupp S et al. , “Characterisation of vortex shedding in vascular anstomosis models using pulsed doppler ultrasound,” Tech. Rep, 1999. [DOI] [PubMed] [Google Scholar]
- [23].Gårdhagen R, Turbulent Flow in Constricted Blood Vessels Quantification of Wall Shear Stress Using Large Eddy Simulation, 2013. [Google Scholar]
- [24].Chen W-L et al. , “Stenosis Detection using Burg Method with Autoregressive Model for Hemodialysis Patients,” Journal of Medical and Biological Engineering, vol. 33, no. 4, p. 356, 2013. [Google Scholar]
- [25].Akay Y et al. , “Noninvasive acoustical detection of coronary artery disease: a comparative study of signal processing methods,” IEEE Transactions on Biomedical Engineering, vol. 40, no. 6, pp. 571–578, 6 1993. [DOI] [PubMed] [Google Scholar]
- [26].Obando PV and Mandersson B, “Frequency tracking of resonant-like sounds from audio recordings of arterio-venous fistula stenosis,” in 2012 IEEE International Conference on Bioinformatics and Biomedicine Workshops IEEE, 10 2012, pp. 771–773. [Google Scholar]
- [27].Sato T et al. , “Evaluation of blood access dysfunction based on a wavelet transform analysis of shunt murmurs,” Journal of Artificial Organs, vol. 9, no. 2, pp. 97–104, 6 2006. [DOI] [PubMed] [Google Scholar]
- [28].Gram M et al. , “Stenosis Detection Algorithm for Screening of Arteriovenous Fistulae,” 2011, pp. 241–244. [Google Scholar]
- [29].Todo A et al. , “Frequency analysis of shunt sounds in the arteriovenous fistula on hemodialysis patients,” in The 6th International Conference on Soft Computing and Intelligent Systems, and The 13th International Symposium on Advanced Intelligence Systems IEEE, 11 2012, pp. 1113–1118. [Google Scholar]
- [30].Chen W-L et al. , “Phonographic signal with a fractional-order chaotic system: a novel and simple algorithm for analyzing residual arteriovenous access stenosis,” Medical & Biological Engineering & Computing, vol. 51, no. 9, pp. 1011–1019, 9 2013. [DOI] [PubMed] [Google Scholar]
- [31].Grochowina M et al. , “Application of Artificial Neural Networks for the Diagnosis of the Condition of the Arterio-venous Fistula on the Basis of Acoustic Signals,” pp. 400–411, 2014. [Google Scholar]
- [32].Rousselot L, “Acoustical Monitoring of Model System for Vascular Access in Haemodialysis,” Master’s thesis, TU Delft, 2014. [Google Scholar]
- [33].Chen W-L et al. , “Arteriovenous Shunt Stenosis Evaluation Using a Fractional-Order Fuzzy Petri Net Based Screening System for LongTerm Hemodialysis Patients,” Journal of Biomedical Science and Engineering, vol. 07, no. 05, pp. 258–275, 4 2014. [Google Scholar]
- [34].Munguia MM and Mandersson B, “Analysis of the vascular sounds of the arteriovenous fistula’s anastomosis,” in 2011 Annual International Conference of the IEEE Engineering in Medicine and Biology Society IEEE, 8 2011, pp. 3784–3787. [DOI] [PubMed] [Google Scholar]
- [35].Vesquez P et al. , “Arteriovenous fistula stenosis detection using wavelets and support vector machines,” in 2009 Annual International Conference of the IEEE Engineering in Medicine and Biology Society IEEE, 9 2009, pp. 1298–1301. [DOI] [PubMed] [Google Scholar]
- [36].Leng S et al. , “The electronic stethoscope,” BioMedical Engineering OnLine, vol. 14, no. 1, p. 66, July 2015. [DOI] [PMC free article] [PubMed] [Google Scholar]
- [37].Kalange A and Gangal S, “Piezoelectric Sensor for Human Pulse Detection,” Defence Science Journal, vol. 57, no. 1, pp. 109–114, 1 2007. [Google Scholar]
- [38].Teague CN et al. , “Novel Methods for Sensing Acoustical Emissions From the Knee for Wearable Joint Health Assessment,” IEEE Transactions on Biomedical Engineering, vol. 63, no. 8, pp. 1581–1590, 8 2016. [DOI] [PubMed] [Google Scholar]
- [39].Hallikar RS et al. , “Design and Implementation of Multichannel Piezoelectric Acoustic Sensor,” in Proceedings of 2015 COMSOL Conference, 2015, pp. 1–4. [Google Scholar]
- [40].Lei KF et al. , “The structure design of piezoelectric poly(vinylidene fluoride) (PVDF) polymer-based sensor patch for the respiration monitoring under dynamic walking conditions,” Sensors (Switzerland), vol. 15, no. 8, pp. 18801–18812, 2015. [DOI] [PMC free article] [PubMed] [Google Scholar]
- [41].Chiu Y-Y et al. , “Development of a piezoelectric polyvinylidene fluoride (PVDF) polymer-based sensor patch for simultaneous heartbeat and respiration monitoring,” Sensors and Actuators A: Physical, vol. 189, pp. 328–334, 1 2013. [Google Scholar]
- [42].Jiang Y et al. , “A PVDF-based flexible cardiorespiratory sensor with independently optimized sensitivity to heartbeat and respiration,” Procedia Engineering, vol. 5, pp. 1466–1469, 1 2010. [Google Scholar]
- [43].Chin S et al. , “Stenosis characterization and identification for dialysis vascular access,” in 2018 IEEE Signal Processing in Medicine and Biology Symposium (SPMB) IEEE, 2018, pp. 1–5. [DOI] [PMC free article] [PubMed] [Google Scholar]
- [44].Majerus SJA et al. , “Bruit-enhancing phonoangiogram filter using sub-band autoregressive linear predictive coding,” in 2018 40th Annual International Conference of the IEEE Engineering in Medicine and Biology Society (EMBC) IEEE, 7 2018, pp. 1416–1419. [DOI] [PMC free article] [PubMed] [Google Scholar]
- [45].Tzanetakis G and Cook P, “Musical Genre Classification of Audio Signals,” IEEE Transactions on Speech and Audio Processing, vol. 10, no. 5, p. 293, 2002. [Google Scholar]
- [46].Lee KW et al. , “Measurement of carotid artery stenosis: Correlation analysis between B-mode ultrasonography and contrast arteriography,” Journal of the Korean Surgical Society, vol. 80, no. 5, pp. 348–354, May 2011. [DOI] [PMC free article] [PubMed] [Google Scholar]
- [47].Von Reutern GM et al. , “Grading carotid stenosis using ultrasonic methods,” pp. 916–921, March 2012. [DOI] [PubMed] [Google Scholar]
- [48].Ota H et al. , “Quantitative vascular measurements in arterial occlusive disease,” Radiographics, vol. 25, no. 5, pp. 1141–1158, 2005. [DOI] [PubMed] [Google Scholar]


