

Abstract
Aims/Introduction
The relationship between pancreatic fatty infiltration and diabetes is widely known, whereas the causal relationship is not clear. Furthermore, it is uncertain whether pathogenesis of pancreatic fat is similar to that of liver fat. We aimed to clarify the contribution of this type of fat to glucose metabolism in type 2 diabetes patients by cross‐sectional and longitudinal analyses.
Material and Methods
A total of 56 patients with type 2 diabetes who had been hospitalized twice were analyzed. We evaluated the mean computed tomography values of the pancreas (P), liver (L) and spleen (S). Lower computed tomography values indicate a greater fat content. We defined indices of pancreatic or liver fat content as the differences between P or L and S. We assessed the associations among fat content for the two organs (P‐S, L‐S) and clinical parameters at the first hospitalization, and then analyzed the associations between these fat contents and changes in glycometabolic markers (the second data values minus the first).
Results
In the cross‐sectional study, P‐S negatively correlated with the increment of C‐peptide in the glucagon stimulation test (r = −0.71, P < 0.0001) and body mass index (r = −0.28, P = 0.034). L‐S negatively correlated with homeostasis model assessment of insulin resistance (r = −0.73, P < 0.0001), body mass index (r = −0.62, P < 0.0001) and some other obesity‐related indicators, but not with the increment of C‐peptide in the glucagon stimulation test. In the longitudinal study, P‐S positively correlated with the change of the increment of C‐peptide in the glucagon stimulation test (r = 0.49, P = 0.021).
Conclusions
In type 2 diabetes patients, pancreatic fat was less associated with obesity‐related indicators than liver fat, but was more strongly associated with the longitudinal decrease in endogenous insulin‐secreting capacity.
Keywords: Insulin secretion capacity, Pancreatic fat, Type 2 diabetes
In patients with type 2 diabetes, pancreatic fat was less associated with obesity‐related indicators than liver fat, but was more strongly associated with the longitudinal decrease in endogenous insulin‐secreting capacity.

Introduction
Pancreatic fatty infiltration is known to be associated with the state of diabetes: some studies have shown that patients with type 2 diabetes have more pancreatic fat than non‐diabetic patients1, 2, and others have shown that those who have more pancreatic fat are more likely to have diabetes3. In addition, it has been reported that pancreatic fat is associated with indices associated with insulin resistance, including body mass index (BMI)4, waist circumference4, visceral fat4 and the homeostasis model assessment of insulin resistance (HOMA‐IR)5 in several studies. However, the causal relationship between pancreatic fat and diabetes is uncertain, because most of these studies were designed as cross‐sectional studies. Furthermore, although we reported that pancreatic fat is strongly associated with glucose intolerance within 1 year after pancreatectomy in non‐diabetic patients6, it is not clear whether pancreatic fat affects the impairment of glucose tolerance in diabetes patients. Furthermore, liver fat has been reported to be a risk factor for the future development of type 2 diabetes7 and to be related to a future increase in insulin resistance8 in non‐diabetic patients. However, the relationship between pancreatic fat and liver fat has not been studied in detail. Wang et al.3 reported that individuals with a fatty pancreas are more likely to have a fatty liver than those without a fatty pancreas, whereas Hannukainen et al.9 reported that intraperitoneal fat was positively correlated with liver fat, but not with pancreatic fat. These results suggest that pancreatic fat has some different clinical implications from liver fat. In the present study, we aimed to clarify the difference between the characteristics of pancreatic fat and liver fat, and the contribution of these types of fat to glucose metabolism in type 2 diabetes patients using cross‐sectional and longitudinal analyses.
Methods
Patients
We carried out a search on the database of patients hospitalized in the Department of Metabolic Medicine, Osaka University Hospital between April 2008 and September 2018. We screened patients who had been diagnosed with diabetes, had received an abdominal computed tomography (CT) scan during a hospitalization and were hospitalized again within the period. We identified 130 patients who met these criteria. Among these, we excluded those who had been diagnosed with type 1 diabetes; endocrine diseases, such as Cushing syndrome, acromegaly, adrenal insufficiency, glucagonoma and Graves’ disease; pancreatic diseases, such as pancreatic tumors and pancreatitis; hepatic diseases, such as liver cirrhosis and hepatocyte carcinoma; renal failure (estimated glomerular filtration rate of <30 mL/min/1.73 m2), as well as those who were being treated with a glucocorticoid and those with myotonic dystrophy. Finally, a total of 56 patients were enrolled in our study as those with type 2 diabetes (Figure 1). Among these 56 patients, the medications for diabetes at the time of the first admission were as follows: insulin for 24 patients, sulfonylureas for 24 patients, biguanides for 20 patients, dipeptidyl peptidase‐4 inhibitors for 18 patients, α‐glucosidase inhibitors for 11 patients, thiazolidinedione for six patients and glinides for four patients. None of them had been treated with glucagon‐like peptide‐1 receptor agonists or sodium–glucose cotransporter 2 inhibitors.
Figure 1.
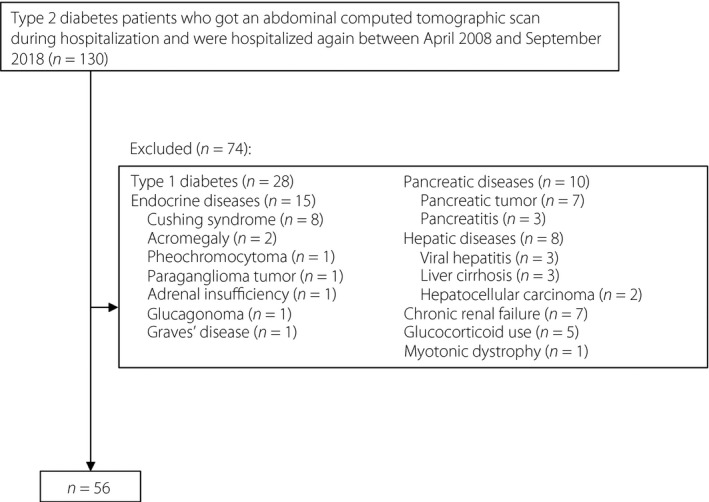
Flowchart for the recruitment of the patients.
Clinical parameters
For the cross‐sectional study, we obtained the following data at the time of the first hospitalization from medical records: age, sex, alcohol intake, smoking history, family history of diabetes, duration of diabetes, height, bodyweight, BMI, the previous highest BMI, waist circumference, the levels of hemoglobin A1c, fasting plasma glucose (FPG), fasting immunoreactive insulin (F‐IRI), fasting C‐peptide (F‐CPR), C‐peptide index (CPI), Insulinogenic index (II), homeostasis model assessment of β‐cell function (HOMA‐β), HOMA‐IR, Matsuda Index, the increment of C‐peptide in the glucagon stimulation test (⊿CPR), total cholesterol, triglycerides, high‐density lipoprotein cholesterol, low‐density lipoprotein cholesterol, aspartate transaminase, alanine transaminase and γ‐glutamyltranspeptidase. CPI was defined as F‐CPR (nmol/L) × 100 / FPG (mmol/L), HOMA‐β as F‐IRI (μIU/mL) × 20 / (FPG [mmol/L] − 3.5), and HOMA‐IR as FPG (mmol/L) × F‐IRI (μIU/mL) / 22.5. II10 and the Matsuda Index11 were defined as previously described, using data from 75‐g oral glucose tolerance tests. For the longitudinal study, we evaluated the changes in glycometabolic markers, such as hemoglobin A1c, FPG, F‐CPR, CPI, II, HOMA‐β, HOMA‐IR, Matsuda Index and ⊿CPR in between the first and the second hospitalizations (the second value minus the first).
Measurement of pancreatic and liver fat
In general, air, water and fat have unenhanced CT attenuation values of approximately −1,000, 0 and −100 Hounsfield units, respectively, and organs containing more fat have lower CT values. To evaluate the degree of pancreatic and liver fat, we used the unenhanced CT values, which have been proven to be well correlated with the fat content determined using a histological method12. We defined a pancreatic CT value (P) as the mean CT value of three regions of interest with areas of 1 cm2 in three different pancreatic parts: head, body and tail. We also defined a liver CT value (L) as the mean CT value of three regions of interest with areas of 1 cm2 in three different segments of liver: anterior, posterior and lateral. We defined a splenic CT value (S) as the mean of three regions of interest with areas of 1 cm2 in three different splenic levels: upper, middle and lower. Indices of pancreatic fat content were defined as the differences between the pancreatic and splenic CT values (P‐S), as previously shown12, 13, 14. Similarly, indices of liver fat content were defined as the differences between the liver and splenic CT values (L‐S)15, 16. We carefully excluded the pancreatic duct and margins from the measurement areas. The images were analyzed using the software program, Aquarius Net Viewer Version 4.4 (TeraRecon, Inc., Tokyo, Japan).
Statistical analysis
The data are presented as the medians and interquartile ranges. P‐values <0.05 were considered to be significant. The relationships among the parameters were assessed using Pearson's correlation coefficient analyses. Differences between groups in the P‐S and L‐S were tested using the Student's t‐test. The factors that contributed to P‐S and the longitudinal change in ⊿CPR evaluated in two hospitalizations were assessed using multiple regression analyses. All statistical analyses were carried out using JMP® Pro 14 software (SAS Institute Inc., Cary, NC, USA).
Study approval
The present study was approved by the institutional ethics review board of Osaka University Hospital, and carried out in accordance with the principles of the Helsinki Declaration. The study was announced to the public on the website of our department at Osaka University Hospital, and all patients were allowed to participate or refuse to participate in the study.
Results
Cross‐sectional study
The baseline clinical characteristics of the patients at the first hospitalization are shown in Table 1. The median value of BMI of 27.3 (kg/m2) indicated that the majority of the patients were obese. When fatty pancreas was defined as P‐S ≤–517 and fatty liver as L‐S ≤018, the incidences of fatty pancreas, fatty liver, both and neither were 47, 19, 15 and 5, respectively, out of the total of 56 patients. The analysis of the correlation between the indices of pancreatic and liver fat showed no significant correlation between them (Figure 2).
Table 1.
Anthropometric, clinical and computed tomography attenuation values of baseline
| Age (years) | 66 (15) |
| Sex (male/female) | 25/31 |
| Body mass index (kg/m2) | 27.3 (7.6) |
| Previous highest BMI, kg/m2 (n = 53) | 30.2 (6.9) |
| Waist circumference, cm (n = 44) | 96.5 (20.4) |
| Alcohol intake (g/day) | 0 (0) |
| Brinkman index | 0 (800) |
| Family history of diabetes (−/+) | 24/32 |
| Diabetes duration | 15 (15) |
| AST, U/L (n = 55) | 24 (23) |
| ALT, U/L (n = 55) | 24 (31) |
| γGTP (U/L) | 36 (43) |
| Total cholesterol (mmol/L) | 4.7 (1.4) |
| Triglyceride (mmol/L) | 1.5 (1.2) |
| HDL cholesterol (mmol/L) | 1.2 (0.4) |
| LDL cholesterol (mmol/L) | 2.9 (1.3) |
| Hemoglobin A1c (%) | 9.0 (1.8) |
| Fasting plasma glucose (mmol/L) | 7.8 (2.2) |
| Fasting immunoreactive insulin, μIU/mL (n = 29) | 6.4 (5.9) |
| Fasting C‐peptide (nmol/L) | 0.57 (0.50) |
| C‐peptide index (nmol/mmol) | 7.2 (5.3) |
| Insulinogenic index (pmol/mmol) | 12 (16) |
| HOMA‐β | 30 (25) |
| HOMA‐IR | 2.3 (2.6) |
| Matsuda Index | 3.7 (2.4) |
| ⊿CPR (nmol/L) | 0.45 (0.30) |
| Interval of hospitalizations (months) | 34 (36) |
| P (HU) | 35.1 (10.3) |
| L (HU) | 56.3 (17.2) |
| S (HU) | 47.5 (6.2) |
| P‐S (HU) | ‐11.1 (8.5) |
| P/S | 0.77 (0.19) |
| L‐S (HU) | 7.0 (18.5) |
| L/S | 1.1 (0.36) |
Total n = 56. Values are presented as the medians and interquartile ranges. ⊿CPR, increment of C‐peptide measured by glucagon test; γGTP, γ‐glutamyltranspeptidase; HDL, high‐density lipoprotein; HOMA‐β, homeostasis model assessment of β‐cell function; HOMA‐IR, homeostasis model assessment of insulin resistance; HU, Hounsfield units; L, computed tomography attenuation value of the liver; LDL, low‐density lipoprotein; P, computed tomography attenuation value of the pancreas; S, computed tomography attenuation value of the spleen.
Figure 2.

Correlation analysis for P‐S (an index of pancreatic fat content) and L‐S (an index of liver fat content). There was no significant correlation between them.
The results of the analyses of the correlations between the P‐S and baseline clinical parameters, and between L‐S and baseline clinical parameters are shown in Table 2. P‐S was negatively correlated with BMI, the previous highest BMI and ⊿CPR. In other words, those with the more pancreatic fat had the higher BMI, higher previous highest BMI and higher ⊿CPR. The distributions of P‐S and ⊿CPR are shown in Figure 3. The multiple regression analyses showed that ⊿CPR was independently associated with P‐S (Table 3).
Table 2.
Correlation analyses between clinical parameters and indices of fat content of the pancreas and liver in the cross‐sectional study
| P‐S | L‐S | |||
|---|---|---|---|---|
| r | P‐value | r | P‐value | |
| Age | 0.063 | 0.64 | 0.62 | <0.0001 |
| Body mass index | −0.28 | 0.034 | −0.62 | <0.0001 |
| Previous highest body mass index (n = 53) | −0.32 | 0.018 | −0.56 | <0.0001 |
| Waist circumference (n = 44) | −0.14 | 0.38 | −0.58 | <0.0001 |
| Alcohol intake | −0.044 | 0.75 | −0.096 | 0.48 |
| Brinkman index (n = 55) | −0.090 | 0.51 | 0.020 | 0.88 |
| Diabetes duration | −0.019 | 0.89 | 0.53 | <0.0001 |
| AST (n = 55) | −0.13 | 0.34 | −0.66 | <0.0001 |
| ALT (n = 55) | −0.12 | 0.37 | −0.65 | <0.0001 |
| γGTP | 0.055 | 0.69 | −0.22 | 0.10 |
| Total cholesterol | −0.089 | 0.52 | −0.19 | 0.16 |
| Triglyceride | 0.0046 | 0.97 | −0.38 | 0.0043 |
| HDL cholesterol | −0.021 | 0.88 | 0.28 | 0.036 |
| LDL cholesterol | −0.083 | 0.54 | −0.22 | 0.11 |
| Hemoglobin A1c | 0.048 | 0.73 | −0.13 | 0.34 |
| Fasting plasma glucose | −0.080 | 0.56 | −0.20 | 0.14 |
| Fasting immunoreactive insulin (n = 29) | 0.039 | 0.84 | −0.73 | <0.0001 |
| Fasting C‐peptide (n = 54) | −0.056 | 0.68 | −0.61 | <0.0001 |
| C‐peptide index (n = 54) | −0.033 | 0.81 | −0.52 | <0.0001 |
| Insulinogenic index (n = 13) | 0.12 | 0.69 | −0.29 | 0.33 |
| HOMA‐β (n = 29) | 0.10 | 0.59 | −0.46 | 0.013 |
| HOMA‐IR (n = 29) | 0.044 | 0.82 | −0.73 | <0.0001 |
| Matsuda index (n = 11) | 0.080 | 0.81 | 0.39 | 0.23 |
| ⊿CPR (n = 24) | −0.71 | <0.0001 | −0.28 | 0.19 |
Total n = 56. ⊿CPR, increment of C‐peptide measured by glucagon test; γGTP, γ‐glutamyltranspeptidase; ALT, alanine transaminase; AST, aspartate transaminase; HDL, high‐density lipoprotein; HOMA‐β, homeostasis model assessment of β‐cell function; HOMA‐IR, homeostasis model assessment of insulin resistance; L, computed tomography attenuation value of the liver; LDL, low‐density lipoprotein; P, computed tomography attenuation value of the pancreas; r, Pearson's correlation coefficient; S, computed tomography attenuation value of the spleen.
Figure 3.
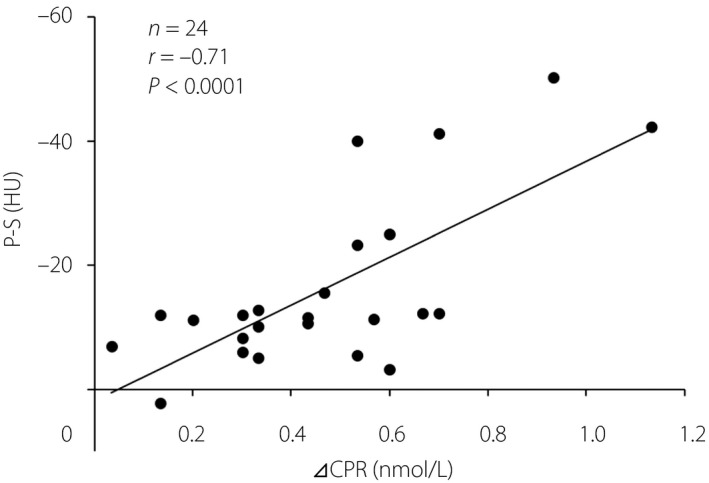
Correlation analysis of ⊿CPR (increment of C‐peptide in the glucagon stimulation test) and P‐S (an index of pancreatic fat content). The result indicated that individuals with a greater capacity for insulin secretion tended to have more severe fatty infiltration of the pancreas.
Table 3.
Multiple regression analyses for indices of fat content of the pancreas and spleen
| Coefficient | Standard error | Standardized coefficient | t‐value | P‐value | |
|---|---|---|---|---|---|
| Model 1 | |||||
| Body mass index (kg/m2) | −0.339 | 0.356 | −0.166 | −0.95 | 0.3518 |
| ⊿CPR (nmol/L) | −34.07 | 9.441 | −0.628 | −3.61 | 0.0016 |
| Model 2 | |||||
| The previous highest body mass index (kg/m2) | −0.283 | 0.372 | −0.130 | −0.76 | 0.4548 |
| ⊿CPR (nmol/L) | −35.37 | 9.250 | −0.652 | −3.82 | 0.0010 |
⊿CPR, increment of C‐peptide measured by glucagon test.
In contrast, L‐S was positively correlated with age, diabetes duration and high‐density lipoprotein cholesterol, and negatively correlated with BMI, the previous highest BMI, waist circumference, aspartate transaminase, alanine transaminase and triglycerides. In other words, those with the more liver fat were younger, had shorter durations of their diabetes, larger waist circumferences and higher BMIs, as well as higher previous highest BMI, and higher levels of aspartate transaminase, alanine transaminase and triglycerides. L‐S was also negatively correlated with F‐CPR, CPI, HOMA‐β and HOMA‐IR. There were no significant differences in the P‐S and L‐S values between groups divided by sex (male or female) or family history of diabetes (presence or absence).
Longitudinal study
The results of the correlation analyses between pancreatic fat or liver fat and changes in the glycometabolic markers are shown in Table 4. P‐S, evaluated at the first hospitalization, was positively correlated with the change in ⊿CPR (⊿[⊿CPR]): more pancreatic fat was associated with a greater subsequent decrease in ⊿CPR. Figure 4 shows the distributions of P‐S and ⊿(⊿CPR). In contrast, L‐S was positively associated with a change of F‐CPR, but not CPI; that is, more liver fat was associated with a greater degree of subsequent decline of F‐CPR, but not the CPI. The multiple regression analyses for factors that had previously been proven to be associated with the pancreatic fat content13 (age, sex, BMI, L‐S and alcohol intake) showed that only P‐S was independently associated with ⊿(⊿CPR; Table 5).
Table 4.
Correlation analyses between change of parameters related to glycometabolism and indices of fat content of pancreas and liver in the longitudinal study
| P‐S | L‐S | |||
|---|---|---|---|---|
| r | P value | r | P value | |
| ⊿(Hemoglobin A1c) (n = 55) | −0.069 | 0.61 | 0.22 | 0.10 |
| ⊿(Fasting plasma glucose) | 0.097 | 0.48 | 0.22 | 0.11 |
| ⊿(Fasting immunoreactive insulin) (n = 18) | 0.38 | 0.12 | 0.52 | 0.026 |
| ⊿(Fasting C‐peptide) (n = 52) | 0.052 | 0.72 | 0.34 | 0.013 |
| ⊿(C‐peptide index) (n = 52) | −0.050 | 0.72 | 0.094 | 0.51 |
| ⊿(HOMA‐β) (n = 18) | −0.17 | 0.51 | 0.28 | 0.26 |
| ⊿(HOMA‐IR) (n = 18) | 0.35 | 0.16 | 0.000072 | 0.9998 |
| ⊿(⊿CPR) (n = 22) | 0.49 | 0.021 | 0.11 | 0.64 |
Total n = 56. ⊿CPR, increment of C‐peptide measured by glucagon test; HOMA‐β, homeostasis model assessment of β‐cell function; HOMA‐IR, homeostasis model assessment of insulin resistance; L, computed tomography attenuation value of the liver; P, computed tomography attenuation value of the pancreas; r, Pearson's correlation coefficient; S, computed tomography attenuation value of the spleen.
Figure 4.
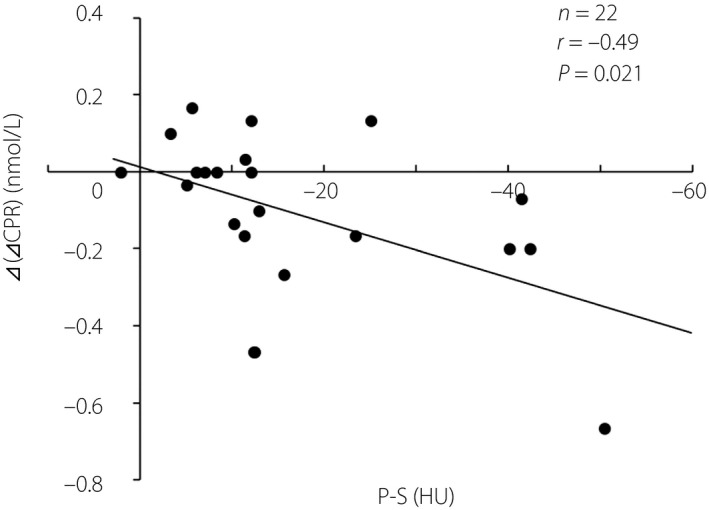
Correlation analysis of P‐S (an index of pancreatic fat content) and ⊿(⊿CPR) (the change in ⊿CPR evaluated in two hospitalizations). The result indicates more severe fatty infiltration of the pancreas is likely to lead to a greater subsequent decrease in ⊿CPR.
Table 5.
Multiple regression analyses for change in the increment of C‐peptide in the glucagon stimulation test
| Coefficient | Standard error | Standardized coefficient | t‐value | P‐value | |
|---|---|---|---|---|---|
| Model 1 | |||||
| P‐S (HU) | 0.007 | 0.003 | 0.485 | 2.33 | 0.0311 |
| Age (years) | 0.000 | 0.005 | 0.015 | 0.07 | 0.9424 |
| Model 2 | |||||
| P‐S (HU) | 0.007 | 0.003 | 0.492 | 2.39 | 0.0274 |
| Sex (female) | −0.003 | 0.043 | −0.012 | −0.06 | 0.9542 |
| Model 3 | |||||
| P‐S (HU) | 0.008 | 0.003 | 0.533 | 2.32 | 0.0317 |
| Body mass index (kg/m2) | 0.003 | 0.007 | 0.088 | 0.38 | 0.7067 |
| Model 4 | |||||
| P‐S (HU) | 0.008 | 0.003 | 0.532 | 2.45 | 0.0241 |
| L‐S (HU) | −0.003 | 0.006 | −0.107 | −0.49 | 0.6267 |
| Model 5 | |||||
| P‐S (HU) | 0.007 | 0.003 | 0.485 | 2.41 | 0.0263 |
| Alcohol intake (g/day) | 0.001 | 0.003 | 0.036 | 0.18 | 0.8593 |
Total n = 22. HU, Hounsfield units; L, computed tomography attenuation value of the liver; P, computed tomography attenuation value of the pancreas; r, Pearson's correlation coefficient; S, computed tomography attenuation value of the spleen.
Discussion
In the present study, we showed that pancreatic fat in type 2 diabetes patients was less associated with obesity‐related parameters than liver fat in cross‐sectional analyses. In addition, we showed that pancreatic fat had a possible longitudinal effect on the impairment of β‐cell function.
Although there have been many cross‐sectional studies on pancreatic fatty infiltration and β‐cell function, they have not determined whether pancreatic fat impairs β‐cell function. Some authors concluded that pancreatic fat determined using magnetic resonance4 or CT values19 was associated with impairment of β‐cell function evaluated using the 75‐g oral glucose tolerance test in non‐diabetic individuals1, those with impaired fasting glucose and/or impaired glucose tolerance4, or those with various stages of glucose tolerance including type 2 diabetes 19. Others concluded that pancreatic fat evaluated using magnetic resonance techniques was not associated with impairment of β‐cell function evaluated using the 75‐g oral glucose tolerance test20, 21 and intravenous glucose tolerance test22 in individuals with normal glucose tolerance20, non‐diabetic individuals21 or those with various stages of glucose tolerance including type 2 diabetes22. These inconsistent results might be derived from the difference in glucose tolerance of participants or from the difference in markers of β‐cell function. To the best of our knowledge, only one longitudinal study on pancreatic fat and type 2 diabetes has been published. That study described 5‐year follow up of 813 non‐diabetic individuals, and showed a positive association between pancreatic fat evaluated as the CT values and increased incidence of type 2 diabetes in a univariate analysis. However, this association did not remain significant in a multivariate analysis as a result of confounders, such as age, sex, BMI, L‐S and alcohol intake13. In the present study, multivariate analyses that were adjusted for these factors showed that P‐S was an independent factor for ⊿(⊿CPR). The present study differs from the previous study, as type 2 diabetes patients in whom changes in glycometabolic markers rather than the onset of diabetes were evaluated. The mechanisms by which pancreatic fatty infiltration affects β‐cell function have not yet been clarified, but some mechanisms are assumed to be associated with lipotoxicity23, inflammation of islets24 or remodeling of pancreatic innervation25. On the basis that ⊿CPR is closely correlated with relative β‐cell area26, pancreatic fatty infiltration might lead to a longitudinal reduction of β‐cell mass. In contrast, L‐S correlated with a change of F‐IRI and F‐CPR, not with CPI. Considering that all these indicators also could be affected by insulin resistance, the relationship between liver fat and the longitudinal change of these indicators has little significance in evaluating the change of insulin‐secreting capacity.
We also showed for the first time that ⊿CPR was negatively correlated with P‐S in the cross‐sectional analysis, which suggested that patients with higher insulin secretion capacity had more pancreatic fat. This result might seem paradoxical, because the present longitudinal study showed that pancreatic fat was associated with the impairment of β‐cell function, as previously mentioned. This cross‐sectional result could be explained by a hypothesis that insulin secretion might contribute to the local fatty change within the pancreas. This hypothesis is supported by the result of a multivariate analysis adjusted for BMI, another parameter that was correlated with P‐S, which showed that ⊿CPR was an independent factor for P‐S. Similarly, insulin‐secreting parameters, including F‐IRI, F‐CPR, CPI and HOMA‐β, were negatively correlated with L‐S in the cross‐sectional analysis. Considering that these insulin‐secreting parameters were correlated with HOMA‐IR (data not shown), which was also correlated with L‐S, they were correlated with L‐S indirectly through their association with insulin resistance.
We showed that the correlation coefficient between BMI and pancreatic fat was lower than that between BMI and liver fat, and that some other obesity‐related indicators were correlated only with liver fat. This result might be explained by the weaker association of obesity or visceral fat with pancreatic fat than with liver fat. Many studies have reported that pancreatic fat and liver fat are related to each other27, 28. However, only a few studies have focused on the differences between these forms of fat. In the present study, no significant correlation was found between pancreatic fat and liver fat, which might be due to possible differences in the pathogeneses of these two types of fat. Histologically, it has been shown that pancreatic fat is located mainly in adipocytes, whereas liver fat is located within hepatocytes29, 30. The liver is an organ that takes up, oxidizes, synthesizes and exports fatty acids31. In contrast, the pancreas does not have those functions. Furthermore, considering that ⊿CPR was an independent factor for pancreatic fat, but not liver fat, pancreatic fat might be partly affected by local insulin secretion. These functional or environmental differences might contribute to the pathophysiological differences between these two forms of fat.
There were some limitations to this study. The first is the small sample size of the study. The second is that we could not evaluate the effect of the diabetes medications administered to these patients on the glycometabolic parameters in either the cross‐sectional or the longitudinal analyses.
In conclusion, pancreatic fat was less associated with obesity‐related markers than liver fat in cross‐sectional analyses, but pancreatic fat was more strongly associated with the longitudinal decrease in endogenous insulin secretion capacity in type 2 diabetes patients.
Disclosure
The authors declare no conflict of interest.
J Diabetes Investig 2020; 11: 80–87
References
- 1. Tushuizen ME, Bunck MC, Pouwels PJ, et al Pancreatic fat content and β‐cell function in men with and without type 2 diabetes. Diabetes Care 2007; 30: 2916–2921. [DOI] [PubMed] [Google Scholar]
- 2. Steven S, Hollingsworth KG, Small PK, et al Weight loss decreases excess pancreatic triacylglycerol specifically in type 2 diabetes. Diabetes Care 2016; 39: 158–165. [DOI] [PubMed] [Google Scholar]
- 3. Wang CY, Ou HY, Chen MF, et al Enigmatic ectopic fat: prevalence of nonalcoholic fatty pancreas disease and its associated factors in a Chinese population. J Am Heart Assoc 2014; 3: e000297. [DOI] [PMC free article] [PubMed] [Google Scholar]
- 4. Heni M, Machann J, Staiger H, et al Pancreatic fat is negatively associated with insulin secretion in individuals with impaired fasting glucose and/or impaired glucose tolerance: a nuclear magnetic resonance study. Diabetes Metab Res Rev 2010; 26: 200–205. [DOI] [PubMed] [Google Scholar]
- 5. Wong VWS, Wong GLH, Yeung DKW, et al Fatty pancreas, insulin resistance, and β‐cell function: a population study using fat‐water magnetic resonance imaging. Am J Gastroenterol 2014; 109: 589–597. [DOI] [PubMed] [Google Scholar]
- 6. Ishibashi C, Kozawa J, Fujita Y, et al Glucose intolerance after pancreatectomy was associated with preoperative hemoglobin A1c, insulin resistance, and histological pancreatic fatty infiltration. Pancreas 2018; 47: e48–e50. [DOI] [PMC free article] [PubMed] [Google Scholar]
- 7. Park SK, Seo MH, Shin HC, et al Clinical availability of nonalcoholic fatty liver disease as an early predictor of type 2 diabetes mellitus in korean men: 5‐year prospective cohort study. Hepatology 2013; 57: 1378–1383. [DOI] [PubMed] [Google Scholar]
- 8. Kim G, Giannini C, Pierpont B, et al Longitudinal effects of MRI‐measured hepatic steatosis on biomarkers of glucose homeostasis and hepatic apoptosis in obese youth. Diabetes Care 2013; 36: 130–136. [DOI] [PMC free article] [PubMed] [Google Scholar]
- 9. Hannukainen JC, Borra R, Linderborg K, et al Liver and pancreatic fat content and metabolism in healthy monozygotic twins with discordant physical activity. J Hepatol 2011; 54: 545–552. [DOI] [PubMed] [Google Scholar]
- 10. Kosaka K, Hagura R, Kuzuya T. Insulin resposes in equivocal and definite diabetes, with special reference to subjects who had mild glucose intolerance but later developed definite diabetes. Diabetes 1977; 26: 944–952. [DOI] [PubMed] [Google Scholar]
- 11. DeFronzo RA, Matsuda M. Reduced time points to calculate the composite index. Diabetes Care 2010; 33: e93. [DOI] [PubMed] [Google Scholar]
- 12. Kim SY, Kim H, Cho JY, et al Quantitative assessment of pancreatic fat by using unenhanced CT: pathologic correlation and clinical implications. Radiology 2014; 271: 104–112. [DOI] [PubMed] [Google Scholar]
- 13. Yamazaki H, Tsuboya T, Katanuma A, et al Lack of independent association between fatty pancreas and incidence of type 2 diabetes: 5‐Year Japanese cohort study. Diabetes Care 2016; 39: 1677–1683. [DOI] [PubMed] [Google Scholar]
- 14. Hori M, Onaya H, Hiraoka N, et al Evaluation of the degree of pancreatic fatty infiltration by area‐based assessment of CT images: comparison with histopathology‐based and CT attenuation index‐based assessments. Jpn J Radiol 2016; 34: 667–676. [DOI] [PubMed] [Google Scholar]
- 15. Limanond P, Raman SS, Lassman C, et al Macrovesicular hepatic steatosis in living related liver donors: correlation between CT and histologic findings. Radiology 2004; 230: 276–280. [DOI] [PubMed] [Google Scholar]
- 16. Lee SW, Park SH, Kim KW, et al Unenhanced CT for assessment of macrovesicular hepatic steatosis in living liver donors: comparison of visual grading with liver attenuation index. Radiology 2007; 244: 479–485. [DOI] [PubMed] [Google Scholar]
- 17. Lee JS, Kim SH, Jun DW, et al Clinical implications of fatty pancreas: correlations between fatty pancreas and metabolic syndrome. World J Gastroenterol 2009; 15: 1869–1875. [DOI] [PMC free article] [PubMed] [Google Scholar]
- 18. Jehangir M, Nazir R, Jang A, et al Macrovesicular steatosis in living related liver donors: correlation of biopsy findings with CT liver attenuation index and body mass index. Clin Transplant 2016; 30: 1016–1020. [DOI] [PubMed] [Google Scholar]
- 19. Yokota K, Fukushima M, Takahashi Y, et al Insulin secretion and computed tomography values of the pancreas in the early stage of the development of diabetes. J Diabetes Investig 2012; 3: 371–376. [DOI] [PMC free article] [PubMed] [Google Scholar]
- 20. Komada H, Sakaguchi K, Hirota Y, et al Pancreatic fat content assessed by1H magnetic resonance spectroscopy is correlated with insulin resistance, but not with insulin secretion, in Japanese individuals with normal glucose tolerance. J Diabetes Investig 2018; 9: 505–511. [DOI] [PMC free article] [PubMed] [Google Scholar]
- 21. Begovatz P, Koliaki C, Weber K, et al Pancreatic adipose tissue infiltration, parenchymal steatosis and beta cell function in humans. Diabetologia 2015; 58: 1646–1655. [DOI] [PubMed] [Google Scholar]
- 22. Lê KA, Ventura EE, Fisher JQ, et al Ethnic differences in pancreatic fat accumulation and its relationship with other fat depots and inflammatory markers. Diabetes Care 2011; 34: 485–490. [DOI] [PMC free article] [PubMed] [Google Scholar]
- 23. Pinnick K, Neville M, Clark A, et al Reversibility of metabolic and morphological changes associated with chronic exposure of pancreatic islet beta‐cells to fatty acids. J Cell Biochem 2010; 109: 683–692. [DOI] [PubMed] [Google Scholar]
- 24. Donath MY, Shoelson SE. Type 2 diabetes as an inflammatory disease. Nat Rev Immunol 2011; 11: 98–107. [DOI] [PubMed] [Google Scholar]
- 25. Tang SC, Baeyens L, Shen CN, et al Human pancreatic neuro‐insular network in health and fatty infiltration. Diabetologia 2018; 61: 168–181. [DOI] [PubMed] [Google Scholar]
- 26. Fujita Y, Kozawa J, Iwahashi H, et al Increment of serum C‐peptide measured by glucagon test closely correlates with human relative beta‐cell area. Endocr J 2015; 62: 329–337. [DOI] [PubMed] [Google Scholar]
- 27. Khoury T, Asombang AW, Berzin TM, et al The clinical implications of fatty pancreas: a concise review. Dig Dis Sci 2017; 62: 2658–2667. [DOI] [PubMed] [Google Scholar]
- 28. Guglielmi V, Sbraccia P. Type 2 diabetes: does pancreatic fat really matter? Diabetes Metab Res Rev 2018; 34: e2955. [DOI] [PubMed] [Google Scholar]
- 29. Smits MM, Van Geenen EJM. The clinical significance of pancreatic steatosis. Nat Rev Gastroenterol Hepatol 2011; 8: 169–177. [DOI] [PubMed] [Google Scholar]
- 30. Murakami R, Saisho Y, Watanabe Y, et al Pancreas fat and β cell mass in humans with and without diabetes: an analysis in the Japanese population. J Clin Endocrinol Metab 2017; 102: 3251–3260. [DOI] [PubMed] [Google Scholar]
- 31. Fabbrini E, Sullivan S, Klein S. Obesity and nonalcoholic fatty liver disease: biochemical, metabolic, and clinical implications. Hepatology 2010; 51: 679–689. [DOI] [PMC free article] [PubMed] [Google Scholar]