Abstract
18F-clofarabine, a nucleotide purine analog, is a substrate for deoxycytidine kinase (dCK), a key enzyme in the deoxyribonucleoside salvage pathway. 18F-clofarabine might be used to measure dCK expression and thus serve as a predictive biomarker for tumor responses to dCK-dependent prodrugs or small-molecule dCK inhibitors, respectively. As a prerequisite for clinical translation, we determined the human whole-body and organ dosimetry of 18F-clofarabine. Methods: Five healthy volunteers were injected intravenously with 232.4 ± 1.5 MBq of 18F-clofarabine. Immediately after tracer injection, a dynamic scan of the entire chest was acquired for 30 min. This was followed by 3 static whole-body scans at 45, 90, and 135 min after tracer injection. Regions of interest were drawn around multiple organs on the CT scan and copied to the PET scans. Organ activity was determined and absorbed dose was estimated with OLINDA/EXM software. Results: The urinary bladder (critical organ), liver, kidney, and spleen exhibited the highest uptake. For an activity of 250 MBq, the absorbed doses in the bladder, liver, kidney, and spleen were 58.5, 6.6, 6.3, and 4.3 mGy, respectively. The average effective dose coefficient was 5.1 mSv. Conclusion: Our results hint that 18F-clofarabine can be used safely in humans to measure tissue dCK expression. Future studies will determine whether 18F-clofarabine may serve as a predictive biomarker for responses to dCK-dependent prodrugs or small-molecule dCK inhibitors.
Keywords: PET, dosimetry, clofarabine
Clofarabine, a deoxyadenosine purine analog, is approved by the U.S. Food and Drug Administration for treatment of acute lymphoblastic leukemia, has shown promising results in acute myeloid leukemia and juvenile myelomonocytic leukemia, and is being tested for its efficacy in solid tumors (1).
Clofarabine is transported into cells primarily via human concentrated nucleoside transporters; however, human equilibrative nucleoside transporters play a role as well (1,2). On entry into the cell, clofarabine is phosphorylated by deoxycytidine kinase (dCK), monophosphate kinase, and diphosphate kinase into its active triphosphate form (1). Clofarabine triphosphate acts as a powerful anticancer agent by inhibiting DNA synthesis, inhibiting ribonucleotide reductase, and directly inducing apoptosis. Clofarabine triphosphate competes with deoxyadenosine triphosphate for the DNA polymerase (α, ε) binding sites, thus inhibiting DNA elongation and replication (1,3). Moreover, clofarabine triphosphate binds to the allosteric site on the regulatory subunit of ribonucleotide reductase, resulting in deoxyribonucleotide triphosphate pool depletion. This further increases the incorporation of clofarabine triphosphate into DNA, potentiating its inhibitory effects on DNA synthesis (1,3). Finally, clofarabine triphosphate directly induces programmed cell death by causing the release of numerous apoptotic compounds (1). The pharmacologic effects and activation of clofarabine are predominantly dependent on dCK phosphorylation.
dCK is a key enzyme in the deoxyribonucleoside salvage pathway. It phosphorylates free nucleosides such as deoxycytidine, deoxyadenosine, and deoxyguanosine, which are subsequently used for DNA synthesis. The biologic role of dCK has not been entirely elucidated. However, dCK is required for normal hematopoiesis (4) and DNA damage response (5). Moreover, dCK provides an escape mechanism when DNA de novo synthesis is inhibited by ribonucleotide reductase inhibitors (6). This resistance can be overcome using small-molecule inhibitors of dCK (6–9). dCK is also required to phosphorylate and activate inactive prodrugs such as cytarabine, gemcitabine, decitabine, and cladribine (10). Therefore, a PET probe that specifically measures tissue dCK expression could serve as a predictive biomarker for tumor responses to dCK-dependent prodrugs, stratify patients into likely responders to small-molecule dCK inhibitors, and demonstrate target engagement in patients treated with dCK inhibitors (6).
Before these applications can be tested systematically, as with any new radiopharmaceutical, the whole-body distribution and radiation dosimetry must be quantified.
MATERIALS AND METHODS
18F-Clofarabine Synthesis
The synthesis of 18F-clofarabine was performed as previously described (10,11). In brief, protection groups were first added to chloroadenosine. Subsequently, the hydroxyl group of this product (the trityl-protected chloroadenosine derivative) was replaced with triflyl chloride. Finally, the triflyl chloride was substituted with 18F-flourine to yield the final product, 18F-clofarabine.
Human Subjects
The study protocol was approved by the Institutional Review Board for Human Subjects and the Medical Radiation Safety Committee at the University of California, Los Angeles, and the Radioactive Drug Research Committee of the U.S. Food and Drug Administration. All human subjects provided written informed consent after receiving a thorough explanation of the study by a qualified physician.
PET Image Acquisition
All 18F-clofarabine scans were performed on a dedicated PET/CT scanner (Biograph mCT 64; Siemens Medical Solutions). Low-dose CT scans for attenuation correction were acquired (130 kV, 0.5-s tube rotation, 4-mm slice collimation, and a bed speed of 8 mm/s). The CT images were reconstructed using filtered backprojection at 3.4-mm axial intervals to match the slice separation of the PET data. The administered activity for the radiopharmaceutical was determined from previous dosimetry studies on mice. On the basis of these data and assuming a worst-case scenario (quantifying the highest absorbed organ dose and extrapolating to the whole body), a safe injection to remain under 50 mSv was calculated to be 259 MBq. In consideration of a 10% safety margin, we injected 233 MBq of 18F-clofarabine. The imaging protocol consisted of a single low-dose CT scan for attenuation correction and 4 emission scans. The first scan was a dynamic scan of the heart and chest for 30 min taken immediately after intravenous tracer injection. The remaining 3 scans were whole-body static scans (top of the skull to the feet) taken approximately 45, 90, and 135 min after intravenous tracer administration. Static images were acquired for 3 min per bed position. The number of bed positions varied from 11 to 12, depending on the height of the volunteer.
PET Image Reconstruction
PET images were reconstructed with an iterative algorithm (ordered-subset expectation maximization; 2 iterations, 8 subsets). All PET images were reconstructed using corrections for attenuation, dead-time, random events, and scatter. The PET scanner is periodically checked for calibration accuracy as part of quality control according to published guidelines (12).
Dosimetry
The region of interest was first defined on the CT scan and copied over to the first static PET scan. This segmentation was performed for all well-defined organs by applying a 50% isocontour volume of interest for the organ (liver, gallbladder, kidneys, spleen, heart, L2–L4, lung, and whole body) using E.SOFT software VA60C (Siemens Medical Solutions). For the bladder, a 25% isocontour was used. These volumes were then copied to subsequent PET scans, and activity concentrations were determined. All organ volumes except for the bladder were assumed to be constant over time. The actual volume of the bladder was quantified on every PET scan. From the coregistered PET images, average organ activity per volume in kBq/mL was obtained for each scan. The total activity in the respective volume of interest was calculated subsequently by multiplying the average organ activity per volume by the respective volume taken from the CT images. Bone marrow dosimetry was derived from CT-based volumes of interest placed over L2–L4.
Because there were only 3 time points, the time–activity curves were integrated using trapezoidals, assuming physical decay after the last data point. The calculation for the remainder of the body was estimated by subtracting the activity in the organs from the total body. The calculation of the time-integrated activity coefficient for the bone marrow was performed using the image-based method described by Herrmann et al. (13): the time-integrated activities ÃL2–L4 of L2–L4 for assessing activity in the red bone marrow are derived assuming that 6.7% of the total bone marrow is contained in L2–L4.
The time-integrated activity coefficients were used for calculating absorbed dose coefficients and effective dose coefficients for the standard 74-kg adult male model using OLINDA/EXM software (14) for each patient separately. The values for the effective dose coefficients are based on the tissue-weighting factors from International Commission on Radiological Protection publication 60 (15). SDs were calculated using Excel (Microsoft).
Biodistribution
The activity concentration was corrected to the time of injection so that the SUV could be calculated. SUV is defined by the following equation:
The density was assumed to be 1 g/mL, and SUV therefore becomes a dimensionless value. The biodistribution was visualized by creating maximum-intensity projections. For a more detailed discussion of SUV, the reader is referred to the appendix of a previously published article (16).
Statistical Analysis
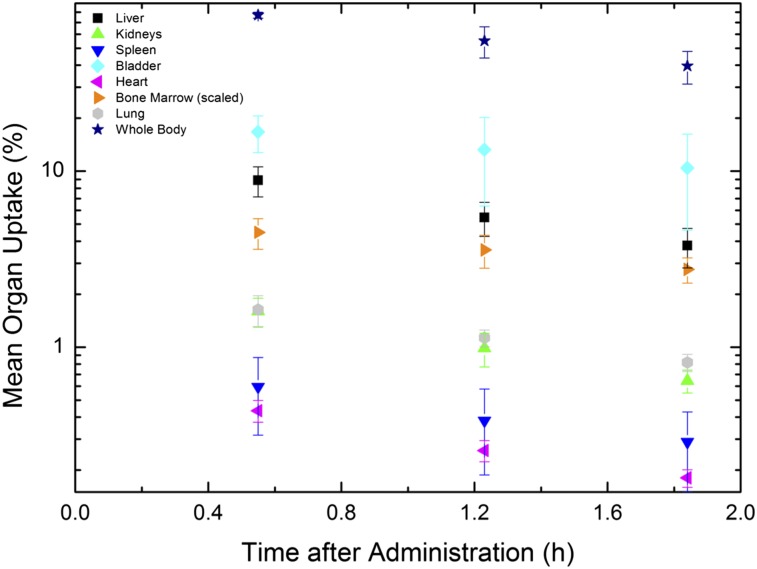
Organ uptake for the 3 time points was calculated for every subject as described above. The average of these values and the SD were calculated using Excel (Microsoft). The mean organ uptake was plotted versus time (Fig. 1).
FIGURE 1.
Mean organ activities as function of time in hours. Values for bone marrow were scaled by 0.067 (mass ratio of LV2–LV4 to total bone marrow mass). For improved visualization, values of gallbladder are suppressed.
RESULTS
Demographic Data
Five healthy volunteers (3 men, 2 women) with a median age of 58 y (range, 57–67 y) were enrolled. The median weight was 69.0 kg (mean, 72.4 kg; range, 63.5–90.7 kg). The mean administered activity was 232.4 ± 1.5 MBq of 18F-clofarabine. There were no adverse or clinically detectable pharmacologic effects in any of the 5 subjects. No significant changes in vital signs or the results of electrocardiograms were observed.
Image Analysis
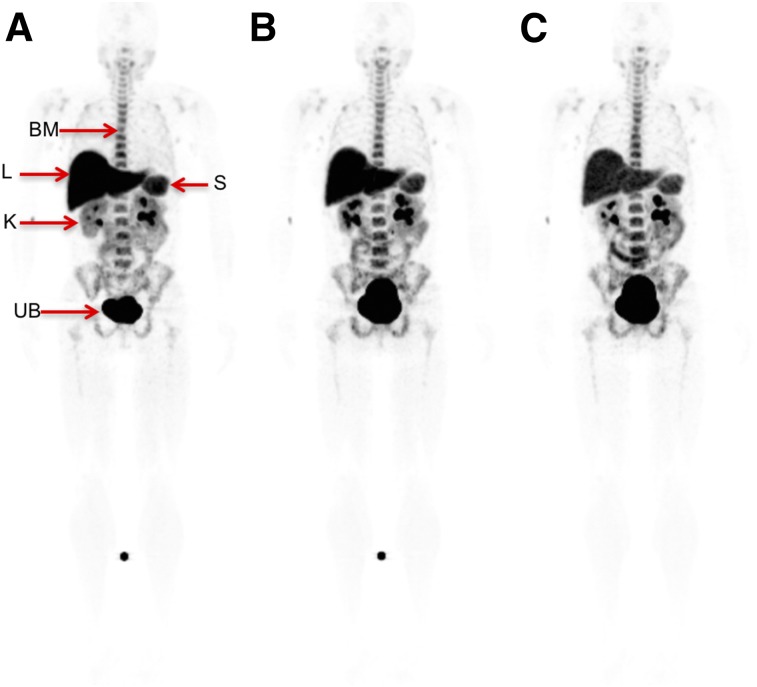
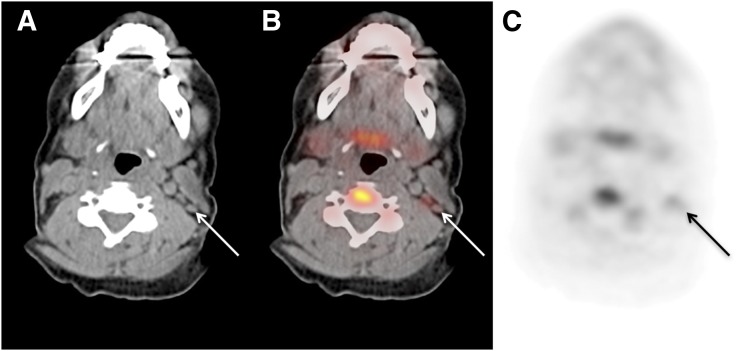
The maximum-intensity projections and whole-body biodistribution for 18F-clofarabine for various time points are shown in Figure 2. There was high uptake in the bladder, liver, kidneys, and spleen. Additionally, there was moderate uptake in the bone marrow and throughout the bowel. Mild uptake was also noted in the salivary glands and some lymph nodes, which are better visualized in Figure 3. Variable and heterogeneous uptake was noted in the pancreas.
FIGURE 2.
Whole-body biodistribution of 18F-clofarabine at 45 min (A), 90 min (B), and 135 min (C). Visible organs are indicated by arrows. BM = bone marrow; K = kidneys; L = liver; S = spleen; UB = urinary bladder. (SUV scale, 0–6.5.)
FIGURE 3.
Selected axial slices of volunteer’s PET/CT study: CT image (A), fused image (B), and PET image (C). Arrows indicate presence of level IIB lymph nodes in left side of neck with mild 18F-clofarabine uptake. (SUVmax, 2.0; SUV scale, 0–5.)
Dosimetry
The average time-integrated activity coefficients for a variety of organs are given in Table 1. The highest values were in the bladder (0.49 h) and liver (0.20 h). These values (Table 1) were used as an input for the OLINDA/EXM program to calculate the absorbed dose for numerous organs (Table 2). Patients were allowed to void between acquisitions, and the activity in the excreted urine was neglected, resulting in lower time-integrated activity coefficients than expected. From these data, the organ with the highest dose coefficient was the bladder, 2.34E−01 mGy/MBq (critical organ). The second and third highest were the liver (2.62E−02 mGy/MBq) and kidneys (2.51E−02 mGy/MBq), respectively (Table 3).
TABLE 1.
Time-Integrated Activity Coefficients
| Organ | Coefficient (h) |
| Liver | 0.200 ± 0.039 |
| Gallbladder | 0.001 ± 0.001 |
| Kidneys | 0.035 ± 0.004 |
| Spleen | 0.015 ± 0.007 |
| Bladder | 0.491 ± 0.226 |
| Heart | 0.010 ± 0.001 |
| Bone marrow | 0.132 ± 0.024 |
| Lung | 0.041 ± 0.006 |
| Remainder | 0.448 ± 0.190 |
Data are mean ± SD in 5 patients.
TABLE 2.
Mean Absorbed Dose Coefficient
| Organ | Coefficient (mGy/MBq) |
| Adrenals | 6.6E−03 ± 1.1E−03 |
| Brain | 2.3E−03 ± 8.6E−04 |
| Breasts | 2.8E−03 ± 0.8E−3 |
| Gallbladder wall | 9.2E−03 ± 1.8E−03 |
| Lower large intestine wall | 1.0E−02 ± 0.35E−02 |
| Small intestine | 6.6E−03 ± 1.8E−03 |
| Stomach wall | 4.4E−03 ± 0.9E−03 |
| Upper large intestine wall | 6.1E−03 ± 1.56E−03 |
| Heart wall | 6.9E−03 ± 0.9E−03 |
| Kidneys | 2.5E−02 ± 0.2E−02 |
| Liver | 2.6E−02 ± 0.5E−02 |
| Lungs | 9.4E−03 ± 0.4E−04 |
| Muscle | 4.8E−03 ± 1.39E−03 |
| Ovaries | 9.8E−03 ± 3.3E−03 |
| Pancreas | 6.2E−03 ± 1.0E−03 |
| Red marrow | 1.3E−02 ± 2.4E−03 |
| Osteogenic cells | 9.8E−03 ± 2.2E−03 |
| Skin | 2.8E−03 ± 0.8E−03 |
| Spleen | 1.7E−02 ± 0.7E−03 |
| Testes | 6.8E−03 ± 2.4E−03 |
| Thymus | 3.3E−03 ± 0.9E−03 |
| Thyroid | 2.7E−03 ± 0.9E−3 |
| Urinary bladder wall | 2.3E−01 ± 1.1E−01 |
| Uterus | 1.8E−02 ± 0.7E−02 |
| Total body | 5.7E−03 ± 1.3E−03 |
| Average effective dose coefficient (mSv/MBq) | 2.0E−02 ± 0.7E−02 |
Data are mean ± SD mGy/MBq in 5 patients.
TABLE 3.
Highest Individual-Organ Absorbed Dose Coefficients
| Type | Organ | Coefficient (mGy/MBq) |
| Critical | Bladder | 2.34E−01 |
| Second highest | Liver | 2.62E−02 |
| Third highest | Kidneys | 2.51E−02 |
The effective dose coefficient in mSv/MBq is shown in the last row of Table 2. The average effective dose for 18F-clofarabine was 0.0203 mSv/MBq. The SD of the effective dose was calculated by taking the mean of the effective doses, which were calculated for each patient separately. An administered dose of 250 MBq would result in an effective dose of 5.1 mSv, which is below the 30-mSv limit established by the Food and Drug Administration (17).
The average uptake for several organs throughout time is shown in Figure 2. All organs showed activity decreasing over time. The bladder demonstrated the highest activity, indicating that most of this tracer is excreted though the genitourinary tract.
DISCUSSION
The current study demonstrated that 18F-clofarabine administration was safe and well tolerated by all subjects. No side effects occurred during or after tracer injection. The absorbed doses for all organs were well within accepted limits. On the basis of these data, this probe is acceptable for research and clinical applications.
We measured the 18F-clofarabine biodistribution in humans, which mirrored the known pattern of dCK expression in human tissues (18) and rodents (10). 18F-clofarabine accumulated in hematopoietic and lymphoid tissues. The organs with the highest uptake were the bladder, kidneys, liver, spleen, and bone marrow. This is expected because most of the tracer is excreted through the urine. Additionally, high bone marrow and splenic uptake are anticipated because these tissues exhibit high dCK expression (18). In studies on dCK knockout mice, liver uptake was absent, suggesting that it is highly specific to dCK expression (11).
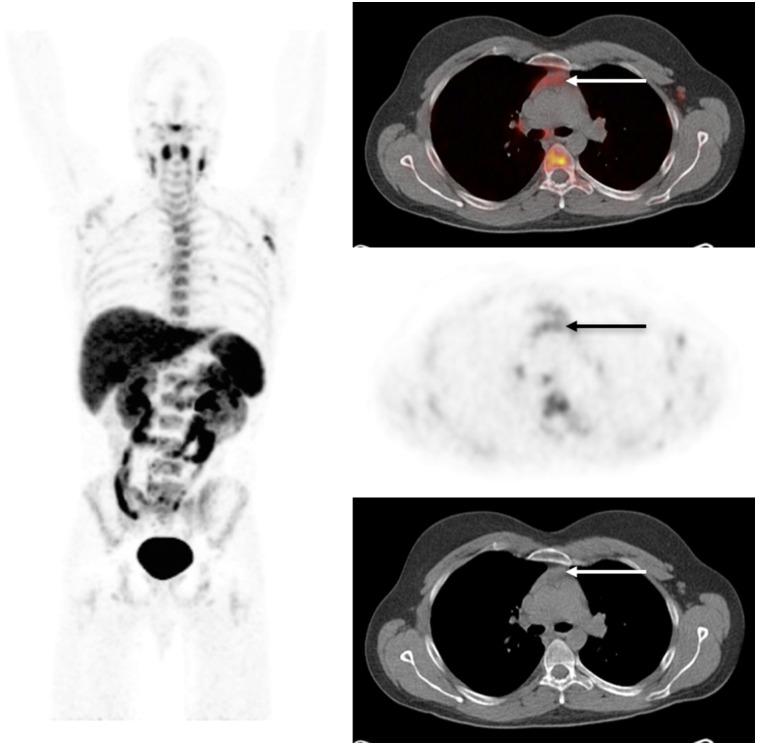
Furthermore, the mild tracer activity noted in some lymph nodes likely represented lymphoid tissue activation. Thymus activity was not observed, most likely because of thymic involution in this group of healthy volunteers with a median age of 58 y. However, a previously acquired scan in a younger patient (27 y old) clearly showed thymic uptake (Fig. 4).
FIGURE 4.
Whole-body biodistribution of 18F-clofarabine in young patient 62 min after tracer injection. Selected axial slices demonstrate moderate uptake in thymus (arrow). (SUV scale, 0–5.8.)
The ability to adequately measure dCK expression could be used for several translational research or clinical applications. For instance, 18F-clofarabine imaging may serve as a predictive biomarker to identify patients who would benefit from dCK-dependent prodrugs or small-molecule dCK inhibitors. Moreover, decreased 18F-clofarabine tissue uptake in response to dCK inhibitors may serve as a pharmacodynamic biomarker.
T- and B-cell development is strongly associated with dCK expression (19). In dCK knockout mouse studies, lymphocytes were reduced 5- to 13-fold below reference values (19), suggesting that lymphopoiesis is highly dCK-dependent. Therefore, 18F-clofarabine activity might be used to monitor immune activation.
The current study had some limitations. First, to ascertain the ability of our volunteers to tolerate the PET procedure, the number of data points for integrating the time–activity curve was limited to 3, with the last measurement performed less than 2 h after administration of 18F-clofarabine. The aim of this study was not to quantify the absorbed doses precisely but to determine whether measurements were within the Radioactive Drug Research Committee limits for absorbed doses in human research. We assumed that the organ activity would completely decay inside the organ. This approach is conservative, as the tracer is predominantly excreted via the genitourinary tract. Even with this safe and conservative approach, the absorbed doses were within the required limits. Furthermore, we did not quantify salivary gland uptake as it was only mild, likely reflecting an excretory pathway. However, this aspect should be considered in future patient studies. Additionally, these measurements were obtained in healthy volunteers, and a less favorable dosimetry would be expected in patients with renal failure, hepatorenal syndrome, or drug treatment that interferes with renal tracer excretion.
To further reduce absorbed doses and since the bladder is the critical organ, frequent postscan voiding, as is done for clinical PET studies, should also be recommended for 18F-clofarabine scans. This practice will ensure that the absorbed dose is lower than what was estimated here. In view of the effective dose, administering an activity of 250 MBq of 18F-clofarabine is acceptable (Table 2).
CONCLUSION
18F-clofarabine has a favorable biodistribution and radiation dosimetry and is not associated with any toxic effects. The organs that demonstrate the highest tracer uptake are the bladder, liver, kidney, and spleen. Future studies will determine whether 18F-clofarabine can serve as a predictive biomarker for response to dCK-dependent prodrugs or for monitoring the effectiveness of immune therapies and small-molecule dCK inhibitors.
DISCLOSURE
This work was supported by award DE-SC0012353 from the U.S. Department of Energy, Office of Science, to Johannes Czernin and Caius G. Radu. No other potential conflict of interest relevant to this article was reported.
REFERENCES
- 1.Zhenchuk A, Lotfi K, Juliusson G, Albertioni F. Mechanisms of anti-cancer action and pharmacology of clofarabine. Biochem Pharmacol. 2009;78:1351–1359. [DOI] [PubMed] [Google Scholar]
- 2.King KM, Damaraju VL, Vickers MF, et al. A comparison of the transportability, and its role in cytotoxicity, of clofarabine, cladribine, and fludarabine by recombinant human nucleoside transporters produced in three model expression systems. Mol Pharmacol. 2006;69:346–353. [DOI] [PubMed] [Google Scholar]
- 3.Parker WB, Shaddix SC, Chang CH, et al. Effects of 2-chloro-9-(2-deoxy-2-fluoro-beta-D-arabinofuranosyl)adenine on K562 cellular metabolism and the inhibition of human ribonucleotide reductase and DNA polymerases by its 5′-triphosphate. Cancer Res. 1991;51:2386–2394. [PubMed] [Google Scholar]
- 4.Austin WR, Armijo AL, Campbell DO, et al. Nucleoside salvage pathway kinases regulate hematopoiesis by linking nucleotide metabolism with replication stress. J Exp Med. 2012;209:2215–2228. [DOI] [PMC free article] [PubMed] [Google Scholar]
- 5.Bunimovich YL, Nair-Gill E, Riedinger M, et al. Deoxycytidine kinase augments ATM-mediated DNA repair and contributes to radiation resistance. PLoS One. 2014;9:e104125. [DOI] [PMC free article] [PubMed] [Google Scholar]
- 6.Nathanson DA, Armijo AL, Tom M, et al. Co-targeting of convergent nucleotide biosynthetic pathways for leukemia eradication. J Exp Med. 2014;211:473–486. [DOI] [PMC free article] [PubMed] [Google Scholar]
- 7.Nomme J, Murphy JM, Su Y, et al. Structural characterization of new deoxycytidine kinase inhibitors rationalizes the affinity-determining moieties of the molecules. Acta Crystallogr D Biol Crystallogr. 2014;70:68–78. [DOI] [PMC free article] [PubMed] [Google Scholar]
- 8.Murphy JM, Armijo AL, Nomme J, et al. Development of new deoxycytidine kinase inhibitors and noninvasive in vivo evaluation using positron emission tomography. J Med Chem. 2013;56:6696–6708. [DOI] [PMC free article] [PubMed] [Google Scholar]
- 9.Nomme J, Li Z, Gipson RM, et al. Structure-guided development of deoxycytidine kinase inhibitors with nanomolar affinity and improved metabolic stability. J Med Chem. 2014;57:9480–9494. [DOI] [PMC free article] [PubMed] [Google Scholar]
- 10.Kim W, Le TM, Wei L, et al. [18F]clofarabine as a clinically translatable probe for PET imaging of deoxycytidine kinase activity. Proc Natl Acad Sci USA. 2016;113:4027–4032. [DOI] [PMC free article] [PubMed] [Google Scholar]
- 11.Shu CJ, Campbell DO, Lee JT, et al. Novel PET probes specific for deoxycytidine kinase. J Nucl Med. 2010;51:1092–1098. [DOI] [PMC free article] [PubMed] [Google Scholar]
- 12.Zanzonico P. Routine quality control of clinical nuclear medicine instrumentation: a brief review. J Nucl Med. 2008;49:1114–1131. [DOI] [PMC free article] [PubMed] [Google Scholar]
- 13.Herrmann K, Lapa C, Wester HJ, et al. Biodistribution and radiation dosimetry for the chemokine receptor CXCR4-targeting probe 68Ga-pentixafor. J Nucl Med. 2015;56:410–416. [DOI] [PubMed] [Google Scholar]
- 14.Stabin MG, Sparks RB, Crowe E. OLINDA/EXM: the second-generation personal computer software for internal dose assessment in nuclear medicine. J Nucl Med. 2005;46:1023–1027. [PubMed] [Google Scholar]
- 15.ICRP publication 60: 1990 recommendations of the International Commission on Radiological Protection. Ann ICRP. 1991;21. [PubMed] [Google Scholar]
- 16.Schiepers C, Hoh CK, Nuyts J, et al. 1-11C-acetate kinetics of prostate cancer. J Nucl Med. 2008;49:206–215. [DOI] [PubMed] [Google Scholar]
- 17.Radioactive drugs for certain research uses. 21 CFR §361.1. U.S. Department of Health and Human Services website. http://www.ecfr.gov/cgi-bin/retrieveECFR?gp=1&SID=2fca621d1f26aa65f805771c7a5066e3&ty=HTML&h=L&mc=true&r=PART&n=pt21.5.361#se21.5.361_11 Current as of November 9, 2016. Accessed November 14, 2016.
- 18.Spasokoukotskaja T, Arner ES, Brosjo O, et al. Expression of deoxycytidine kinase and phosphorylation of 2-chlorodeoxyadenosine in human normal and tumour cells and tissues. Eur J Cancer. 1995;31A:202–208. [DOI] [PubMed] [Google Scholar]
- 19.Toy G, Austin WR, Liao HI, et al. Requirement for deoxycytidine kinase in T and B lymphocyte development. Proc Natl Acad Sci USA. 2010;107:5551–5556. [DOI] [PMC free article] [PubMed] [Google Scholar]


