Abstract
Glioma is the most common malignant brain tumor. The dominant therapeutics including surgery, radiotherapy and chemotherapy do little to improve the survival of patients and the prognosis is disappointing. ZSCAN10 is critical in maintaining the pluripotency of embryonic stem cells. Little information was known about its function in glioma. In this study, ZSCAN10 was shown to be expressed significantly higher in glioma tissues and in cell lines. High ZSCAN10 expression was associated with poor prognosis in glioma. When ZSCAN10 was knocked down, proliferation as well as colony formation of glioma cells were inhibited drastically. In contrast, overexpression of ZSCAN10 promoted cell proliferation and colony formation. However, apoptosis was not affected by ZSCAN10. ZSCAN10 was shown to enhance expression of OCT4 through interaction with the promoter of OCT4 gene by ChIP-qPCR assay and luciferase reporter assay. ZSCAN10 could not promote proliferation of U251 cells when OCT4 was knocked down. In addition, the expression of β-catenin was down-regulated after ZSCAN10 knockdown in U251 cells However, the expression level of DKK1 increased inversely. In summary, ZSCAN10 was associated with survival of glioma patients and contributed to cell proliferation through upregulating OCT4 expression. Moreover, ZSCAN10 might partially participate in the activation of Wnt/β-catenin signaling in glioma.
Keywords: ZSCAN10, OCT4, glioma, β-catenin
Introduction
Glioma is a very common malignant tumor in nervous system. The main therapy is surgery followed by radiotherapy and/or chemotherapy [1]. But the prognosis for patients with glioma is unsatisfactory. According to the newest cancer statistics released in 2018, there are about 23,880 new cases of glioma and the estimated deaths are 16,830 [2]. Therefore, it is urgent to explore how glioma cells survive in humans and the underpinning molecular mechanism.
Glioma is characterized by heterogeneity, which means multiple factors contribute to the development of glioma. Thus, it is meaningful to dig out new critical molecules in glioma. ZSCAN10, also known as Zfp206, is a 14 zinc finger transcription factor with a N-terminal SCAN domain [3,4]. ZSCAN10 gene is located on chromosome 16p13.3 and was reported to play important roles in development. For example, knockdown of ZSCAN10 was associated with impaired osteoclastogenesis and abnormal skeletal muscle development [5,6]. ZSCAN10 was essential to the pluripotency of embryonic stem cells (ESC) through interaction with OCT4 and SOX2 which are public pluripotency markers for ESC [7,8]. A new study disclosed that ZSCAN10 participated in the process of rejuvenation [9]. ZSCAN10 was shown to counteract the effects of genomic instability in induced pluripotent stem cells derived from elder donors [9]. As we know, genomic instability is common in many kinds of tumors. Therefore, ZSCAN10 might play important roles in tumors. To date, only one study reported the function of ZSCAN10 in tumor. In seminomas, with the help of OCT4, ZSCAN10 regulated expression of PRAME gene in somatic or germ cell differentiation [10].
OCT4 was a pluripotency marker in ESC and was found to be an oncogene in liver cancer, lung cancer, and lymphoma [11-13]. OCT4 was shown to be overexpressed in glioma and promoted cell proliferation as well as colony formation [14]. OCT4 could activate Wnt/β-catenin signaling and promote cell proliferation in liver cancer [15]. Further, Olmez et al. demonstrated that OCT4 induced the neurosphere formation of glioblastoma multiforme through activation of Wnt/β-catenin signaling [16]. Wnt/β-catenin signaling was very important during development and was reported to be over-activated in glioma [17,18].
In this study, to investigate the function of ZSCAN10 gene in glioma, we downregulated the expression of ZSCAN10 in glioma cells and found that ZSCAN10 played an oncogene role in glioma and regulated β-catenin expression through OCT4.
Materials and methods
Cell culture and tumor tissues
Five glioma cell lines (U251, A172, CCF-STTG1, T98G and U87MG) and two normal human astrocyte cell lines (NHA and HA) were purchased from Cell Bank of Shanghai Chinese Academy of Sciences (Shanghai, China) and were cultured in RPMI 1640 medium containing 10% fetal bovine serum (Gibco Co., Ltd. USA) at 37°C.
Frozen fresh glioma tissues and the paired adjacent control tissues were obtained from department of Neurosurgery in the second affiliated hospital of Nanchang university. Approval was obtained from the research ethics comittee of the second affiliated hospital of Nanchang university.
RNA preparation and quantitative real-time PCR (qPCR)
Total RNA was extracted with the Trizol reagent (Invitrogen, CA, USA). Then 1 µg of RNA was used for qPCR assay on the ABI7000 fluorescent quantitative PCR system with the primers listed in Table 1. β-actin was selected as the internal control. The PCR parameters were 10 min at 95°C followed by 45 cycles of 15 sec at 95°C and 60 sec at 60°C. The level of target gene was analyzed with the 2-∆∆Ct method.
Table 1.
Primers used for qPCR assay
| Gene symbol | Primers (5’ to 3’) | |
|---|---|---|
| ZSCAN10 | Forward | GGGCCGCTGGATTTTAGTTGT |
| Reverse | CTTCCGCAGGCAATTCCTTCT | |
| OCT4 | Forward | CAAAGCAGAAACCCTCGTGC |
| Reverse | AACCACACTCGGACCACTCG | |
| GAPDH | Forward | TGTGGGCATCAATGGATTTGG |
| Reverse | ACACCATGTATTCCGGGTCAAT | |
TCGA database mining
The survival data of about 500 glioma patients and the expression of ZSCAN10 gene in glioma tissues and the paired adjacent control tissues were downloaded from the TCGA data portal. The association of ZSCAN10 expression with survival time of 35 patients was analyzed with Kaplan-Meier approach. The difference between different groups was evaluated with log-rank test. P value < 0.05 was considered as statistically significant.
Proliferation assay (CCK-8)
After transfection of siRNA for 24 h, cells were digested and seeded into 96-well plates at 5000 cells/well and cultured at 37°C. At 1, 3, and 5 days, 10 µL of CCK-8 solution (Beyotime, Shanghai, China) was added and incubated for another 2 h followed by monitoring at 450 nm on a microplate reader. The experiment was repeated for at least 3 times.
Annexin V-FITC/PI staining assay
The apoptosis of U251 cells was determined with Annexin V-FITC apoptosis kit according to the attached instruction (Beyotime, Shanghai, China). In brief, a total of 1×10⁶ cells were seeded into a 6-well plate and were treated with siRNA. After incubation for 48 h, cells were collected and washed with PBS buffer. Then Annexin V-FITC and PI solution were added into cell solution and incubated for 15 min at room temperature. Lastly, cells were analyzed on FACScalibur (BD Bioscience, USA).
Colony formation assay
After transfection of siRNA for 24 h, cells were digested and seeded into 6-well plates at 3000 cells/well and cultured at 37°C for 14 days. Then formed cell colonies were stained with crystal violet and photographed. The experiment was repeated at least 3 times.
Chromatin immunoprecipitation-quantitative real-time PCR (ChIP-qPCR)
ChIP was conducted according to the reference. Briefly, cells were fixed in 1% formaldehyde (Thermo Fisher Scientific, Waltham, USA) in PBS for 10 min and fixation was quenched with 125 mM of glycine for 5 min. Then, cells were collected and lysed followed by being to sonication for 10 min in the Covaris sonicator (S220). Afterwards, the supernatant was diluted in PBS buffer and subjected to immunoprecipitation with antibody against ZSCAN10 at 4°C overnight. Then the beads were washed and bound DNA was reverse-crosslinked and purified. Then the purified DNA was quantified by standard qPCR procedure on a 7500 Real-Time PCR platform (Applied Biosystems, Carlsbad, CA, USA). The primers used for ChIP-qPCR were listed in Table 2.
Table 2.
Primers used in ChIP-qPCR assay
| Primer name | Primer sequence (5’ to 3’) |
|---|---|
| R1 Forward | TTTGATTAGGCTTGAGAGGAG |
| R1 Reverse | AGTTGTCCCTGTGCCTCTGTA |
| R2 Forward | AACTAATGTCTCATTCCTGTC |
| R2 Reverse | CACTCATTCAAGATAACCAGC |
| R3 Forward | CCATTTAACTGATCACCCAGT |
| R3 Reverse | TGGTCATCTGCAGTTACATGG |
| R4 Forward | TGGCATTCCGCATCTGGCTT |
| R4 Reverse | TCTGTCTCGGAGTTCTGTCTG |
| R5 Forward | TGCTGGGCTGCAGGCATACT |
| R5 Reverse | TCTGCCCAGAACTCTCAACCT |
| R6 Forward | GGTGAAGTCGATGAAGCTGAG |
| R6 Reverse | GGGGGTGTCTCTTGATGGTAG |
| R7 Forward | CTGGAGGAAGGGAAGCAGGGT |
| R7 Reverse | CCCCAATCCCCTCACACAAGA |
| R8 Forward | TCTGAAAACGCAGAGCCAGCA |
| R8 Reverse | CAGTATTTCAGCCCATGTCCA |
| R9 Forward | AACTGGTTTGTGAGGTGTCCG |
| R9 Reverse | GACGTCTGGACAGGACAACCC |
| R10 Forward | GGATTGGGGAGGGAGAGGTGA |
| R10 Reverse | GGGGTGAGAAGGCGAAGTCTG |
| R11 Forward | CCTGCCTGCCAAAGGTGGTGA |
| R11 Reverse | GGCCAGGCCGAAACAATCCA |
| R12 Forward | ACACGCTGCAACTTAGAAAGC |
| R12 Reverse | CAGGCATGCACACACCACAAA |
| R13 Forward | GAGCCATGTGTTTCTTGAGTAAAGGG |
| R13 Reverse | TCCTAGGTGACATAGATGGCTCTT |
| R14 Forward | CACAGTCCCAGCTGGTGTGAC |
| R14 Reverse | CTGCTTCAGCAGCTTGGCAAAC |
Luciferase reporter assay
The promoter of OCT4 was PCR-amplified and cloned into vector pGL-3 containing reporter gene luciferase. ZSCAN10 was cloned into expression vector pcDNA3.1. Then the two plasmids and a control plasmid pRL-TK were transfected into HEK293 cells using Lipofectamine-2000 reagent (Invitrogen, Carlsbad, USA) according to the instruction. After transfection for 48 h, luciferase activity was detected using the Dual-Luciferase Activity Assay System (Promega, USA). All the experiments were repeated three times.
Immunohistochemical staining
A total of 35 tissues from patients with mixed oligoastrocytic gliomas were collected from department of Neurosurgery in the second affiliated hospital of Nanchang university. The 35 patients were diagnosed as WHO grade I to grade IV. The tissues were fixed in 10% buffered formalin and embedded in paraffin. 5 μm sections were deparaffinized in xylene and rehydrated in graded alcohol. For epitope retrieval, sections were heated in 10 mM citrate buffer (pH 6.0) for 2 min. Then the sections were treated with 3% hydrogen peroxide and washed with phosphate-buffered saline at room temperature followed by incubation overnight at 4°C with primary antibody against human ZSCAN10 (1:500 dilution, Abcam, USA). After that, the sections were incubated with horseradish peroxidase-conjugated secondary antibody for 60 min at room temperature followed by counterstaining with hematoxylin. All sections were examined under a microscope by two independent researchers. The staining intensity was scored as below: 0 (negative), 1 (weak), 2 (moderate), 3 (strong). Based on the percentage of positively stained cells, the staining extent was scored as below: 0 (0%), 1 (1%-25%), 2 (26%-50%), 3 (51%-75%) and 4 (76%-100%). The final immunoreactivity score (IRS) equaled the intensity score multiplied by the quantity score. The staining of ZSCAN10 was clarified as two groups according to the IRS: negative (0-4) and positive (5-12).
Western blotting analysis
The cells were lysed with RIPA buffer (Beyotime Biotechnology, Haimen, China) and total protein was extracted. Then 10 µg of protein was separated using sodium dodecyl sulfate-polycrylamide gel electrophoresis and transferred onto PVDF membranes (Millipore, Bedford, MA, USA). Then the PVDF membranes were incubated with primary antibodies against β-catenin, DKK1, ZSCAN10, OCT4 (Abcam, Cambridge, MA, USA) at 4°C overnight followed by washing with TBST reagent and incubating with secondary antibody at room temperature for 1 h. Then the PVDF membrane was stained with enhanced chemiluminescence kit (Thermofisher Scientific, Carlsbad, MA, USA).
Statistical analysis
All data were expressed as mean ± standard deviation. Statistical analyses were performed with SPSS version 16.0 (SPSS Inc. Chicago, IL, USA). The difference between control and test group was analyzed by paired Student’s t-test or One-Way ANOVA analysis followed by Post Hoc Tukey. The relationship between ZSCAN10 expression and survival of patients was analyzed with Kaplan-Meier method. P value < 0.05 was considered significant.
Results
Overexpression of ZSCAN10 was associated with prognosis in glioma patients
To explore the clinical importance of ZSCAN10 in glioma, we determined the level of ZSCAN10 in glioma tissues and in typical cell lines. As shown in Figure 1A, the mRNA level of ZSCAN10 in 16 glioma tissues was much higher than that in the adjacent normal control tissues. The protein level of ZSCAN10 was also significantly higher in tumor tissues (Figure 1B, 1C). Interestingly, it was found that the level of ZSCAN10 in Grade III/IV tumor tissues was higher than that in Grade I/II tissues. Then the expression of ZSCAN10 gene in glioma cell lines (T98G, A172, U251, U87MG and CCF-STTG1) was much higher than that in human astrocyte cell lines (NHA and HA) (Figure 1D). Furthermore, IHC analysis in 35 glioma tissues also supported that ZSCAN10 was expressed stronger in tumor tissues (Figure 2A). The mean IRS in tumor tissues was 5.91 ± 1.70. But it was 1.20 ± 0.99 in the paired adjacent control tissues (Table 3). The difference between the two groups was statistically significant (P < 0.05). Kaplan-Meier analysis with TCGA data demonstrated that patients with high level of ZSCAN10 displayed much worse overall survival compared to the cohort with low ZSCAN10 expression (P < 0.01) (Figure 2B). Conclusively, ZSCAN10 was over-expressed in glioma tissues and cell lines and the expression of ZSCAN10 was associated with prognosis of glioma.
Figure 1.

The expression level of ZSCAN10 in glioma. (A) ZSCAN10 was expressed much higher in 16 glioma tissues than the control. (B) Western blotting of ZSCAN10 in representative glioma tissues. (C) Quantification of ZSCAN10 level in (B). (D) ZSCAN10 was expressed higher in glioma cell lines than in the normal cells NHA or HA. **P < 0.01, ***P < 0.001.
Figure 2.
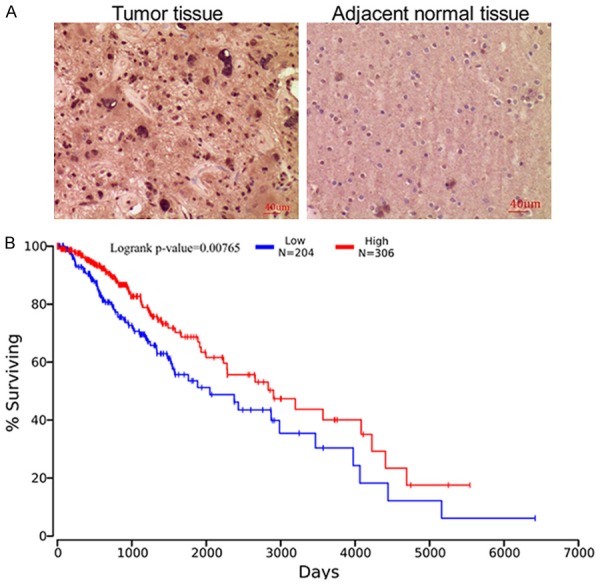
ZSCAN10 is associated with glioma in the clinic. A. IHC analysis displayed stronger expression of ZSCAN10 in tumor tissues compared to the adjacent normal tissues. B. K-M analysis with TCGA data demonstrated that patients with high ZSCAN10 showed poor survival rate (P < 0.01).
Table 3.
Mean score of ZSCAN10 expression in 35 tumor tissues and adjacent control tissues by IHC analysis
| Group | Adjacent normal tissues | Tumor tissues | P value |
|---|---|---|---|
| Score value | 1.20 ± 0.99 | 5.91 ± 1.70 | < 0.05a |
represents a significant difference between tumor tissues and adjacent normal tissues.
ZSCAN10 was critical to proliferation but not apoptosis in glioma cell lines
To explain the discovery of ZSCAN10 in the clinic, we decreased the expression of ZSCAN10 in three glioma cell lines. As shown in Figure 3A-C, the mRNA level of ZSCAN10 was decreased markedly in U251, T98G and U87MG cells. The knockdown efficiency was above 60% in all cell lines. As seen in Figure 3D-F, the proliferation of the three cell lines was potentially inhibited after knockdown of ZSCAN10. Furthermore, the colony formation was suppressed after ZSCAN10 was knocked down in glioma cells (Figure 3G-I). But forced expression of ZSCAN10 in U251 cells promoted cell proliferation as well as the colony formation reversely (Figure 3J-L). However, FACS analysis demonstrated that the apoptosis of U251 cells was not affected by ZSCAN10 (Figure 4A and 4B). These data suggested that ZSCAN10 contributed to the growth and proliferation of glioma cells but not apoptosis.
Figure 3.

ZSCAN10 regulates proliferation in glioma. A-C. ZSCAN10 was successfully knocked down in U251, T98G, and U87MG cells. D-F. ZSCAN10 knockdown inhibited proliferation in U251, T98G, and U87MG cells. G-I. ZSCAN10 knockdown inhibited colony formation in glioma cells. J. ZSCAN10 was overexpressed in U251 cells. K. Upregulated ZSCAN10 expression promoted cell proliferation of U251 cells. L. Upregulated ZSCAN10 expression inhibited colony formation of U251 cells. *P < 0.05, ** < 0.01, ***P < 0.001.
Figure 4.
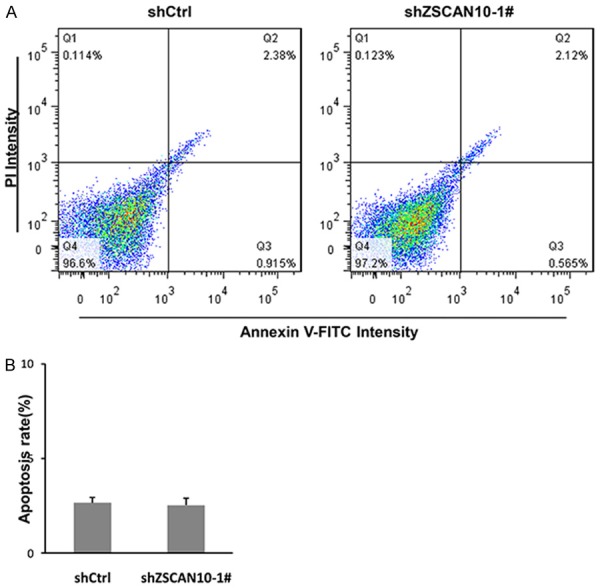
ZSCAN10 shows little effect on apoptosis. (A) FACs analysis showed the apoptotic rate of U251 cells was not affected by ZSCAN10 knockdown. (B) The quantification of apoptotic cells in (A).
ZSCAN10 regulated the expression of OCT4
As stated in the above text, OCT4 was regulated by ZSCAN10. So we determined the expression of OCT4 in glioma cells after ZSCAN10 was knocked down. As seen in Figure 5A, the mRNA level of OCT4 was decreased by above 55% compared to the control after ZSCAN10 knockdown in U251 cells. Also, data from western blotting suggested that OCT4 decreased greatly at the protein level (Figure 5B). In contrast, OCT4 increased reversely at both mRNA and protein level after ZSCAN10 was overexpressed in U251 cells (Figure 5C and 5D). Therefore, ZSCAN10 promoted expression of OCT4 in U251 cells.
Figure 5.
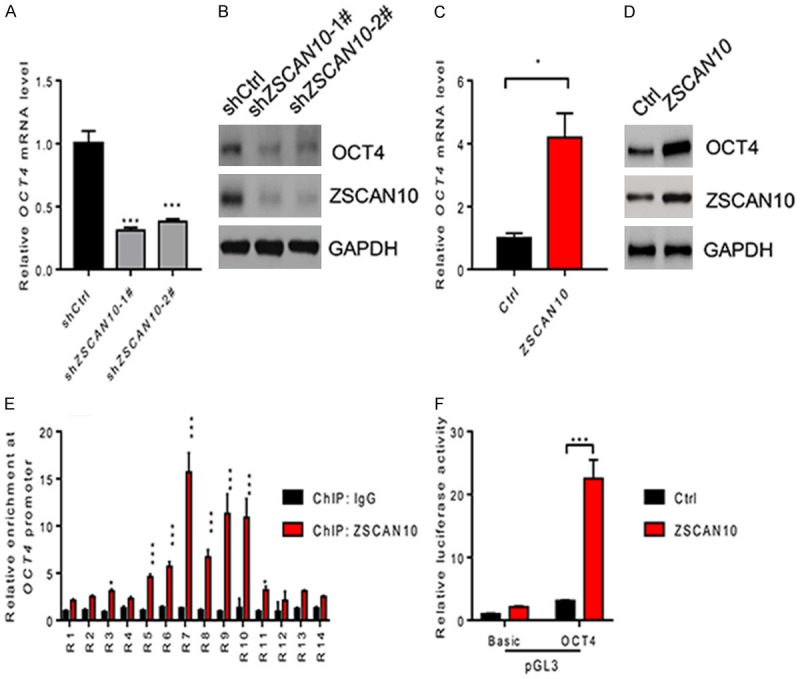
ZSCAN10 promotes expression of OCT4 through binding to the promoter of OCT4 in U251 cells. (A, B) The expression of OCT4 was downregulated in U251 cells at mRNA level (A) and protein level (B) after ZSCAN10 knockdown. (C, D) The expression of OCT4 was increased in U251 cells at mRNA level (C) and protein level (D) after ZSCAN10 overexpression. (E) Representative ChIP-qRT-PCR results showed ZSCAN10 bound to OCT4 promoter in U251 cells. (F) Positions of the 14 regions (probe numbers 1-14) amplified are indicated as distances (-6 to 3 kb) from the transcriptional start site (TSS) of the OCT4 gene. *P < 0.05, ** < 0.01, ***P < 0.001.
Then we analyzed the promoter of OCT4 gene and synthesized a series of primers to detect the 14 regions (R1 to R14) from transcriptional start site of OCT4. As seen in Figure 5E, ZSCAN10 bound to R3, R5-R11 sequence in promoter of OCT4 gene. This suggested that ZSCAN10 interacted with OCT4 in U251 cells. Then a luciferase reporter system demonstrated that ZSCAN10 induced the expression of luciferase potently (Figure 5F). The luciferase activity in ZSCAN10 group was as much as 5 fold of that in the control group. Thus, ZSCAN10 promoted expression of OCT4 through interaction with the promoter of OCT4 in glioma cell lines.
The function of ZSCAN10 in glioma cells was dependent on OCT4
OCT4 is a pluripotency marker for ESC and was reported to promote cell proliferation in several types of cancers. Here, we decreased the expression level of OCT4 in U251 cells (Figure 6A). The proliferation ability of U251 cells was greatly inhibited after OCT4 knockdown even though ZSCAN10 was overexpressed (Figure 6B). Consistently, the colony formation ability of U251 cells was also suppressed after OCT4 knockdown and ZSCAN10 could not rescue this detrimental effect (Figure 6C). As a result, we concluded that OCT4 was essential to the function of ZSCAN10 in glioma.
Figure 6.
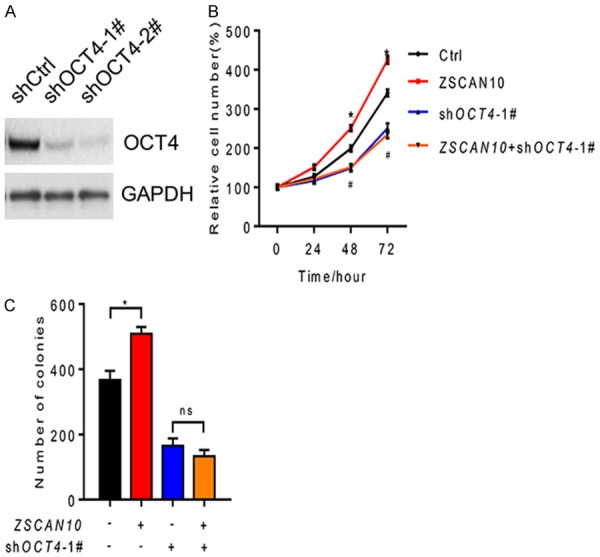
ZSCAN10 is dependent on OCT4. A. OCT4 was knocked down successfully in U251 cells. B. OCT4 knockdown could suppress the proliferation-promoting effect of ZSCAN10 on U251 cells. C. OCT4 knockdown could inhibit colony formation in U251 cells overexpressing ZSCAN10. *P < 0.05, ns: not significant.
ZSCAN10 regulates Wnt/β-catenin signaling pathway in U251
OCT4 was reported to activate Wnt/β-catenin signaling in several types of cancers. In this study, we demonstrated that the expression of β-catenin was decreased after ZSCAN10 knockdown in U251 cells (Figure 7A, 7B). The expression of cyclinD1 as well as TCF was also reduced by ZSCAN10 knockdown. But the level of DKK1 increased reversely (Figure 7A, 7B). Meanwhile, OCT4 was decreased consistently with β-catenin and ZSCAN10. OCT4 was proven to be regulated by ZSCAN10 in the above text. Therefore, it was conceived that ZSCAN10 regulated OCT4 expression and might regulate Wnt/β-catenin signaling in glioma cells.
Figure 7.
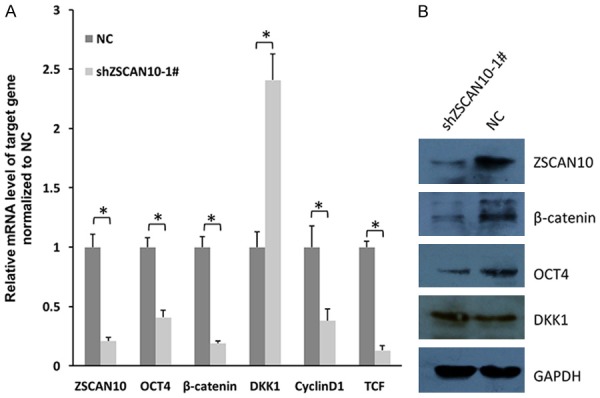
ZSCAN10 affects expression of critical molecules in Wnt/β-catenin signaling. A. RT-qPCR assay showed that the expression of OCT4, β-catenin, cyclinD1 and TCF was reduced when ZSCAN10 was decreased in U251 cells. But the level of DKK1 was increased reversely. B. Western blot analysis of CT4, β-catenin and DKK1 after ZSCAN10 knockdown. GAPDH was selected as internal control.
Discussion
Cancer is a malignant and heterogeneous disease. Next-generation sequencing has partially disclosed the mask of cancer for us. At present, the dominant view is that several dozens or hundreds of gene mutations exist in each cancer. But only one or several genes drive the transformation of normal cells to cancer cells [19,20]. This theory partially accounts for the heterogeneity of cancer and makes it very important to lock up the driver gene. A large number of studies have discovered a group of critical genes in glioma and different genes play the role of driver gene in different conditions [21]. As a result, the overall prognosis of patients with glioma is unsatisfactory to date.
In this study, we proved that ZSCAN10 played an oncogene role in glioma. As shown in the above text, the ability of cell proliferation as well as colony formation was significantly inhibited after ZSCAN10 was knocked down in glioma cell lines. And vice versa, overexpressed ZSCAN10 promoted cell proliferation and colony formation in U251 cells. It is known that tumor is characterized by unlimited expansion [22]. Therefore, the in vitro data suggested that ZSCAN10 was critical in glioma. Then by qPCR and IHC assay, we proved that ZSCAN10 was overexpressed in tumor tissues and glioma cell lines. Moreover, ZSCAN10 was shown to be correlated with overall survival in patients with glioma. These data made ZSCAN10 a promising prognostic factor for glioma patients.
ZSCAN10 was originally shown to maintain the pluripotency of ESC by interaction with OCT4 and SOX2 [7,8]. OCT4 and SOX2 are two recognized pluripotency marker for ESC and regulated the differentiation of ESC [8]. ZSCAN10 was previously reported to bind to the promoter of OCT4 and regulate expression of OCT4 [3]. This was consistent with our data. In this study, we also proved that ZSCAN10 could regulate the expression of OCT4 through interaction with the promoter of OCT4 in glioma cells. OCT4 was essential to the function of ZSCAN10 in glioma cells since knockdown of OCT4 could counteract the proliferative effects exerted by ZSCAN10. So it was conceived that ZSCAN10 promoted proliferation of glioma cells by regulating OCT4 expression. OCT4 was reported to play important roles in a series of cancers. For example, OCT4 level was closely correlated to clinical stage and lymph node metastasis of laryngeal carcinoma [23]. In hepatocellular carcinoma, OCT4 expression was associated with tumor size and TNM stage [24]. In recurrent glioma, OCT4 was up-regulated by DNA hypomethylation [25]. OCT4 was reported to promote colony formation in glioma [14]. Accordingly, OCT4 is an oncogene in glioma and is regulated by ZSCAN10.
Unlimited cell proliferation is common in cancer [22]. In many cancers, Wnt/β-catenin signaling was reported to be over-activated and promoted cell proliferation [26,27]. In this study, we found that the expression level of β-catenin was down-regulated greatly in U251 cells after ZSCAN10 knockdown. But, DKK1 increased reversely. This suggested that ZSCAN10 knockdown inhibited the activation of Wnt/β-catenin signaling. β-catenin was a critical molecule in Wnt signaling pathway. When activated, the level of β-catenin was accumulated in the cytoplasm and translocated to the nucleus followed by enhanced expression of downstream genes [27]. DKK1 is a negative regulator of Wnt signaling. The level of DKK1 was decreased when Wnt signaling was activated. OCT4 expression was in consistent with ZSCAN10, β-catenin and DKK1. In a previous study, OCT4 was reported to activate Wnt/β-catenin signaling and promoted formation of large neurospheres from brain tumor cells [18]. Also, OCT4 was reported to directly activate Wnt/β-catenin signaling in several other tumors. Therefore, it was reasonable that ZSCAN10 activated Wnt/β-catenin signaling in glioma cells by regulating expression of OCT4, which then promoted cell proliferation. More experiments are necessary to explore the mechanism of how ZSCAN10-OCT4 regulated Wnt/β-catenin signaling in glioma cells.
In summary, we proved that ZSCAN10 is an oncogene in glioma and is correlated to the prognosis of patients with glioma. This study provides us a basis to deeply study the mechanism of ZSCAN10 in glioma and will develop a new candidate target for therapy of patients with glioma.
Acknowledgements
This work was supported by National Natural Science Foundation of China (No. 81760446 and No. 81660420), Natural Science Foundation of Jiangxi Province (No. 20171ACB20035), the Preponderant Science and Technology Innovation team building project of Jiangxi Province (No. 20171ACB20035), Construction plan of the superior science and technology innovation team of Jiangxi Province (No. 20152BCB24009), Foreign science and technology cooperation plan of Jiangxi Province (No. 20151BDH80009).
Disclosure of conflict of interest
None.
References
- 1.Narita Y. Epidemiology and standard therapy in gliomas (Current status and perspectives of treatment for Glioma) Japanese J Neurosurg. 2012;21:184–191. [Google Scholar]
- 2.Siegel RL, Miller KD, Jemal A. Cancer statistics, 2018. CA Cancer J Clin. 2018;68:7–30. doi: 10.3322/caac.21442. [DOI] [PubMed] [Google Scholar]
- 3.Yu HB, Kunarso G, Hong FH, Stanton LW. Zfp206, Oct4, and Sox2 are integrated components of a transcriptional regulatory network in embryonic stem cells. J Biol Chem. 2009;284:31327–31335. doi: 10.1074/jbc.M109.016162. [DOI] [PMC free article] [PubMed] [Google Scholar]
- 4.Liang Y, Huimei Hong F, Ganesan P, Jiang SZ, Jauch R, Stanton LW, Kolatkar PR. Structural analysis and dimerization profile of the SCAN domain of the pluripotency factor Zfp206. Nucleic Acids Res. 2012;40:8721–8732. doi: 10.1093/nar/gks611. [DOI] [PMC free article] [PubMed] [Google Scholar]
- 5.Inoue K, Imai Y. Identification of novel transcription factors in osteoclast differentiation using genome-wide analysis of open chromatin determined by DNase-seq. J Bone Miner Res. 2014;29:1823–1832. doi: 10.1002/jbmr.2229. [DOI] [PubMed] [Google Scholar]
- 6.Barcena C, Lopez-Otin C. A fruitful liaison of ZSCAN10 and ROS on the road to rejuvenation. Nat Cell Biol. 2017;19:1012–1013. doi: 10.1038/ncb3602. [DOI] [PubMed] [Google Scholar]
- 7.Kraus P, Sivakamasundari V, Yu HB, Xing X, Lim SL, Adler T. Pleiotropic functions for transcription factor Zscan10. PLoS One. 2014;9:e104568. doi: 10.1371/journal.pone.0104568. [DOI] [PMC free article] [PubMed] [Google Scholar]
- 8.Wang ZX, The CH, Kueh JL, Lufkin T, Robson P, Stanton LW. Oct4 and Sox2 directly regulate expression of another pluripotency transcription factor, Zfp206, in embryonic stem cells. J Biol Chem. 2007;282:12822–12830. doi: 10.1074/jbc.M611814200. [DOI] [PubMed] [Google Scholar]
- 9.Barcena C, Lopez-Otin C. A fruitful liaison of ZSCAN10 and ROS on the road to rejuvenation. Nat Cell Biol. 2017;19:1012–1013. doi: 10.1038/ncb3602. [DOI] [PubMed] [Google Scholar]
- 10.Nettersheim D, Arndt I, Sharma R, Riesenberg S, Jostes S, Schneider S, Holzel M, Kristiansen G, Schorle H. The cancer/testis-antigen PRAME supports the pluripotency network and represses somatic and germ cell differentiation programs in seminomas. Br J Cancer. 2016;115:454–464. doi: 10.1038/bjc.2016.187. [DOI] [PMC free article] [PubMed] [Google Scholar]
- 11.Liu QY, Chen KF, Liu ZJ, Huang Y, Zhao RC, Wei L, Yu X, He J, Liu J, Qi J, Qin Y, Li B. BORIS up-regulates OCT4 via histone methylation to promote cancer stem cell-like properties in human liver cancer cells. Cancer Lett. 2017;403:65–174. doi: 10.1016/j.canlet.2017.06.017. [DOI] [PubMed] [Google Scholar]
- 12.Chen YP, Zhu WF, Chen LF, Lu JP, He TM, Fu WD, Xu CW, Chen G. Clinicopathologic features and expression of OCT4 protein in testicular diffuse large B cell lymphoma. Zhonghua Bing Li Xue Za Zhi. 2017;46:383–387. doi: 10.3760/cma.j.issn.0529-5807.2017.06.004. [DOI] [PubMed] [Google Scholar]
- 13.Li B, Yao ZH, Wan YY, Lin D. Overexpression of OCT4 is associated with gefitinib resistance in non-small cell lung cancer. Oncotarget. 2016;7:77342–77347. doi: 10.18632/oncotarget.12999. [DOI] [PMC free article] [PubMed] [Google Scholar]
- 14.Du Z, Jia D, Liu S, Wang F, Li G, Zhang Y, Cao X, Ling EA, Hao A. Oct4 is expressed in human gliomas and promotes colony formation in glioma cells. Glia. 2009;57:724–733. doi: 10.1002/glia.20800. [DOI] [PubMed] [Google Scholar]
- 15.Sun L, Liu TH, Zhang S, Guo K, Liu Y. Oct4 induces EMT through LEF1/β-catenin dependent WNT signaling pathway in hepatocellular carcinoma. Oncol Lett. 2017;13:2599–2606. doi: 10.3892/ol.2017.5788. [DOI] [PMC free article] [PubMed] [Google Scholar]
- 16.Olmez I, Shen W, McDonald H, Ozpolat B. Dedifferentiation of patient-derived glioblastoma multiforme cell lines results in a cancer stem cell-like state with mitogen-independent growth. J Cell Mol Med. 2015;19:1262–72. doi: 10.1111/jcmm.12479. [DOI] [PMC free article] [PubMed] [Google Scholar]
- 17.Zhang KL, Zhang JX, Han L, Pu PY, Kang CS. Wnt/β-catenin signaling in glioma. J Neuroimmune Pharmacol. 2012;7:740–9. doi: 10.1007/s11481-012-9359-y. [DOI] [PubMed] [Google Scholar]
- 18.Wang Y, Jiang M, Yao Y, Cai Z. WWC3 inhibits glioma cell proliferation through suppressing the Wnt/β-catenin signaling pathway. DNA Cell Biol. 2018;37:31–37. doi: 10.1089/dna.2017.3931. [DOI] [PubMed] [Google Scholar]
- 19.Youn A, Simon R. Identifying cancer driver genes in tumor genome sequencing studies. Bioinformatics. 2011;27:175–81. doi: 10.1093/bioinformatics/btq630. [DOI] [PMC free article] [PubMed] [Google Scholar]
- 20.Hua X, Xu H, Yang Y, Zhu J, Liu P, Lu Y. DrGaP: a powerful tool for indentifying driver genes and pathways in cancer sequencing studies. Am J Hum Genet. 2013;93:439–51. doi: 10.1016/j.ajhg.2013.07.003. [DOI] [PMC free article] [PubMed] [Google Scholar]
- 21.Kalkan R. The importance of mutational drivers in GBM. Crit Rev Eukaryot Gene Expr. 2016;26:19–26. doi: 10.1615/CritRevEukaryotGeneExpr.v26.i1.30. [DOI] [PubMed] [Google Scholar]
- 22.Hanahan D, Weinberg RA. Hallmarks of cancer: the next generation. Cell. 2011;144:646–74. doi: 10.1016/j.cell.2011.02.013. [DOI] [PubMed] [Google Scholar]
- 23.Chen HY, Han XL, Wang RG, Song XF, Zhang HZ. The expression of OCT4 and its clinical significance in laryngeal squamous carcinoma tissues. Eur Rev Med Pharmacol Sci. 2017;21:4591–4594. [PubMed] [Google Scholar]
- 24.Liang CJ, Xu YC, Ge H, Li GM, Wu JX. Clinicopathological and prognostic significance of OCT4 in patients with hepatocellular carcinoma: a meta-analysis. Onco Targets Ther. 2017;11:47–57. doi: 10.2147/OTT.S151390. [DOI] [PMC free article] [PubMed] [Google Scholar]
- 25.Wu Y, Sun B, Shi W, Ni L, Chen J, Cai G, Shi J. OCT4 is up-regulated by DNA hypomethylation of promoter in recurrent gliomas. Neoplasma. 2016;63:378–84. doi: 10.4149/306_150919N492. [DOI] [PubMed] [Google Scholar]
- 26.Voronkov A, Krauss S. Wnt/beta-catenin signaling and small molecule inhibitors. Curr Pharm Des. 2013;19:634–64. doi: 10.2174/138161213804581837. [DOI] [PMC free article] [PubMed] [Google Scholar]
- 27.Zhan T, Rindtorff N, Boutros M. Wnt signaling in cancer. Oncogene. 2017;36:1461–1473. doi: 10.1038/onc.2016.304. [DOI] [PMC free article] [PubMed] [Google Scholar]


