Abstract
National Electrical Manufacturers Association (NEMA) provides guidelines to assess the performance of Positron Emission Tomography (PET). A PET/CT scanner, Discovery IQ, GE Medical systems, Milwaukee, USA was installed in our department which has high a sensitivity PET component. We have performed the NEMA NU-2 2012 quality control tests to evaluate this system on site before clinical use. Performance measurements of the PET scanner were made using the NEMA NU2-2012 procedures for spatial resolution, scatter fraction, sensitivity, count rate loss and random coincidence estimation, Noise Equivalent Count Rate (NECR) and image quality. As per NU2 2012, spatial resolution was measured at 1 cm, 10 cm and 20 cm vertically from the centre and at each of these points resolution was measured at tangential, radial and axial directions. Sensitivity was measured at centre and 10 cm off center vertically from the center. The system sensitivity is reported as an average of the two measured values. Scatter fraction and NECR measurements, Image quality test was also performed. The tangential, radial and axial FWHM were 4.99 mm, 4.20 mm and 4.79 mm at 1 cm off centre, 5.49 mm, 4.69 mm and 4.81 mm at 10 cm off centre and 7.99 mm, 5.07 mm and 4.95 mm at 20 cm off centre respectively. The absolute sensitivity of this scanner was found to be 20.1 cps/kBq. The scatter fraction calculated from the decay method was 37.94% and NECR was 125 kcps. The peak NECR was achieved at activity concentration of 8.7 KBq/ml and the count loss below the peak NECR was found to be 0.68%. Image quality test for, contrast recovery, background variability and lung error residual mean met all specifications. Overall PET performance of Discovery IQ whole-body scanner was satisfactory and the scanner met all the performance specifications required by NEMA 2012.
Keywords: Discovery image quality, image quality, National Electrical Manufacturers Association evaluation, National Electrical Manufacturers Association NU-2 2012, Q. clear, VPHD
INTRODUCTION
Positron emission tomography/computed tomography (PET/CT) has been assimilated as one of the most important diagnostic modalities in cancer imaging.[1]
Since the first PET/CT system became operational in 1998,[2,3] PET detector and electronics technology have advanced significantly in last several years and several developments have taken place in hardware and software of the system. Various reconstruction algorithms have applied several reconstruction parameters such as point spread function (PSF) and time of flight (TOF) to improve the quality of image and its quantification accuracy. The use of fast-decaying lutetium oxyorthosilicate/lutetium yttrium oxyorthosilicate (LYSO) crystals,[4] which permit the use of shorter coincidence timing windows, are mandatory to introduce the TOF technology.[5,6,7] Hence, TOF technology cannot be implemented in the PET system consisting of bismuth germanate (BGO) crystal. PSF technology, responsible for improved resolution, is being used in most of the reconstruction technology available these days. The expansion of axial field-of-view (FOV) of PET system increases the volume sensitivity and slice sensitivity of a PET scanner.[8,9,10] Sensitivity of PET system is important to achieve good counting statistics for acceptable signal to noise ratio for image reconstruction. The PET component of the Discovery image quality (IQ) PET/CT system (GE Medical Systems, Milwaukie, USA) achieves maximum sensitivity and has utilized newly developed iterative reconstruction for better image reconstruction. Conventionally, whole-body PET examinations are time-consuming and it takes up to 20–25 min to finish each scan which makes it inconvenient for patient and sometimes introduces patient motion artefact as well as reduces the throughput of the machine. This PET system has largest axial FOV, hence, it is able to perform scans faster and minimize the probability of motion-based artefacts and increase the throughput of the system. An improvised iterative reconstruction algorithms based on Bayesian penalized-likelihood reconstruction algorithm, Q. Clear has been utilized in this system to improve the contrast recovery and lesion detectability. The evaluation of PET system requires standard and reliable methods to allow the comparison of different PET systems using accepted measurement standards for the system. The National Electrical Manufacturers Association (NEMA) has published a series of procedures to evaluate the physical performance of PET systems, i.e., NEMA NU-2 performance tests.[11,12] This NEMA standard is revised periodically, and the latest update of this publication resulted in the NEMA NU2-2012 standard published in February 2013.[12]
DIQ PET/CTs system was installed in October 2014 in our hospital for clinical use. Acceptance testing of any medical system is of utmost importance, and it is required by our regulators, i.e., Atomic Energy Regulatory Board for licensing of the PET/CT system. The purpose of this work was to evaluate the physical performance of the DIQ PET/CT system according to the NEMA NU 2-2012 standards.[12] Furthermore, the clinical PET IQ was compared for two reconstruction techniques available in this system. Finally, the results of these measurements were compared with published values from its predecessor, the earlier BGO-based PET/CT system.[6]
METHODS
Discovery image quality positron emission tomography/computed tomography system
In our work, a new DIQ PET/CT system (GE Medical System USA, Inc.,) was evaluated during the acceptance testing. This system has the highest sensitivity achieved ever by any PET system,[13,14,15] reducing the time of whole-body acquisition. This system has a 16-slice CT system (Optima 520, GE Medical system, USA) combined in the same gantry in front of the PET system. PET component of this system uses BGO scintillation crystal with five detector rings. Ring diameter of the system is 740 mm, each ring consisting of 288 detector blocks and each block has an array of 8 × 8 crystal matrix of (crystal dimension 6.3 mm × 6.3 mm × 30 mm). Each detector block has 20 photomultiplier tubes (PMTs). Altogether there are 720 PMTs are available in this system. This configuration provides an axial FOV of 26 mm, which results in 79 imaging planes with slice thickness of 3.27 mm. A LightBurst technology has been used in this system by implementing simultaneous Dual Acquisition Channels for every gamma-ray detected. Dual Acquisition Channels technology reduces the dead time losses from event pileups at high count rates that can create inaccuracies in the collected data.[16] This system is capable of list mode acquisition and reconstructs the image by using two different iterative reconstruction techniques, i.e., VUE Point HD (VPHD) Sharp IR and Q. Clear reconstruction algorithm.[15] The gantry bore is 70 cm which provides ample space for patient scanning. The default energy window is 435–650 keV and the coincidence window is 9.5 ns.
National Electrical Manufacturers Association NU 2-2012 measurements
All measurements were performed twice at our site after installation of two DIQ systems first in October 2014 and second in January 2016.
Spatial resolution
As per the recommendation of the NEMA NU-2 2012 protocol for PET System,[12] an 18F-fluorodeoxyglucose (18F-FDG) point source (size <1 mm × 1 mm × 1 mm) was prepared inside a 50-mm long glass capillary tube (Hirschmann Laborgeräte, Hämatokrit-Kapillaren, REF 9100160) with an inner diameter of 1.0 mm and a wall thickness of 0.4 mm. The total activity was low enough to keep dead time losses and randoms below 5% of the total events, as suggested by the NEMA NU2-2012.[12]
Initially, the activity of the point source in capillary was 0.32 MBq. Acquisitions were performed at three different transaxial locations(x, y): (0,1), (0,10), and (0,20) and at two axial positions (z) within the PET FOV: At center and three-eighth off-center of axial FOV. One minute acquisition was performed at each position. The acquired data were reconstructed with ordered-subsets expectation maximization (OSEM) reconstruction technique into a 256 × 256 matrix with 1 mm × 1 mm pixel size. No corrections and filtering were applied pre- or post-image reconstruction. The full width at half maximum (FWHM) and the full width at tenth maximum (FWTM) were obtained for all the acquired positions following the NEMA NU2-2012 protocol using the available software in the PET system.
Sensitivity
A polyethylene tube of inner diameter 1 mm, outer diameter 3 mm of 700 mm long supplied with NEMA phantom, (Data Spectrum Inc., Durham, NC, USA), was used. The tube was filled with 2.5 MBq of FDG and placed inside of five concentric aluminum sleeves of the same length with increasing diameters mentioned in Table 1.[12] Polyethylene tube inside the thinnest aluminum sleeve was placed at the center of transaxial FOV, coinciding the middle of the sleeve with axial center of the PET scanner. The measurement was performed for each aluminum sleeve by putting one over the other for 300 s for each acquisition at the center of the FOV. The same measurement was also performed at 10-cm radial offset on Y-axis. Online random subtraction was applied for all the measurements. The random and decay corrected true coincidence count rate was recorded as a function of aluminum sleeve thickness. The true coincidence count rate was then extrapolated to a zero thickness sleeve. The system sensitivity was then computed as the ratio between the observed true count rate without absorber material (i.e., 0 thickness of sleeve) and the starting activity. The data were analyzed as per the NEMA NU2-2012 protocol using software available in the system.
Table 1.
Dimension of the National Electrical Manufactures Association Positron Emission Tomographs sensitivity phantom
| Tube | Inner diameter (mm) | Outer diameter (mm) | Thickness (mm) | Length (mm) |
|---|---|---|---|---|
| Tube 1 | 3.9 | 6.4 | 2.5 | 700 |
| Tube 2 | 7.0 | 9.5 | 2.5 | 700 |
| Tube 3 | 10.2 | 12.7 | 2.5 | 700 |
| Tube 4 | 13.4 | 15.9 | 2.5 | 700 |
| Tube 5 | 16.6 | 19.1 | 2.5 | 700 |
| Plastic tube | 1 | 3 | 2 | 800 |
Scatter fraction and count rate performance
The 70-cm-long polyethylene cylinder with a diameter of 20 cm (Data Spectrum Inc., Durham, NC) was used for both the measurements. A polyethylene tube with internal diameter 2 mm and external diameter 4 mm was filled with an initial activity of 1.04 GBq of 18F to prepare line source and inserted axially into the cylinder 4.5 cm radially from the center. The said initial activity was used, to achieve count rates above the expected peak of the noise equivalent count rate (NECR) of the system.[11,12] Data acquisition was performed for 18 h with the frame rate of 15 min per frame followed by 60 min per frame. After the completion of the test, data are used to determine the scatter fraction and NECR as per the NEMA NU2-2012 standard for PET system without intrinsic random[11,12] by using available software tools with the system provided by the manufacturer. System true event rate, random event rate, single event rate, scatter event rate, scatter fraction and peck NECR, and the activity concentration at the peck NECR are reported.
Accuracy of count losses and random corrections
The data acquisition performed for the evaluation of the scatter fraction and count rate performance was used for evaluation of the accuracy of count loss and random correction also. The data were reconstructed by using whole-body reconstruction algorithm and corrected for dead time, attenuation, scatter, and random according to the NEMA NU2-2012 standard by using available software tools with the system provided by the manufacturer.
Image quality
A NEMA IQ (Data Spectrum Inc., Durham, NC) phantom has internal capacity of 9.7 L and containing six spherical inserts with internal diameters of 10, 13, 17, 22, 28, and 37. A cylindrical lung insert with an external diameter of 5 cm is positioned in the center of the phantom. The lung insert is filled with a low-density material with an average density of 0.3 g/ml. Lung insert is used to provide a nonuniform attenuation distribution in the phantom. This phantom was filled one fourth with water, 37.1 MBq of 18F-FDG was dissolved and this water solution was used to fill the four smaller spheres to create a target-to-background ratio of 4:1, two larger spheres were filled with water and water is inserted in the phantom to fill it completely. Water in the phantom was mixed well to make homogenous solution and bubbles were removed carefully. Cylindrical scatter phantom was also prepared by inserting the filled polyethylene tube with 100 MBq 18F-FDG activity in it. The NEMA IQ phantom was positioned with all spheres aligned within the same transaxial plane in the center of the axial FOV. The cylindrical phantom was also placed behind the IQ phantom outside the scanner FOV to simulate a clinical scanning with activity outside the axial FOV. The image acquisition was performed as prescribed NEMA NU2-2012 for single-bed position by using NEMA IQ acquisition protocol for 180s subsequent to a CT transmission scan (tube voltage: 120 kVp, current: 200 mA, matrix: 512 × 512 with 1.25-mm pixel size, and pitch: 1.25 mm) for attenuation correction.
Acquired data were reconstructed by using VPHD Sharp IR and Q. Clear reconstruction algorithm by applying normalization and corrections for random coincidences, scatter, dead time losses, and attenuation.
Total two image sets were reconstructed, and IQ was evaluated as per NEMA NU2-2012 standards by using software provided by manufacturer and contrast recovery for hot and cold sphere background variability and lung error residual mean were calculated and compared with the specification provided by the manufacturer for all four image sets. Contrast recovery, background variability, and lung error residual mean were also compared among all image sets.
Clinical image
Two patients one male and one female underwent routine whole-body PET/CT scan after 60 min of ~220 MBq 18F-FDG administrations. Scan parameter was used as per our departmental protocol for whole-body PET/CT scan. PET scan parameters-acquisition time: 3 min per bed position bed overlap of 23% matrix size 192 × 192; CT scan parameters-tube voltage: 120 kVp, current: 200 mA, matrix: 512 × 512 with 3.75 mm slice thickness, pitch: 3.75 mm. Acquired data were reconstructed by using VPHD Sharp IR and Q. Clear. Images were evaluated quantitatively by comparing standardized uptake value (SUV) obtained by two image reconstruction technique for the same lesion and qualitatively by visual assessment by two imaging experts.
RESULTS
Spatial resolution
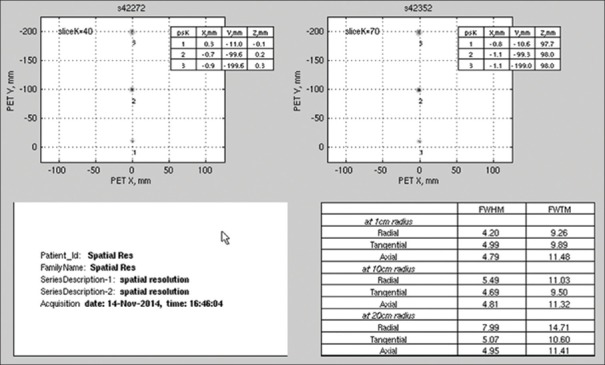
The transverse and axial resolutions for the different positions of the point source are summarized in Table 2 that details FWHM and FWTM values at 1 cm off-center (Radial-4.20, 9.26; Tangential-4.99, 9.89; Axial-4.79, 11.48), 10 cm off-center (Radial-5.49, 11.03; Tangential-4.69, 9.50; Axial - 4.81, 11.32), and 20 cm off-center (Radial-7.99, 14.71; Tangential-5.07, 10.60; Axial-4.95, 11.41) [Figure 1].
Table 2.
Spatial resolution of discovery image quality positron emission tomographs system at 1 cm, 10 cm, and 20 cm radius
| At 1 cm radius |
At 10 cm radius |
At 20 cm radius |
||||
|---|---|---|---|---|---|---|
| FWHM (mm) | FWTM (mm) | FWHM (mm) | FWTM (mm) | FWHM (mm) | FWTM (mm) | |
| Radial direction | 4.20 | 9.26 | 5.49 | 11.03 | 7.99 | 14.71 |
| Tangential direction | 4.99 | 9.89 | 4.69 | 9.50 | 5.07 | 10.60 |
| Axial direction | 4.79 | 11.48 | 4.61 | 11.32 | 4.95 | 11.41 |
FWHM: Full width at half maximum; FWTM: Full width at tenth maximum
Figure 1.
The National Electrical Manufacturers Association spatial resolution test result performed on discovery image quality positron emission tomography/computed tomography scanner
Sensitivity
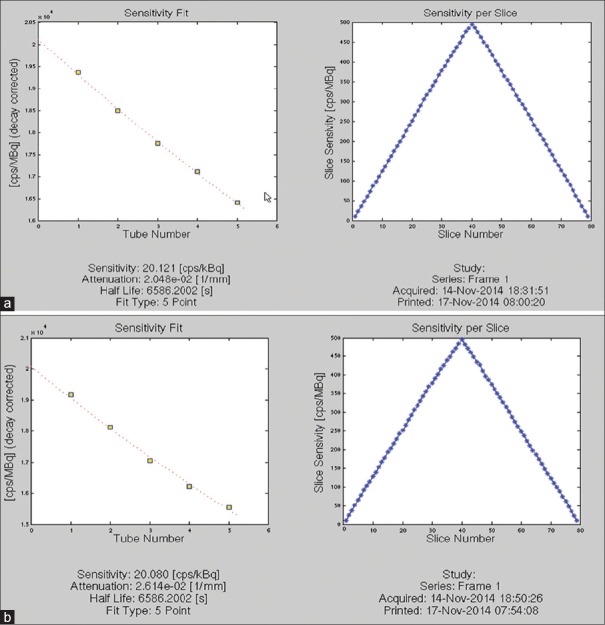
The DIQ PET system was able to achieve sensitivity of 20.080 cps/KBq for center and 20.121 cps/KBq 10 cm off-center positions. The axial sensitivity profiles with the line source placed at the center of the FOV and 10 cm radial offset are shown in Figure 2.
Figure 2.
The National Electrical Manufactures Association sensitivity test result performed on discovery image quality positron emission tomography/computed tomography scanner: (a) sensitivity at 0 cm off center; (b) sensitivity at 10 cm off center
Scatter fraction and count rate performance
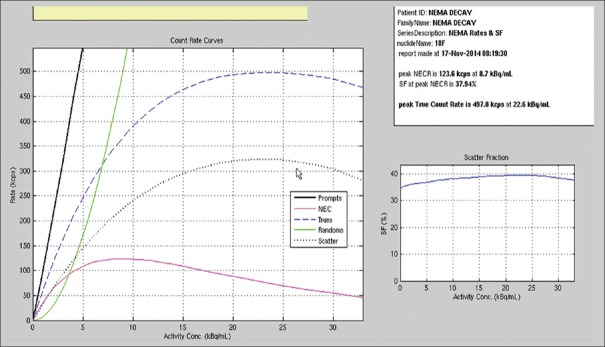
The peak NECR was 123.6 kcps at 8.7 kBq/ml. The scatter fraction was calculated to be 37.94% on the last 3 frames of the acquired image to keep the randoms to prompt ratio at a minimum.[17] Plots of the trues, randoms, and scatter event rates, as well as the NECR and the scatter fraction curves as a function of activity, are shown in Figure 3.
Figure 3.
The National Electrical Manufactures Association scatter fraction and noise equivalent count rate test result performed on discovery image quality positron emission tomography/computed tomography scanner
Count rate accuracy
The relative count rate error at the activity concentration below the NECR peak (8.75 kBq/ml) was 3.74%. The maximum and minimum errors for all activity concentrations are depicted in Figure 3.
Image quality phantom (hot spheres at the center of the axial field-of-view)
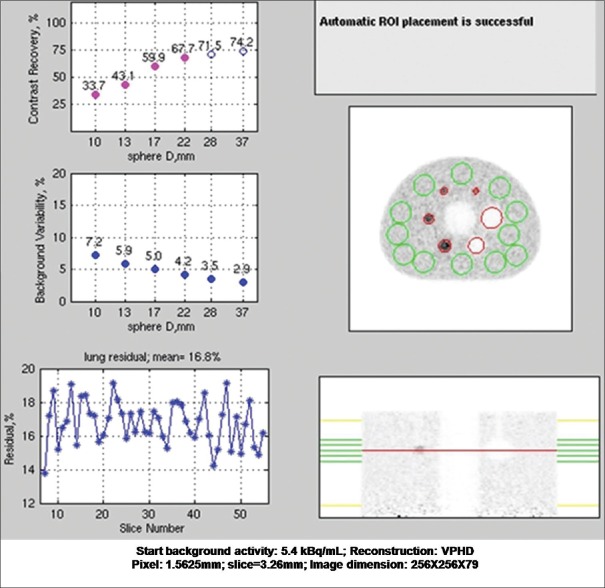
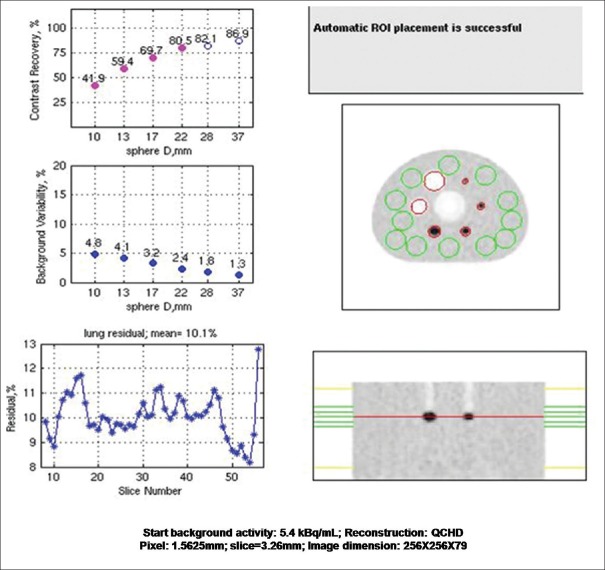
The contrast recovery values for hot and cold spheres were found to be above the prescribed value for VPHD as well as Q. Clear reconstructed images on this system. Results are summarized in Table 3 with the prescribed value. Lung variation is also mentioned in the table. The graph of lung error residual mean is depicted in Figures 4 and 5 for VPHD and Q. Clear reconstruction, respectively.
Table 3.
The National Electrical Manufactures Association Image quality test result, i.e., contrast recovery, background variability, and percentage relative lung error for the images reconstructed by VPHD and Q. Clear reconstruction technique
| Image quality | Hot sphere |
Cold sphere |
||||
|---|---|---|---|---|---|---|
| 10 mm | 13 mm | 17 mm | 22 mm | 28 mm | 37 mm | |
| The percentage contrast for each hot sphere | ||||||
| Prescribed limits | (>30) | (>40) | (>50) | (>60) | (>60) | (>60) |
| VPHD | 33.7 | 43.1 | 59.9 | 67.7 | 71.5 | 74.2 |
| Q. Clear | 41.9 | 59.4 | 69.7 | 85 | 82.1 | 88.9 |
| The percentage background variability | ||||||
| Prescribed limits | (<12) | (<10) | (<9) | (<7) | (<6) | (<5) |
| VPHD | 5.7 | 4.7 | 3.7 | 2.8 | 2.2 | 1.8 |
| Q. Clear | 4.8 | 4.1 | 3.2 | 2.4 | 1.8 | 1.3 |
| Accuracy of attenuation and scatter corrections | ||||||
| Prescribed limits | (<5.5) | |||||
| VPHD | 3.74 | |||||
| Q. Clear | ||||||
| Percentage relative error for each slice in lung slice | ||||||
| Prescribed limits | (19) | |||||
| VPHD | 16.8 | |||||
| Q. Clear | 10.1 | |||||
| Radioactivity concentration in KBq/mL | 5.3 KBq/mL | |||||
Figure 4.
The National Electrical Manufactures Association image quality test result with VPHD reconstruction technique performed on discovery image quality positron emission tomography/computed tomography scanner
Figure 5.
The National Electrical Manufactures Association image quality test result with QCHD reconstruction technique on discovery image quality positron emission tomography/computed tomography scanner
Clinical studies
Two patients (one male and one female age 74 and 52 years, weight 61 and 57 kg) were imaged on the DIQ PET and data were reconstructed by using VPHD Sharp IR and Q. Clear reconstruction techniques. The comparison of SUV calculated between the two images sets are listed in Table 4. Although there was the difference in SUV of the same lesion for the two image sets, there was very little visual difference in overall PET IQ as observed by two experienced imaging experts [Figure 6]. Images of set 1 were slightly noisy in comparison with that of set 2 for the same time of the scan.
Table 4.
Comparison of SUVmax obtained from the images reconstructed by PHD and Q. Clear reconstruction algorithm for three lesions for patient 1 and 2
| Reconstruction | SUVmax (g/ml) |
|||
|---|---|---|---|---|
| Background liver | Lesion 1 | Lesion 2 | Lesion 3 | |
| Patient 1 | ||||
| VPHD | 2.42 | 16.68 | 7.23 | 10.7 |
| Q.Clear | 2.36 | 27.71 | 12.18 | 15.86 |
| Patient 2 | ||||
| VPHD | 2.42 | 16.68 | 7.23 | 10.7 |
| Q.Clear | 2.36 | 27.71 | 12.18 | 15.86 |
SUVmax: Maximum standardized uptake value; VPHD: VUE Point HD
Figure 6.
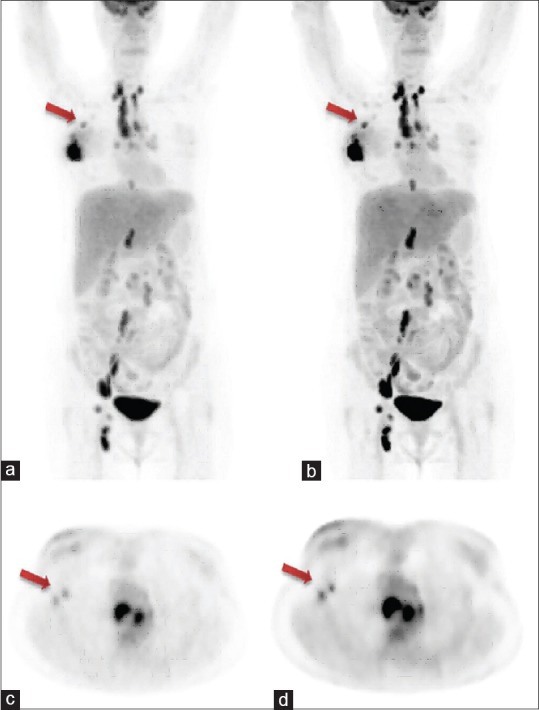
Whole-body clinical positron emission tomography images acquired after 60 min post administration of 220 MBq of 18F-fluorodeoxyglucose on discovery image quality 5-ring positron emission tomography/computed tomography system; (a) maximum intensity projection image obtained by VPHD reconstruction technique, arrow shows metastatic axillary lymph node; (b) maximum intensity projection image obtained by Q. Clear reconstruction technique, arrow shows metastatic axillary lymph node (better lesion delineation); (c) transaxial image of the same patient obtained by VPHD reconstruction technique, arrow shows two metastatic auxiliary nodes; (d) transaxial image of the same patient obtained by Q. Clear reconstruction technique, arrow shows two metastatic auxiliary nodes (better lesion delineation)
DISCUSSION
DIQ PET/CT, by GE medical system, is a high sensitivity PET scanner coupled with state-of-the-art Optima 540 16-slice CT scanner. PET part of this scanner utilizes BGO scintillation crystal for detection of 511 KeV gamma emission from the positron emitters. BGO is a high atomic number and high-density scintillation material.[2,18] Due to the high atomic number of bismuth (83) and its high density, BGO is a very efficient γ-ray absorber in the energy range of 511 KeV. The high photofraction and 8–10 photons/keVγ light yield of this crystal and scintillation emission of peak wavelength of 480 nm suitable to photocathode of PMT for electron emission increases sensitivity of this detector.[18,19] Although the primary dead time of BGO crystal is more, 300 ns, which results in low NECR,[13,14,14,15,17,18,19] this ultimately limits the use of this crystal for high count rate PET imaging. This system has used LightBurst detector technology to improve the count rate and NECR. LightBurst detector technology uses Dual Acquisition Channels. Dual Acquisition Channels were designed by creating powerful gate array technology that can perform simultaneous parallel processing of events without much interference between the overlapping pulses reducing the dead time loss because of pulse pileups resulting in fewer count loss, higher sensitivity, and better IQ. Q. Temp feature of LightBurst detector technology compensates in real-time change in detector temperature by adjusting amplifier's gain accordingly to adjust the gamma-ray energy peak. This feature also improves the sensitivity of the system. The peak NECR of this system is 123.6 kcps achieved at activity concentration of 8.7 KBq/ml which is almost one-third of activity concentration at which Peak NECR is achieved in LYSO systems. This scanner includes a dual energy acquisition channel technology that reduces dead time losses and pileup at high count rates and provides a high-sensitivity response and reduces the impact of dead time to some extent.[14,17] This system performs well in the majority of clinical scanning performed worldwide in oncological imaging because scans performed in oncology are low count rate imaging be it F-18-based scanning, C-11-based imaging or Ga-68-based imaging. The reported sensitivity of BGO PET/CT Discovery STE scanner, GE medical systems is 6.2 cps/kBq, and for LYSO PET/CT Gemini TF16, Philips Medical system is 7.2 cps/kBq.[19,20] The sensitivity of this system has been achieved as high as 26 cps/kBq by Kajisako et al. and 25.22 cps/kBq by Morzenti et al.[13,14] We achieved 20.1 cps/kBq system sensitivity, which is several times higher than any other reported value of sensitivity in the literature for non-TOF and TOF system. This increased sensitivity can be attributed to many changes and improvement made in this system for the earlier existing BGO PET system. The most important factors which have significantly improved the sensitivity of DIQ PET system are increased axial dimension of detector, i.e., 260 mm and reduced transaxial diameter of the detector ring, i.e., 700 mm. In addition to that, PET detectors are coupled with a light guide to guide the incident light into the high-sensitivity rectangular PMT efficiently. PMT architecture further improves sensitivity by reducing the dead space of PMT crystal interface.
Where increasing the axial length of the detector has increased the sensitivity of the system it has also increased the contribution of scatter in the acquired data. An improvised algorithm has been developed to calculate the scatter fraction accurately which is reflected in the contrast recovery of the system which is comparable to the TOF system.
The Q. Clear iterative reconstruction technique recently introduced by GE healthcare in DIQ PET system has further improved the contrast recovery of PET imaging.[14,18] Iterative reconstruction introduces noise in the reconstructed image, and noise contribution in the image increases with every iteration; hence, number of iterations is purposely kept low in iterative reconstruction techniques such as OSEM or Maximum Likelihood Expectation Maximization. However, Q. Clear reconstruction technique is able to perform multiple iterations by controlling the reconstruction noise by implementing a penalty term β during reconstruction. The quality of reconstructed image is optimized by applying the suitable value of β during the reconstruction. Q. Clear uses Penalized likelihood reconstruction algorithms which has been introduced by Geman S et al. and is in existence since 1987,[17] their clinical use had so far been limited. This technique has introduced a penalty function which acts as a noise suppression term during the iterations.[17,20,21] Q. Clear algorithm has improvised and implemented a relatively different penalty function.[17] This penalty is a function of the difference between neighboring voxels and a function of their sum.[17,18,19,20,21,22] This penalty is controlled by a penalization factor (termed β), which is the only user-input variable to the algorithm. Penalizing factor β = 350, prescribed by vendor is used in our study for image reconstruction by Q. Clear algorithm. The contrast recovery, background Variability, and lung error calculated for hot and cold spheres using Q. Clear as well as VPHD Sharp IR reconstruction techniques. Contrast recovery for hot as well as cold spheres were much higher in Q. Clear reconstructed images in comparison with VPHD images and background variability and lung error were much lesser in Q. Clear reconstructed image in comparison with VPHD images, which shows the improvement in IQ by Q. Clear reconstruction technique. All NEMA IQ parameters obtained from Q. Clear image in our study found to be even better than the earlier value published from our institution for TOF and Non-TOF systems by Jha et al. and Sharma et al.[23,24] Clinical images reconstructed by Q. Clear technique were found to be superior qualitatively on visual parameters and quantitatively have more SUVmax for the same lesion in comparison with image reconstructed by VPHD for the same patient. Reynés-Llompart et al. have also reported the similar findings in his study for phantom as well as clinical studies.[25] Because of increased axial FOV and high sensitivity of the system, imaging of a patient is less time consuming, and a whole-body PET/CT acquisition may complete much faster in comparison of existing PET/CT scanner.
CONCLUSIONS
The NEMA performance parameters obtained for the DIQ PET System are in concordance with the specification provided with the system. This system was able to show high sensitivity, and contrast recovery was remarkably improved with the use of Q clear reconstruction in comparison with VPHD sharp IR reconstruction algorithm.
Financial support and sponsorship
Nil.
Conflicts of interest
There are no conflicts of interest.
REFERENCES
- 1.Pauwels EK, Coumou AW, Kostkiewicz M, Kairemo K. [18 F] fluoro-2-deoxy-d-glucose positron emission tomography/computed tomography imaging in oncology: Initial staging and evaluation of cancer therapy. Med Princ Pract. 2013;22:427–37. doi: 10.1159/000346303. [DOI] [PMC free article] [PubMed] [Google Scholar]
- 2.Townsend DW. Combined positron emission tomography-computed tomography: The historical perspective. Semin Ultrasound CT MR. 2008;29:232–5. doi: 10.1053/j.sult.2008.05.006. [DOI] [PMC free article] [PubMed] [Google Scholar]
- 3.Beyer T, Townsend DW, Brun T, Kinahan PE, Charron M, Roddy R, et al. Acombined PET/CT scanner for clinical oncology. J Nucl Med. 2000;41:1369–79. [PubMed] [Google Scholar]
- 4.Panin VY, Kehren F, Michel C, Casey M. Fully 3-D PET reconstruction with system matrix derived from point source measurements. IEEE Trans Med Imaging. 2006;25:907–21. doi: 10.1109/tmi.2006.876171. [DOI] [PubMed] [Google Scholar]
- 5.Melcher CL. Scintillation crystals for PET. J Nucl Med. 2000;41:1051–5. [PubMed] [Google Scholar]
- 6.Surti S, Kuhn A, Werner ME, Perkins AE, Kolthammer J, Karp JS. Performance of Philips Gemini TF PET/CT scanner with special consideration for its time-of-flight imaging capabilities. J Nucl Med. 2007;48:471–80. [PubMed] [Google Scholar]
- 7.Karp JS, Surti S, Daube-Witherspoon ME, Muehllehner G. Benefit of time-of-flight in PET: Experimental and clinical results. J Nucl Med. 2008;49:462–70. doi: 10.2967/jnumed.107.044834. [DOI] [PMC free article] [PubMed] [Google Scholar]
- 8.Jakoby BW, Bercier Y, Conti M, Casey ME, Bendriem B, Townsend DW, et al. Physical and clinical performance of the mCT time-of-flight PET/CT scanner. Phys Med Biol. 2011;56:2375–89. doi: 10.1088/0031-9155/56/8/004. [DOI] [PubMed] [Google Scholar]
- 9.Moses W. Time of flight in PET revisited. IEEE Trans Nucl Sci. 2003;50:1325–30. [Google Scholar]
- 10.Zanzonico P. Positron emission tomography: A review of basic principles, scanner design and performance, and current systems. Semin Nucl Med. 2004;34:87–111. doi: 10.1053/j.semnuclmed.2003.12.002. [DOI] [PubMed] [Google Scholar]
- 11.NEMA Standards Publication NU 2-2007. Rosslyn, USA: National Electrical Manufacturers Association; 2007. National Electrical Manufacturers Association. Performance Measurements of Positron Emission Tomographs. [Google Scholar]
- 12.NEMA Standards Publication NU 2-2012. Rosslyn, USA: National Electrical Manufacturers Association; 2012. National Electrical Manufacturers Association. Performance Measurements of Positron Emission Tomographs. [Google Scholar]
- 13.Kajisako M, Kawase S, Mitsumoto K, Tatsuno K, Higashimura K, Nakamoto1 Y, et al. Performance evaluation of the Bayesian Penalized Likelihood Reconstruction Algorithm Q. Clear on BGO PET/CT system, according to NEMA NU2-2012 standard. J Nucl Med. 2016;57(Suppl 2):2627. [Google Scholar]
- 14.Morzenti S, De Ponti E, Guerra L, Zorz A, Landoni C, Crivellaro C, et al. Performance evaluation of the discovery IQ-GE PET/CT scanner according to NEMA NU2-2012 standard. J Nucl Med. 2015;56(Suppl 3):1846. [Google Scholar]
- 15.Jha A, Mithun S, Singh A, Purandare N, Shah S, Agrawal A, et al. NEMA NU-2 2012 performance evaluation of discovery IQ: A high sensitivity PET system. J Nucl Med. 2015;56(Suppl 3):1847. [Google Scholar]
- 16.Romanov LV, Holtermann PF, McDaniel DL, Widen JI. Design of a Data Acquisition System to Reduce Count Rate Losses in a PET Scanner, Nuclear Science Symposium and Medical Imaging Conference (NSS/MIC) 2013 IEEE. 2013:1–5. [Google Scholar]
- 17.Geman S, McClure DE. Statistical methods for tomographic image reconstruction. Bull Int Stat Inst. 1987;52:5–21. [Google Scholar]
- 18.Teoh EJ, McGowan DR, Macpherson RE, Bradley KM, Gleeson FV. Phantom and clinical evaluation of the Bayesian penalized likelihood reconstruction algorithm Q. Clear on an LYSO PET/CT system. J Nucl Med. 2015;56:1447–52. doi: 10.2967/jnumed.115.159301. [DOI] [PMC free article] [PubMed] [Google Scholar]
- 19.Phunpueok CA, Chewpraditkul W, Thongpool V, Aphairaj D. Comparison of Photofraction for LuYAP: Ce, LYSO: Ce and BGO Crystals in Gamma Ray Detection. The 15th International Conference of International Academy of Physical Sciences; Pathumthani, Thailand. 2012. [Google Scholar]
- 20.Bismuth Germanate Scintillation Material. [Last accessed on 2017 Jan 23]. Available from: http://www.crystals.saint.gobain.com/sites/imdf.crystals.com/files/documents/bgo.material.data.sheet_69763.pdf .
- 21.Grant AM, Levin CS. Optical delay encoding for fast timing and detector signal multiplexing in PET. Med Phys. 2015;42:4526–35. doi: 10.1118/1.4923176. [DOI] [PMC free article] [PubMed] [Google Scholar]
- 22.Alenius S, Ruotsalainen U. Bayesian image reconstruction for emission tomography based on median root prior. Eur J Nucl Med. 1997;24:258–65. doi: 10.1007/BF01728761. [DOI] [PubMed] [Google Scholar]
- 23.Sharma SD, Prasad R, Shetye B, Rangarajan V, Deshpande D, Shrivastava SK, et al. Whole-body PET acceptance test in 2D and 3D using NEMA NU 2-2001 protocol. J Med Phys. 2007;32:150–5. doi: 10.4103/0971-6203.37479. [DOI] [PMC free article] [PubMed] [Google Scholar]
- 24.Jha AK, Mithun S, Singh AM, Purandare NC, Shah S, Agrawal A, et al. 18-month performance assessment of Gemini TF 16 PET/CT system in a high-volume department. J Nucl Med Technol. 2016;44:36–41. doi: 10.2967/jnmt.115.168492. [DOI] [PubMed] [Google Scholar]
- 25.Reynés-Llompart G, Gámez-Cenzano C, Romero-Zayas I, Rodríguez-Bel L, Vercher-Conejero JL, Martí-Climent JM, et al. Performance characteristics of the whole-body discovery IQ PET/CT system. J Nucl Med. 2017;58:1155–61. doi: 10.2967/jnumed.116.185561. [DOI] [PubMed] [Google Scholar]


