Abstract
Background
We used the Surveillance, Epidemiology, and End Results (SEER) database to develop and validate deep survival neural network machine learning (ML) algorithms to predict survival following a spino-pelvic chondrosarcoma diagnosis.
Methods
The SEER 18 registries were used to apply the Risk Estimate Distance Survival Neural Network (RED_SNN) in the model. Our model was evaluated at each time window with receiver operating characteristic curves and areas under the curves (AUCs), as was the concordance index (c-index).
Results
The subjects (n = 1088) were separated into training (80%, n = 870) and test sets (20%, n = 218). The training data were randomly sorted into training and validation sets using 5-fold cross validation. The median c-index of the five validation sets was 0.84 (95% confidence interval 0.79–0.87). The median AUC of the five validation subsets was 0.84. This model was evaluated with the previously separated test set. The c-index was 0.82 and the mean AUC of the 30 different time windows was 0.85 (standard deviation 0.02). According to the estimated survival probability (by 62 months), we divided the test group into five subgroups. The survival curves of the subgroups showed statistically significant separation (p < 0.001).
Conclusions
This study is the first to analyze population-level data using artificial neural network ML algorithms for the role and outcomes of surgical resection and radiation therapy in spino-pelvic chondrosarcoma.
Keywords: Artificial intelligence, Chondrosarcoma, Neural network, Prediction, Survival
Introduction
The Surveillance, Epidemiology, and End Results (SEER) database has been queried in a series of reports to analyze all primary malignant tumors of the osseous spine, including chondrosarcoma [1–4]. The SEER registry has been collecting cancer-related information since 1973, and it represents 28% of the total U.S. population today, serving as the only population-based comprehensive data source, including stage of cancer, treatment modality and survival data [5]. However, most of previous studies included in the SEER database have either included only a basic demographic description or have excluded patients with incomplete data in multivariable analysis [6–8].
Machine learning (ML) provides the opportunity to analyze heterogeneous and complex data due to the greater capability to identify unintuitive patterns in large patient datasets [9]. Several ML algorithms have been applied in clinical medicine to predict disease, and they have shown a higher accuracy in diagnosis when compared to classical methods [10]. ML models have been expected to be useful for small datasets typical of rare pathologies such as primary bone tumor and showed the good discrimination and performance on decision analysis [11].
In the present study, we hypothesized that applying ML techniques may be equally valuable in other clinical areas, such as in identifying the prognostic factors in spinal and pelvic chondrosarcoma. We seek to develop and validate recurrent neural network ML algorithms to precisely predict survival following a diagnosis of chondrosarcoma using a national database.
Methods
Data collection
The SEER database is a longitudinal database that collects information from 17 population-based cancer registries (http://seer.cancer.gov/). Serial registry data are de-identified and submitted to the United States National Cancer Institute on a biannual basis to make available to researchers. The primary data in the SEER database includes the following variables: age at diagnosis, gender, race, primary site and size of tumor, histology, grade of tumor, stage of tumor, surgical treatment, radiation and chemotherapy, and overall survival (OS) in months. The original data set has 193 variables. (https://seer.cancer.gov/data-software/documentation/seerstat/nov2016/).
In this study, patients with chondrosarcoma diagnosed from 1973 to 2014 were selected using the Histologic International Classification of Diseases for Oncology, Third Edition (ICD-O-3), codes 9220–9243. The sites of presentation were compiled according to ICD-O-3 topography codes and were grouped into vertebral and pelvic sites in a fashion similar to that in previous studies [6, 8]. The extent of tumor was reclassified based on SEER EOD (Extent of Disease) and CS (Collaborative Stage) into three groups: ‘confined’ (defined as tumor encasement within the periosteum), ‘locally invasive’ (beyond the periosteum without distant involvement), and ‘distant’. Cases only with an autopsy/death certificate were excluded due to the unknown survival periods. As the SEER database uses publicly available data without personal identifiers, an approval from Institutional review board and/or informed consent are not required.
Study data preparation
The fourteen input variables for the study include sex, ethnicity (white, black, Hispanic, or other), age at diagnosis, marital status, primary site (spine and pelvis), tumor size, histologic type, grade, laterality, SEER historic stage, surgery, radical resection, radiation, chemotherapy, and total number of in situ/malignant tumors for the patient. The patient’s age at diagnosis was grouped into 3 categorical variables with intervals of 30 years. The tumor size was divided into two groups (> 8 or ≤ 8 cm) according to the T stage classification for bone tumors determined by the American Joint Committee on Cancer. The age, grade, tumor size, and number of tumors were used as discrete ordinal values. The other variables were considered to be categorical. All subjects (n = 1088) were separated into a training set (80%, n = 870) and a test set (20%, n = 218). The training data were randomly sorted into the training set and validation set using 5-fold cross validation (Fig. 1). This step was repeated to optimize the hyperparameters. Adjusting the hyperparameters, the median values of the c-index among the five tests were evaluated to find the optimal hyperparameters (number of learning epochs, risk value, and time window). After the optimization step, the final algorithm was retrained with the whole training set and evaluated with the test set. After separating the training and test sets, the missing values of the input variables were imputed using the k-nearest neighbor algorithm and transformed using Standard Scaler.
Fig. 1.
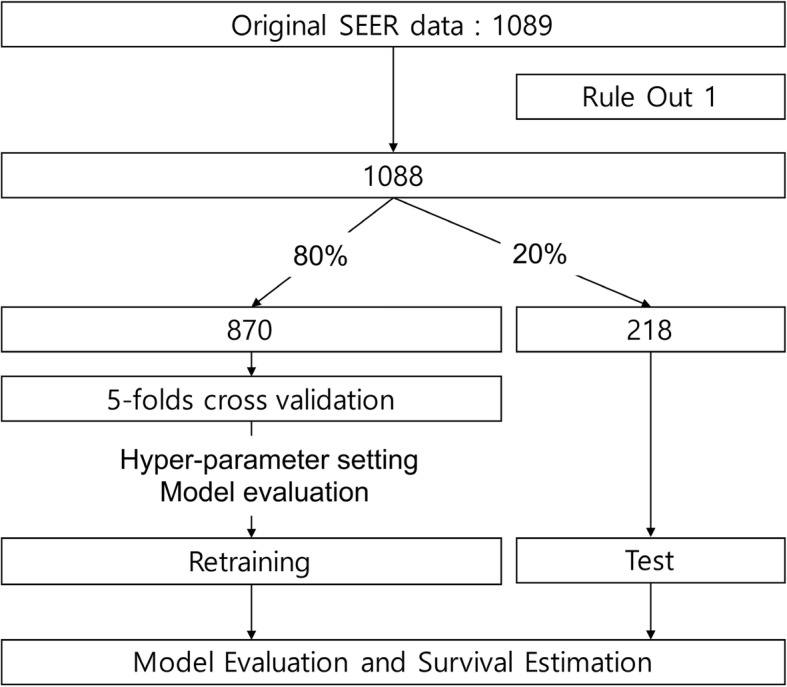
Enrolled Study Population and Pipeline of Data Analysis. The training data were validated using 5-fold cross validation
Risk estimate distance survival neural network (RED_SNN)
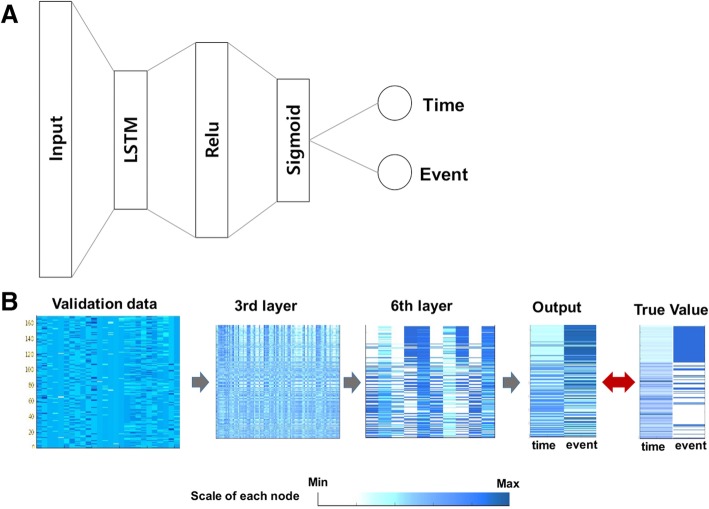
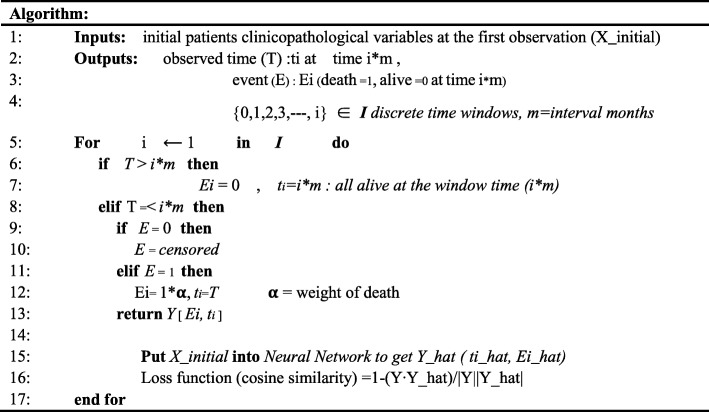
The key point of this model is that the event and time should be located in different dimensions, and the neural network learns these two targets at the same time using a multimodal algorithm (Fig. 2, Table 1, Additional file 1: Figure S1 and Additional file 2: Table S1). The event is defined as a binary value (survive = 0 or death = 1) in the time window period, which requires a logistic model. Time is the total follow-up period of each patient defined as a continuous variable (month), which requires a regression model. Our multimodal algorithm enables learning those two different characters by estimating the risk estimate distance (RED). In the time window period, subjects were located in the time dimension and the survival dimension. In the survival dimension, the event cases will have a risk score (α) that can be specified by the severity of each cancer. In this vector space, RED is defined as the cosine distance between survival and death in a certain time window. Thus, RED is higher in cases of earlier death, which represents a higher risk.
Fig. 2.
The architecture of the basic learning unit of the RED_SNN model. (a) The network architecture of the basic unit was composed of 8 layers, including two long short term memory (LSTM) layers. The input layer was comprised of 28 nodes that represented 26 input features and 2 latent survival features. The output layer was composed of 2 nodes implementing linear function, representing time and event. Since the two target nodes have different characteristics, we did not use the softmax function. The other layers were composed of fully-connected nodes implementing a rectified linear unit function. (b) The validation data (n = 169) were inputted to the pre-trained network. The number of nodes was gradually reduced across the hidden layers. The output time and event were compared to the true target values
Table 1.
Algorithm of risk estimate distance survival neural network
X_initial is observed variables of each patients at the first visit. Targets include time and event. Time target (T) is a continuous variable representing follow-up months
m is the time window or the interval time, which is a tunable hyper-parameter (In this study, the interval time was 10 month)
ti is the last observed time during the time interval i
Survival target (E) is a binary value representing event (alive: 0, death: 1). Ei is a binary event during the time interval i. The neural network is trained with the targets Y[Ei, ti] recurrently at each time point i using cosine distance as a loss function. (훂 is a hyperparameter representing weight of death.) For example, E1 = 0 at the first time window could be E2 = 0, 1, or censored at the second window, thus the neural network should adjust their parameter to the following targets. After their serial training, the network learned to perceive severity of the cancer patient
The parameter of the model (θ) should be inferred using the cosine proximity loss function () as follows (Xi: features of i-th subject, n: subjects).
Y_hat (timei, eventi) = g (θ; Xi), {1, 2, …i} ∈ n
where Y_hat is the estimated outputs, Y is the observed time and event.
In the next time period, some patients will die (new event) and some will be lost (censored), thus the observed time and event will change in the next time window. The algorithm is trained serially with the different target value at each time window, and the model parameter (θ) will be gradually adjusted to the time serial targets. (In this algorithm, we did not consider the change in the features (X) at each time window because our algorithm is designed to estimate the prognosis with the first status of the patients.) The algorithm was trained using backpropagation and was optimized using RMSProp at every two months (time window (m) = 2) with a single epoch and risk score (α) = 10.
Model evaluation and statistical analysis
The present study was developed and written according to transparent reporting of a multivariable-prediction model for individual prognosis or diagnosis model development guidelines. Patient outcomes were measured based on OS, the period (in months) between diagnosis and death or loss of follow-up from any cause, as reported in the SEER database. The performance of our prediction model was evaluated at each time window with the receiver operating characteristic (ROC) curves and areas under the curves (AUCs). Using the last follow-up information, the concordance index (c-index) of the model was also evaluated. The AUCs and c-indexes were compared between the groups using the Mann-Whitney test. The calibration curves were estimated by comparing the mean probability of the predicted survival with the actual survival proportion using Kaplan-Meier estimates after subgrouping of the test group into seven equally numerous subsets.
In the test group, the SEER historic stage and the subgroups classified by the predicted survival probability were compared using Kaplan-Meier curves. Each curve was compared to the neighboring curves using the log-rank test. Comparisons between groups were considered to be statistically significant at p < 0.05. We used the Keras and Theano libraries to obtain the deep learning framework. Data preprocessing was performed using the scikit-learn library. Statistical analysis was performed with SPSS version 24.0 (SPSS Inc., Chicago, IL, USA).
Results
Patient demographics
The search identified 1089 patients with primary chondrosarcoma of the osseous spine and pelvis between 1973 and 2014. Only one case was excluded owing to an unknown survival period. Among the remaining 1088 patients, 62.0% were men and 86.2% were white (Table 2). The mean and median age of diagnosis were 51.7 and 52 years, respectively. The year of diagnosis was 2000 or later for 65.3% of cases.
Table 2.
Patient demographics, tumor characteristics, and treatment modality
| Characteristic | ||
|---|---|---|
| Age at diagnosis, yrs | Mean ± SD | 51.70 ± 18.81 |
| Median (range) | 52.00 (8–93) | |
| Age at diagnosis stratified, n (%) | 0–29 | |
| 30–59 | ||
| > 59 | ||
| Sex, n (%) | Male | 675 (62.0) |
| Female | 413 (38.0) | |
| Race, n (%) | White | 938 (86.2) |
| Black | 79 (7.3) | |
| Other (Asian) | 59 (5.4) | |
| Unknown | 12 (1.1) | |
| Primary site involved, n (%) | Vertebral column | 218 (20) |
| Pelvic bones, sacrum | 870 (80) | |
| Histology type | Chondrosarcoma, NOS | 948 (87.1) |
| Juxtacortical chondrosarcoma | 7 (0.6) | |
| Myxoid chondrosarcoma | 60 (5.5) | |
| Mesenchymal chondrosarcoma | 23 (2.1) | |
| Clear cell chondrosarcoma | 6 (0.6) | |
| Dedifferentiated chondrosarcoma | 44 (4.0) | |
| Grade | I | 300 |
| II | 397 | |
| III | 121 | |
| IV | 63 | |
| Unknown | 207 (19.0) | |
| Stage of the tumor | Localized | 411 (37.8) |
| Regional | 450 (41.4) | |
| Distant | 147 (13.5) | |
| Unknown | 80 (7.4) | |
| Surgery performed, n (%) | Yes | 818 (75.2) |
| No | 249 (22.9) | |
| Unknown | 21 (1.9) | |
| Radiation therapy (%) | Yes | 228 (21.0) |
| No | 848 (77.9) | |
| Unknown | 12 (1.1) | |
| Chemotherapy (%) | Yes | 139 (12.8) |
| No | 949 (87.2) | |
| Cause of death (%) | Tumor related | 333 (30.6) |
| Other | 223 (20.5) | |
| Censored | 532 (48.9) |
NOS not otherwise specified
Disease was histologically confirmed in 1061 patients (97.5%). In contrast, radiologic and clinical confirmation were performed in 27 patients (2.5%). Among the 1061 patients who received histologic confirmation, most were diagnosed with chondrosarcoma, not otherwise specified (87.1%). Among other histologic types, myxoid (5.5%), dedifferentiated (4.0%), and mesenchymal (2.1%) were common histologic variants. Regarding grade, 64.1% of cases were of low grade (grade I and II), 16.9% were high grade (grade III and VI), and 19.0% were of unknown tumor grade. The mean and median tumor size at the time of diagnosis were 96.6 mm (standard deviation 61.2 mm) and 88.0 mm, excluding 394 patients with unknown tumor size. The extent of the disease was known in 92.6% cases, with the majority presenting as regionally invasive disease (41.4%). The index site was the first malignant tumor; 868 patients had only the index tumor, while 220 patients had two or more tumors.
After diagnosis, 12.3% of patients received both surgery and radiation, 57.9% underwent surgery alone, and 9.0% underwent radiation alone, while 16.2% of patients received neither, and 4.5% had an unknown treatment regimen (Table 3). During follow-up, 556 patients died, and among these, disease-related deaths were confirmed in 333 cases. The survival analysis based on Kaplan-Meier curves revealed that the 5-year OS and disease specific survival for all patients were 55.4 and 69.2%, respectively. The median OS was 92 months.
Table 3.
Surgical and adjunctive treatment in 1088 patients with spinal and pelvic chondrosarcoma
| Surgery (n) | Radiation (n) | Chemotherapy | Number of patients |
|---|---|---|---|
| Yes (818) | No (673) | No | 622 |
| Yes | 51 | ||
| Yes (135) | No | 106 | |
| Yes | 29 | ||
| Unknown (10) | No | 9 | |
| Yes | 1 | ||
| No (249) | No (159) | No | 128 |
| Yes | 31 | ||
| Yes (88) | No | 64 | |
| Yes | 24 | ||
| Unknown (2) | No | 2 | |
| Unknown (21) | No (16) | No | 14 |
| Yes | 2 | ||
| Yes (5) | No | 4 | |
| Yes | 1 |
Training and validation of RED_SNN
We optimized the hyperparameters of our model at the risk value: 10, time window: 2 months, and 2 learning epochs. In this setting, the model is trained every two months for 62 months (30 times), with time-dependent target values within a single epoch. The same learning process is repeated with different batches in the second epoch. The median c-index of the five validation sets was 0.84 (95% confidence interval 0.79–0.87). The median AUC of the five validation subsets was 0.84 (Fig. 3a and b).
Fig. 3.
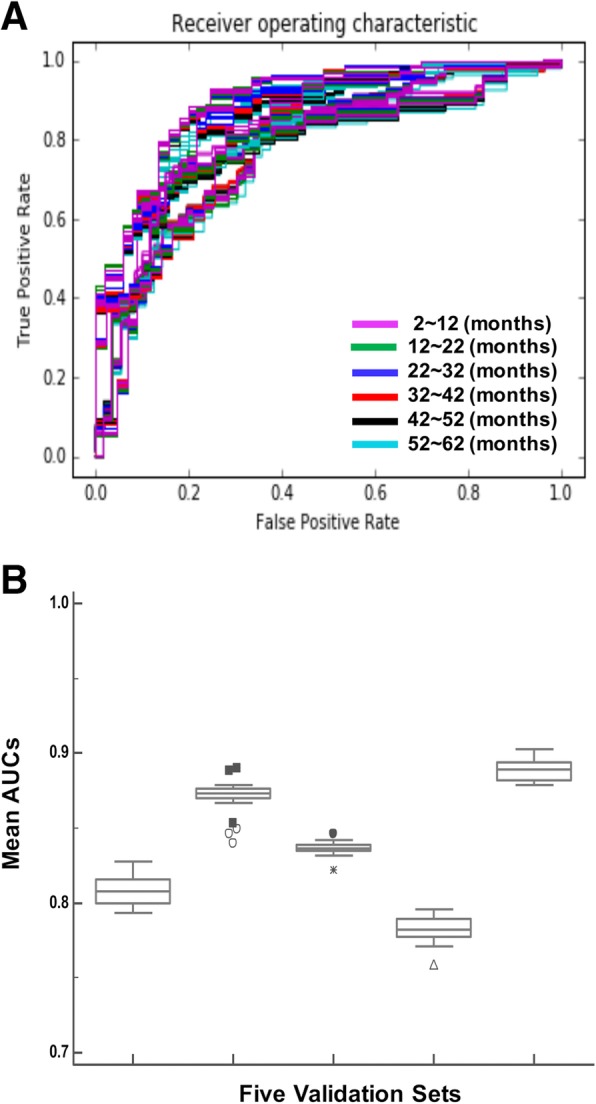
Optimization and validation of RED_SNN model using 5-fold cross validation. a ROC curves to evaluate the prediction accuracy of the RED_SNN model. The model was serially trained to learn patient’s survival status within a 10-month time interval, until 62 months from the initial observation. ROC curves predicting survival at each time interval were evaluated with validation sets. b The mean AUC’s of the survival prediction at each time point. The average AUC of 5-fold cross validation was 0.84
Performance evaluation of RED_SNN using test data set
The RED_SNN with fixed hyperparameters (risk value: 10, time window: 2 months, and two learning epochs) was finally trained with the total training set, and the final RED_SNN specified for spinal and pelvic chondrosarcoma was developed. All of fourteen input variables selected initially were applied in final model. This model was evaluated with a previously separated test set. The c-index was 0.82, and the mean AUC of the 30 different time windows was 0.85 (standard deviation 0.02). The calibration curve analysis showed that the predicted survival probability represented the actual survival proportion within a 10% margin of error (Fig. 4a and b).
Fig. 4.
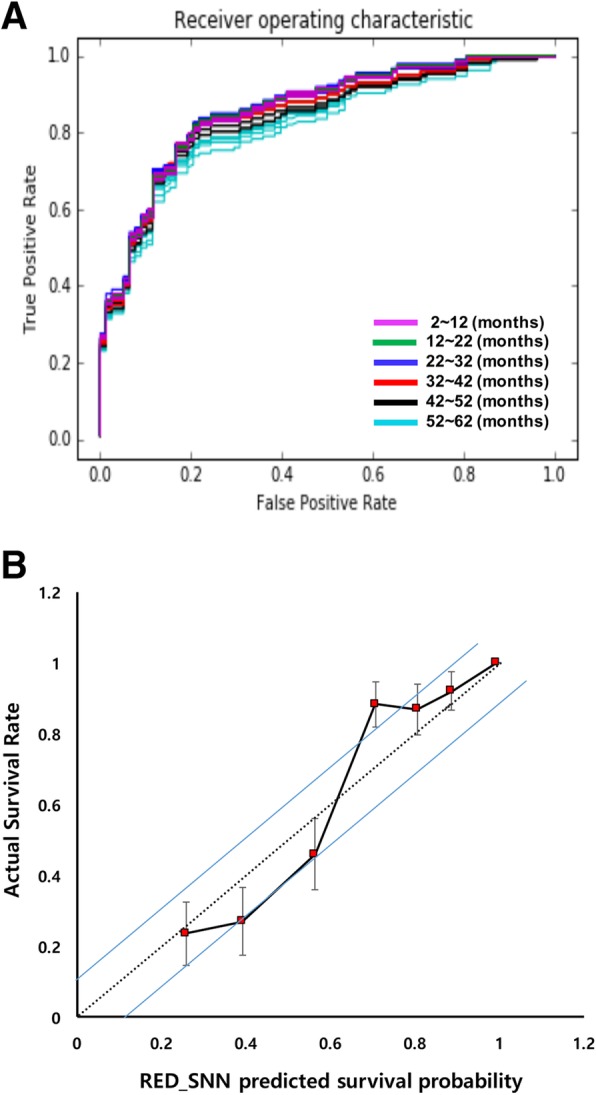
Performance evaluation of RED_SNN using test data set. a ROC curves to evaluate the prediction with test data set. The test data were analyzed by pre-trained RED_SNN and its output (expected survival probability) was compared to the real survival of the test set at each time point. b Calibration curves of RED_SNN model to predict the survival rate of the test set. The test data were analyzed using pre-trained RED_SNN, and the test patients were equally divided into seven subgroups according to the model’s predicted survival probability at five years
Prognostication according to estimated survival probability
With the test data set, Kaplan-Meier curves were generated according to the SEER historic stages (Fig. 5a). A clear separation of the survival curves was shown for the different stage groups identified using the survival tree method (log-rank test; p < 0.001). According to the estimated survival probability (by 62 months), we divided the test group into five subgroups. The first subgroup included patients with estimated survival probability greater than 96% (n = 19), and the second subgroup included patients with estimated survival probability between 78 and 95% (n = 64). Patients with estimated survival probability between 53 and 77% were in the third subgroup (n = 58), and patients with an estimated probability between 32 and 52% were in the fourth subgroup (n = 44). Patients with a survival probability less than 31% were in the fifth subgroup (n = 33). Kaplan-Meier curves were generated for each subgroup (Fig. 5b). All five different survival curves of the subgroups were clearly separated, with statistical significance (log-rank test; p < 0.001).
Fig. 5.
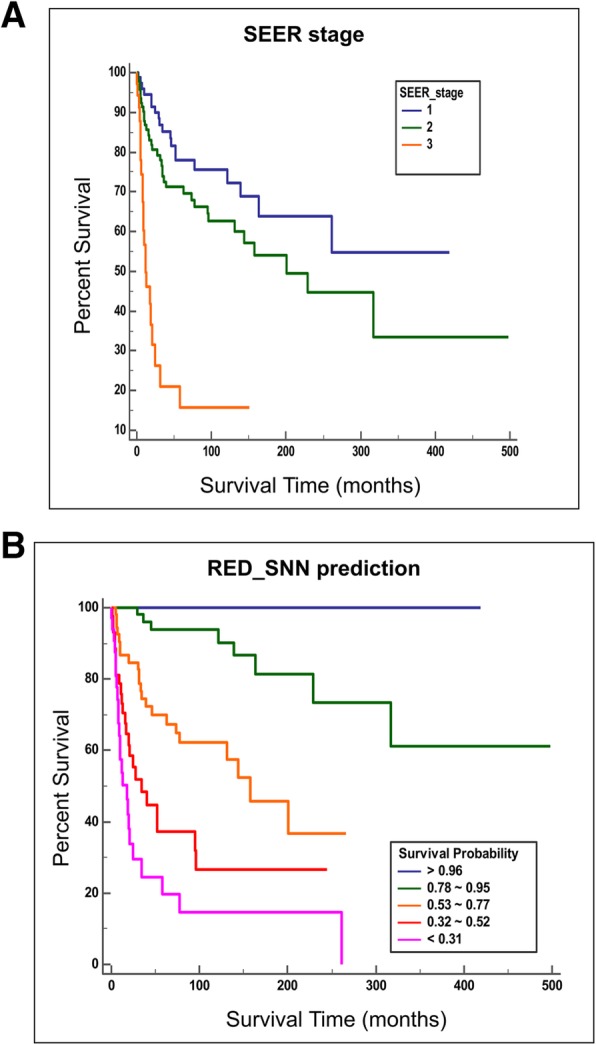
Kaplan Meier curves of subgroups according to SEER stage vs our model expected survival probability. a SEER stage identified three prognostic subgroups in Kaplan Meier survival analysis. b RED_SNN identified five prognostic subgroups in Kaplan Meier survival analysis
Discussion
Although chondrosarcoma is the third most common primary malignant bone tumor, the spine is a relatively rare site that presents a challenge for surgery due to the potential for local recurrence [12–18]. Moreover, in chondrosarcoma, there has been no precise classification or subgrouping according to the prognosis due to its low incidence. Prediction models for survival or other prognostic factors have been explored using conventional statistical methods. Multivariable logistic regression has been one of the most widely used methods to identify risk factors of events, such as complications or death in cancer research [9, 10].
ML techniques and SEER data in cancer research
Since cancer is associated with multidimensional factors, conventional linear statistical models have not shown reliable accuracy in predicting prognosis. To build non-linear statistical models, various ML techniques, including Bayesian networks (BNs), semi-supervised learning (SSL), support vector machines (SVMs), decision trees (DTs) and artificial neural networks (ANNs) have been widely applied to develop predictive models, resulting in accurate and powerful decision-making in cancer research. Zhou and Jiang [19] used DTs and ANNs in a survival analysis of patients with breast cancer. Delen et al. [20] compared logistic regression, DTs, and ANNs to predict breast cancer survivability. In addition, Endo et al. [21] compared seven methods in regard to prediction of 5-year survivability in diagnosed cases of breast cancer.
Due to the rarity of chondrosarcoma, only a few small case series of treatment outcomes have been reported over several decades at individual institutions [12, 13, 16, 17, 22–24]. The SEER database enables outcome analysis for a large number of patients based on attributes that are broadly classified as demographics (e.g., age, sex, location), therapeutic (e.g., surgical procedure, radiation therapy), and outcomes (e.g., survival period, cause of death). Previous investigations have analyzed survival period of patients from the SEER database based on demographics and prognostic determinants of primary osseous neoplasms of the spine. However, past works have not identified prognostic subgroups. In contrast, there is a great deal of published literature related to SEER data studies for other cancer types. Chen et al. and Fradkin used SEER database to analyze survival patterns in lung cancer [25, 26]. Fathy et al. studied colorectal cancer survival rate prediction in relation to the number of hidden layer in the ANN [27].
Adoption of ANN model
ANNs, in particular, may allow accurate performance in the presence of unreliability, including incomplete data or measurement errors. Moreover, ANN could detect and recognize complex non-linear relationships between the variables [28]. In this regard, ANNs are expected to improve the predictive value of the retrospective data analysis. One of the earliest works in survival analysis using ANN was introduced by Faraggi and Simon [29], who used ANN as a basis for a nonlinear proportional hazard model. In a predictive model developed to evaluate the survival of women with breast cancer [30], the authors compared three classification models using the SEER database. They found that the calculated accuracy rates for SSL, SVM, and ANNs were 71, 51, and 65%, respectively. Our previous study also revealed that the patients with gastric cancer could be more accurately classified according to survival outcome by using SRN than classical TNM staging [31].
In this study, we developed a novel algorithm specific to survival analysis, and the results indicate it offers better performance compared to those in other studies using both a conventional statistical model and an ML model. Our RED model showed mean AUC of 0.85. In the calibration curve (Fig. 4b), our model has a tendency to over-estimate the survival of patients with poor prognosis and a tendency to under-estimate those with good prognosis, which is similar to a conventional logistic prediction model. We identified eight subgroups with an approximate predictive power of 32 attributes. Perioperative identification of these subgroups should help prognosticate survival as well as assist in guiding treatment modality for patients with spinal and pelvic chondrosarcoma.
Yet, the development of model base on ANNs is empirical, and some methodological issues remain to be unresolved. However, implementing statistics based on artificial intelligence could produce valuable information and clinical relevance including disease staging, patient’s prognosis, survival prediction and treatment decision making for physicians in clinical practice and should deserve further attention.
Limitation and future direction
However, the present study has limitations. One of limitations is that variations in treatment strategies could not be accounted for, including radiation and chemotherapy and surgical strategies. Previous studies have shown that surgical techniques might have an impact on survival period, as chemotherapy regimens [18, 31–34]. Although chondrosarcoma examined in the study is resistant to chemotherapy, the SEER database does not contain detailed chemotherapy-related data. The SEER database also lacks information on surgical strategies including en-bloc and intralesional resection. Future multi-institutional studies may be warranted to determine the role of these variables as well that of advances in targeted radiotherapy and chemotherapy regimens, particularly in treating chondrosarcoma variants.
Secondly, artificial neural network has the ability to detect all possible interactions between variables. However it may act as a ‘black box’ and have limited ability to identify variables (or coefficient weights) used to create the models and possible causal relationships.
Lastly, the development and validation of the machines learning algorithms described in this study have not been externally validated in an independent physician-collected dataset or other registry such as the national Cancer Database (NCDB). As the model performance would be similar or much lower if an external dataset was used, the generalizability of the algorithm predictions remains to be determined, and future studies should seek to build on the findings presented here by examining prospectively collected registries.
Conclusions
RED_SNN is a valid method to predict survival for spinal and pelvic chondrosarcoma, and it appears to be comparable to other methods. RED_SNN may offer the advantage of increased sensitivity for predicting longer or shorter OS.
Supplementary information
Additional file 1: Figure S1. Experiments Networks (A) Final Network consists of Embedding Layer, LSTM Layer, 4 Fully Connected Layers. (B) Dropout0.3 Network adds Dropout Layer(0.3) between FC Layer and LSTM Layer on origin network. (C) Dropout0.5 Network adds Dropout Layer(0.5) between FC Layer and LSTM Layer on origin network. (D) Dropout0.7 Network adds Dropout Layer(0.7) between FC Layer and LSTM Layer on origin network. (E) Bignode network has randomly increased nodes in some Layers on the origin network.
Additional file 2: Table S1. 5-fold valid test accuracy about various networks.
Acknowledgments
The authors would like to thank Jisoo Gim for technical support.
Abbreviations
- ANNs
Artificial neural networks
- AUCs
Areas under the ROC curves
- BNs
Bayesian networks
- c-index
Concordance index
- DTs
Decision trees
- ML
Machine learning
- OS
Overall survival
- RED_SNN
Risk Estimate Distance Survival Neural Network
- ROC
Receiver operating characteristic
- SEER
The Surveillance, Epidemiology, and End Results
- SSL
Semi-supervised learning
- SVMs
Support vector machines
Authors’ contributions
SSW and LSH designed the experiments, supervised and revised the manuscript. RSM prepared the data set, carried out the experiments, and drafted the manuscript. SSW provided continuous feedback on the paper. All authors read and approved the manuscript.
Funding
This study was supported by Basic Science Research Program through the National Research Foundation of Korea (NRF) funded by the Ministry of Education and Science Technology (MEST) (2016R1E1A1A0191433) and partially supported by Samsung Medical Center grant, SMX1170501.
Availability of data and materials
The datasets analyzed during the current study are available on the Surveillance, Epidemiology, and End Results (SEER) Program (www.seer.cancer.gov). We used samples from Incidence - SEER 18 Regs Custom Data (with additional treatment fields), Nov 2016 Sub (1973–2014 varying). In order to access the research data a formal request must be made to the SEER program.
Ethics approval and consent to participate
The study did not require IRB by the Samsung Medical Center Human Subjects Institutional Review Board.
Consent for publication
Consent to publish is not applicable as human subjects were not recruited, and we used public and de-identified data from the webpage of the Surveillance, Epidemiology, and End Results Program.
Competing interests
The authors declare that they have no competing interests.
Footnotes
Publisher’s Note
Springer Nature remains neutral with regard to jurisdictional claims in published maps and institutional affiliations.
Sung Wook Seo and Sun-Ho Lee contributed equally to this work.
Contributor Information
Sung Wook Seo, Email: sungwseo@skku.edu.
Sun-Ho Lee, Email: sobotta72@gmail.com.
Supplementary information
Supplementary information accompanies this paper at 10.1186/s12911-019-1008-4.
References
- 1.McGirt MJ, Gokaslan ZL, Chaichana KL. Preoperative grading scale to predict survival in patients undergoing resection of malignant primary osseous spinal neoplasms. Spine J. 2011;11:190–196. doi: 10.1016/j.spinee.2011.01.013. [DOI] [PubMed] [Google Scholar]
- 2.Mukherjee D, Chaichana KL, Adogwa O, Gokaslan Z, Aaronson O, Cheng JS, et al. Association of extent of local tumor invasion and survival in patients with malignant primary osseous spinal neoplasms from the surveillance, epidemiology, and end results (SEER) database. World Neurosurg. 2011;76:580–585. doi: 10.1016/j.wneu.2011.05.016. [DOI] [PubMed] [Google Scholar]
- 3.Mukherjee D, Chaichana KL, Gokaslan ZL, Aaronson O, Cheng JS, McGirt MJ. Survival of patients with malignant primary osseous spinal neoplasms: results from the surveillance, epidemiology, and end results (SEER) database from 1973 to 2003. J Neurosurg Spine. 2011;14:143–150. doi: 10.3171/2010.10.SPINE10189. [DOI] [PubMed] [Google Scholar]
- 4.Mukherjee D, Chaichana KL, Parker SL, Gokaslan ZL, McGirt MJ. Association of surgical resection and survival in patients with malignant primary osseous spinal neoplasms from the surveillance, epidemiology, and end results (SEER) database. Eur Spine J. 2013;22:1375–1382. doi: 10.1007/s00586-012-2621-4. [DOI] [PMC free article] [PubMed] [Google Scholar]
- 5.Reni M, Gatta G, Mazza E, Vecht C. Ependymoma. Crit Rev Oncol Hematol. 2007;63:81–89. doi: 10.1016/j.critrevonc.2007.03.004. [DOI] [PubMed] [Google Scholar]
- 6.Giuffrida AY, Burgueno JE, Koniaris LG, Gutierrez JC, Duncan R, Scully SP. Chondrosarcoma in the United States (1973 to 2003): an analysis of 2890 cases from the SEER database. J Bone Joint Surg Am. 2009;91:1063–1072. doi: 10.2106/JBJS.H.00416. [DOI] [PubMed] [Google Scholar]
- 7.Nathoo N, Mendel E. The National Cancer Institute's SEER registry and primary malignant osseous spine tumors. World Neurosurg. 2011;76:531–532. doi: 10.1016/j.wneu.2011.06.043. [DOI] [PubMed] [Google Scholar]
- 8.Arshi A, Sharim J, Park DY, Park HY, Bernthal NM, Yazdanshenas H, et al. Chondrosarcoma of the Osseous Spine: An Analysis of Epidemiology, Patient Outcomes, and Prognostic Factors Using the SEER Registry From 1973 to 2012. Spine (Phila Pa 1976) 2017;42:644–652. doi: 10.1097/BRS.0000000000001870. [DOI] [PMC free article] [PubMed] [Google Scholar]
- 9.Obermeyer Z, Emanuel EJ. Predicting the future - big data, machine learning, and clinical medicine. N Engl J Med. 2016;375:1216–1219. doi: 10.1056/NEJMp1606181. [DOI] [PMC free article] [PubMed] [Google Scholar]
- 10.Cruz JA, Wishart DS. Applications of machine learning in cancer prediction and prognosis. Cancer Inform. 2007;2:59–77. [PMC free article] [PubMed] [Google Scholar]
- 11.Karhade AV, Thio Q, Ogink P, Kim J, Lozano-Calderon S, Raskin K, et al. Development of machine learning algorithms for prediction of 5-year spinal Chordoma survival. World Neurosurg. 2018;119:e842–e847. doi: 10.1016/j.wneu.2018.07.276. [DOI] [PubMed] [Google Scholar]
- 12.Bergh P, Gunterberg B, Meis-Kindblom JM, Kindblom LG. Prognostic factors and outcome of pelvic, sacral, and spinal chondrosarcomas: a center-based study of 69 cases. Cancer. 2001;91:1201–1212. doi: 10.1002/1097-0142(20010401)91:7<1201::AID-CNCR1120>3.0.CO;2-W. [DOI] [PubMed] [Google Scholar]
- 13.Boriani S, De Iure F, Bandiera S, Campanacci L, Biagini R, Di Fiore M, et al. Chondrosarcoma of the mobile spine: report on 22 cases. Spine (Phila Pa 1976) 2000;25:804–812. doi: 10.1097/00007632-200004010-00008. [DOI] [PubMed] [Google Scholar]
- 14.Gitelis S, Bertoni F, Picci P, Campanacci M. Chondrosarcoma of bone. The experience at the Istituto Ortopedico Rizzoli. J Bone Joint Surg Am. 1981;63:1248–1257. doi: 10.2106/00004623-198163080-00006. [DOI] [PubMed] [Google Scholar]
- 15.Henderson ED, Dahlin DC. Chondrosarcoma of bone--a study of two hundred and eighty-eight cases. J Bone Joint Surg Am. 1963;45:1450–1458. doi: 10.2106/00004623-196345070-00010. [DOI] [PubMed] [Google Scholar]
- 16.Schoenfeld AJ, Hornicek FJ, Pedlow FX, Kobayashi W, Raskin KA, Springfield D, et al. Chondrosarcoma of the mobile spine: a review of 21 cases treated at a single center. Spine (Phila Pa 1976) 2012;37:119–126. doi: 10.1097/BRS.0b013e31823d2143. [DOI] [PubMed] [Google Scholar]
- 17.Shives TC, McLeod RA, Unni KK, Schray MF. Chondrosarcoma of the spine. J Bone Joint Surg Am. 1989;71:1158–1165. doi: 10.2106/00004623-198971080-00006. [DOI] [PubMed] [Google Scholar]
- 18.Stuckey RM, Marco RA. Chondrosarcoma of the mobile spine and sacrum. Sarcoma. 2011;2011:274281. doi: 10.1155/2011/274281. [DOI] [PMC free article] [PubMed] [Google Scholar]
- 19.Zhou ZH, Jiang Y. Medical diagnosis with C4.5 Rule preceded by artificial neural network ensemble. IEEE Trans Inf Technol Biomed. 2003;7:37–42. doi: 10.1109/TITB.2003.808498. [DOI] [PubMed] [Google Scholar]
- 20.Delen D, Walker G, Kadam A. Predicting breast cancer survivability: a comparison of three data mining methods. Artif Intell Med. 2005;34:113–127. doi: 10.1016/j.artmed.2004.07.002. [DOI] [PubMed] [Google Scholar]
- 21.Endo A, Shibata T, Tanaka H. Comparison of seven algorithms to predict breast Cancer survival(<special issue>contribution to 21 century intelligent technologies and bioinformatics) Int J Biomedical Soft Computing Hum Sci. 2008;13:11–16. [Google Scholar]
- 22.Groves ML, Zadnik PL, Kaloostian P, Sui J, Goodwin CR, Wolinsky JP, et al. Epidemiologic, functional, and oncologic outcome analysis of spinal sarcomas treated surgically at a single institution over 10 years. Spine J. 2015;15:110–114. doi: 10.1016/j.spinee.2014.07.005. [DOI] [PubMed] [Google Scholar]
- 23.Hsieh PC, Xu R, Sciubba DM, McGirt MJ, Nelson C, Witham TF, et al. Long-term clinical outcomes following en bloc resections for sacral chordomas and chondrosarcomas: a series of twenty consecutive patients. Spine (Phila Pa 1976) 2009;34:2233–2239. doi: 10.1097/BRS.0b013e3181b61b90. [DOI] [PubMed] [Google Scholar]
- 24.Strike SA, McCarthy EF. Chondrosarcoma of the spine: a series of 16 cases and a review of the literature. Iowa Orthop J. 2011;31:154–159. [PMC free article] [PubMed] [Google Scholar]
- 25.Sgouros S, Malluci CL, Jackowski A. Spinal ependymomas--the value of postoperative radiotherapy for residual disease control. Br J Neurosurg. 1996;10:559–566. doi: 10.1080/02688699646862. [DOI] [PubMed] [Google Scholar]
- 26.Chen D, Xing K, Henson D, Sheng L, Schwartz AM, Cheng X. Developing prognostic systems of cancer patients by ensemble clustering. J Biomed Biotechnol. 2009;2009:632786. doi: 10.1155/2009/632786. [DOI] [PMC free article] [PubMed] [Google Scholar]
- 27.Pica A, Miller R, Villa S, Kadish SP, Anacak Y, Abusaris H, et al. The results of surgery, with or without radiotherapy, for primary spinal myxopapillary ependymoma: a retrospective study from the rare cancer network. Int J Radiat Oncol Biol Phys. 2009;74:1114–1120. doi: 10.1016/j.ijrobp.2008.09.034. [DOI] [PubMed] [Google Scholar]
- 28.Ravdin PM, Clark GM. A practical application of neural network analysis for predicting outcome of individual breast cancer patients. Breast Cancer Res Treat. 1992;22:285–293. doi: 10.1007/BF01840841. [DOI] [PubMed] [Google Scholar]
- 29.Faraggi D, Simon R. A neural network model for survival data. Stat Med. 1995;14:73–82. doi: 10.1002/sim.4780140108. [DOI] [PubMed] [Google Scholar]
- 30.Park Kanghee, Ali Amna, Kim Dokyoon, An Yeolwoo, Kim Minkoo, Shin Hyunjung. Robust predictive model for evaluating breast cancer survivability. Engineering Applications of Artificial Intelligence. 2013;26(9):2194–2205. doi: 10.1016/j.engappai.2013.06.013. [DOI] [Google Scholar]
- 31.Oh SE, Seo SW, Choi MG, Sohn TS, Bae JM, Kim S. Prediction of overall survival and novel classification of patients with gastric Cancer using the survival recurrent network. Ann Surg Oncol. 2018;25:1153–1159. doi: 10.1245/s10434-018-6343-7. [DOI] [PubMed] [Google Scholar]
- 32.Navid F, Willert JR, McCarville MB, Furman W, Watkins A, Roberts W, et al. Combination of gemcitabine and docetaxel in the treatment of children and young adults with refractory bone sarcoma. Cancer. 2008;113:419–425. doi: 10.1002/cncr.23586. [DOI] [PubMed] [Google Scholar]
- 33.Rao G, Suki D, Chakrabarti I, Feiz-Erfan I, Mody MG, McCutcheon IE, et al. Surgical management of primary and metastatic sarcoma of the mobile spine. J Neurosurg Spine. 2008;9:120–128. doi: 10.3171/SPI/2008/9/8/120. [DOI] [PubMed] [Google Scholar]
- 34.Wagner LM, McAllister N, Goldsby RE, Rausen AR, McNall-Knapp RY, McCarville MB, et al. Temozolomide and intravenous irinotecan for treatment of advanced Ewing sarcoma. Pediatr Blood Cancer. 2007;48:132–139. doi: 10.1002/pbc.20697. [DOI] [PubMed] [Google Scholar]
Associated Data
This section collects any data citations, data availability statements, or supplementary materials included in this article.
Supplementary Materials
Additional file 1: Figure S1. Experiments Networks (A) Final Network consists of Embedding Layer, LSTM Layer, 4 Fully Connected Layers. (B) Dropout0.3 Network adds Dropout Layer(0.3) between FC Layer and LSTM Layer on origin network. (C) Dropout0.5 Network adds Dropout Layer(0.5) between FC Layer and LSTM Layer on origin network. (D) Dropout0.7 Network adds Dropout Layer(0.7) between FC Layer and LSTM Layer on origin network. (E) Bignode network has randomly increased nodes in some Layers on the origin network.
Additional file 2: Table S1. 5-fold valid test accuracy about various networks.
Data Availability Statement
The datasets analyzed during the current study are available on the Surveillance, Epidemiology, and End Results (SEER) Program (www.seer.cancer.gov). We used samples from Incidence - SEER 18 Regs Custom Data (with additional treatment fields), Nov 2016 Sub (1973–2014 varying). In order to access the research data a formal request must be made to the SEER program.


