Abstract
Objectives:
This study was designed to evaluate a patient navigation program undertaken with our community partners in Chicago’s Chinatown. Inadvertently, the study collected data on two biannual mammography screening cycles that coincided almost exactly with implementation of the Affordable Care Act (ACA) in Illinois.
Methods:
The study uses claims data to profile mammography screening rates for residents of an 18 zip code, 398 census tract area on Chicago’s near south and southwest side. Patient addresses were geocoded from biannual (August 2011 to July 2103 and August 2103 to July 2015) Illinois Medicaid and Illinois Breast and Cervical Cancer Program (IBCCP) claims. Screening rates are presented separately for low-income women ages 40 to 49 and 50 to 64 years. We compare change between 16 tracts with greater than 20% Chinese ancestry, 85 tracts with 1% to 20% Chinese ancestry, and 297 tracts with less than 1% Chinese ancestry.
Results:
There were more than 65,000 low-income women age 40 to 64 in the study area (mammogram patients were 63% Black, 23% Hispanic, 10% White, 2.5% Asian, and 2.5% other/unknown race and ethnicity). The increase in screening was greatest in Chinatown, although mean rates were not significantly different across the three areas (p = .07).
Discussion:
Our results demonstrate large increases in mammography screening after ACA implementation in 2013–2014. The greatest increase occurred in the Chinatown patient navigation program area. The study provides a template for programs aimed at using public community-area data to evaluate programs for improving access to care and health equity.
Keywords: Epidemiological surveillance, mammography, breast cancer screening, Chinese, patient navigation, Affordable Care Act, program evaluation, healthcare quality, access, evaluation
One of the primary goals of the Chicago Cancer Health Equity Collaborative (ChicagoCHEC) is to provide feedback to low-income, underserved communities about access to cancer screening, and to measure efforts to improve screening and early detection. This goal is hindered by lack of screening use data at the community level. Most outpatient screening data are proprietary to specific office or hospital outpatient practices, and cannot be readily combined across intraoperative computer platforms. It is also known that self-reported screening rates, obtained through surveys, are often highly unreliable and inconsistent with actual use data.1,2 This article provides a description of one approach to community-level epidemiological surveillance, using public data, that can potentially be used across a variety of conditions to track success in improving access to cancer screening and other preventive services. The study uses geocoded mammography claims data, obtained from Illinois Medicaid and the IBCCP designed for the uninsured, to monitor screening rate change between 2011 and 2015 in low-income communities on the near south and southwest sides of Chicago.
The study grew out of an National Institutes of Health–funded study of using community health worker patient navigators to increase access to breast and cervical cancer screening in Chicago’s predominantly Chinese and Taiwanese Chinatown community.3–7 With a mostly low-income population, a high proportion of recent immigrants, and many residents with limited English proficiency, women in Chinatown face major obstacles to cancer screening and any needed follow-up care.8 In 2013, Northwestern University, in collaboration with Mercy Hospital & Medical Center (Mercy) and the Chinese American Service League (CASL), implemented a tailored patient navigation program in Chicago’s Greater Chinatown community. This study leveraged the resources of Mercy and CASL with their established footprint in the community, and their mission to educate women on the need for screening. Ideally, community patient navigators can educate and link women to the healthcare system.9,10 The Chinatown Patient Navigation Program was an adaptation of the national Patient Navigation Research Program.10 Adult women (age 21 and older) residing in Chicago’s Chinatown received patient navigation services through breast and cervical cancer screening, follow-up, and/or treatment.
CASL is the largest social service agency in Chinatown. CASL offers resources and programs in youth education and development, family counseling and social services, adult employment and training, elder services, housing, financial literacy, and citizenship and immigration. Mercy is the nearest medical center, located within the Greater Chinatown area. Mercy is a longstanding safety net hospital; it is the largest provider of screening mammograms and Pap tests for the state-funded IBCCP that provides eligible uninsured and underinsured women with free mammograms, Pap tests, and follow-up diagnostic screenings and services.
Chinatown Patient Navigation Program support included appointment scheduling, appointment reminders, facilitating communication between patients and care teams (including interpreter services), and identifying and reducing patient barriers (e.g., fear, lack of transportation, no insurance/underinsurance) through education, outreach, and referrals to community, local, and state resources.
To evaluate the success of these efforts, we proposed an evaluation plan that sought to compare change in screening rates in Chinatown, defined using census data on the proportion of Chinese living in specific census tracts. This study compared mammography screening rates between census tracts with high Chinese ancestry populations to adjacent, low-income, largely Black and Hispanic communities in 18 zip codes surrounding Mercy. This article highlights our findings on changes in mammography screening rates after the grant-funded navigation program began in 2013. In an originally unforeseen development, implementation of the ACA insurance expansion in Illinois in 2014 initiated a major increase in mammography screening throughout the study catchment area. Although we cannot untangle the effects of ACA Medicaid expansion from the effects of the navigation program, our results provide a template for using public data resources for epidemiological surveillance tailored to specific small area communities.
METHODS
Estimating the Low-Income Female Population Denominators in the Study Catchment Area
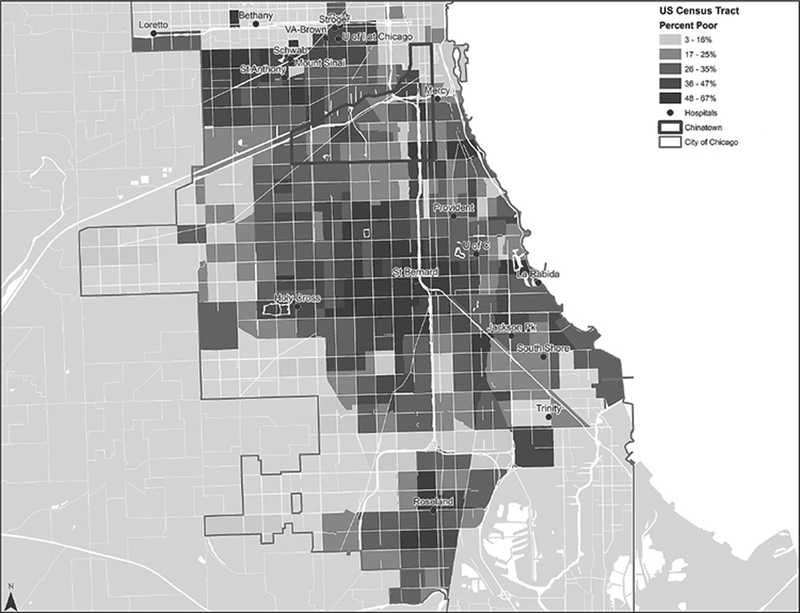
We first worked with our partners in CASL and Mercy to develop a study catchment area. We chose an area of 18 zip codes surrounding Mercy Hospital with overwhelmingly minority and low-income populations. More than 12% of area residents were noncitizens and 32% of census tracts had more than 35% of households living below the federal poverty level (Figure 1). The 18 zip codes encompassed 398 census tracts which each had approximately 2,500 to 8,000 residents. Data on census tract populations were obtained from the American Community Survey (ACS), which collects detailed information at the census tract level by surveying 1 in 38 households in each state each year.11 The ACS 2014 5-year rolling estimates reflect population averages at the approximate midpoint of the period (2011–2012). These census data were then used to determine the number of female low-income residents, defined as residents of households living at or below 150% of the Bureau of Labor Statistics federal poverty level. The total for low-income female residents ages 40 to 64, and thus eligible for mammography, was then used as the population denominator for computing census tract level Medicaid and IBCCP mammography screening rates for different community areas. Because national guidelines for mammography screening for women age 40 to 49 are inconsistent, we present separate screening rates for women ages 40 to 49 and 50 to 64. We use the less controversial mammography screening rate for women age 50 to 64 as the primary endpoint to compare changes in screening rate aggregated across the census tracts in the three study areas.
Figure 1. Quintiles of Census Tract Poverty Levels in the Study Catchment Area.
(N = 398 Chicago Census Tracts)
Working with maps developed by CASL, we used ACS data to identify census tracts with less than 1% (n = 297), 1% to 20% (n = 85), and more than 20% (n = 16) Chinese or Taiwanese descent residents. The 16 census tracts with the highest Chinese populations (Chinatown) would be the primary focus of Chinatown Patient Navigation Program efforts, with some spillover expected among tracts that were 1% to 20% Chinese. The remaining 297 tracts would constitute the control area (which included all or parts of the Armour Square, Bridgeport, Oakland, Douglas, and Fuller Park neighborhoods). The study was designed to measure differences in the mammography screening rate across two, 24-month mammography screening cycles, August 2011 to September 2013 (pre-intervention baseline) and August 2013 to September 2015 (the first 2 years of follow-up after initiating the navigation intervention).
When study investigators initially proposed this evaluation design, expecting to detect what hoped to be a significantly larger increase in screening in Chinatown as compared with control areas, we did not anticipate that our screening cycles would coincide almost exactly with the Illinois ACA insurance expansion. This process began slowly, with an initial Cook County waiver for early Medicaid expansion in 2013, followed by state-level implementation of Medicaid expansion and health insurance exchanges beginning in January 2014. We thus inadvertently designed the study to document the effects of ACA implementation on mammography screening across the entire catchment area.
Mammography Claims Data
We obtained all screening mammography CPT codes from the Illinois Department of Healthcare and Family Services Medicaid Data Warehouse for all patients from the 18 zip code study catchment area over the four year study period. In addition, we obtained IBCCP data for mammography screening for uninsured women from the Illinois Department of Public Health. Data from both sources included demographic information and patient street addresses. We geocoded patient addresses into each of the 398 census tracts. We used census data as the denominator and Medicaid and IBCCP screening claims as the numerator to compute screening rates per 100 low-income female residents for each two year screening cycle. We show the change between the 2011–2013 baseline and the 2013–2015 post-ACA follow-up period, by areas specified by Chinese population percents and for the entire catchment area.
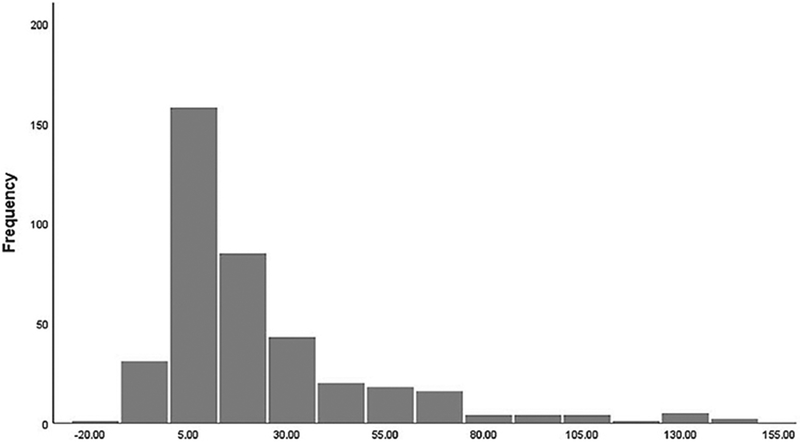
We used one-way analysis of variance to estimate the significance of tract level differences (which were normally distributed as shown in Figure 2) between screening cycles across the three areas defined by Chinese ancestry. We made tract-level mean change in the area rate per 100 low-income women age 50 to 64 as our primary comparative outcome. We based this on the mean area screening rate difference for the combined Medicaid and IBCCP rates per 100. We analyzed older women (age 50–64) only because there remains inconsistent guidelines about mammography screening for women age 40 to 49.12 We also used a t-test to make a direct comparison between mean screening rate change in just the 16 high Chinese population tracts that were the main focus of the patient navigation program and the 297 tracts that were outside the navigation program’s scope.
Figure 2. Histogram of Mean Change in Combined Medicaid and HFS Screening Mammography per 100 Low-Income Female Residents.
(N = 398 Chicago Census Tracts)
Analyses were done with IBM SPSS Version 24 (Armonk, NY) and ArcGIS Version 10.5 (Redlands, CA). The study was approved by both the Northwestern University and Illinois Department of Public Health Institutional Review Boards.
RESULTS
There was an estimated total of 29,749 female residents age 40 to 49 and 36,096 female residents age 50 to 64 living in low-income households in the study catchment area in 2012–2013. Medicaid and IBCCP screening mammogram patients were approximately 63% Black, 23% Hispanic, 10% White, 2.5% Asian, and 2.5% other or unknown race and ethnicity. Table 1 presents Medicaid and IBCCP mammography screening rates for both screening cycles for each community area. The table reports the tract mean and standard deviation in each cycle by Medicaid/IBCCP program and combined total rate of both programs. Data are presented for the total study catchment area and for each of the areas defined by Chinese ancestry.
Table 1.
Change in Screening Mammogram Rates per 100 Female Residents Age 40 to 64 Living in Households at less than 150% of the Poverty Level (N = 398 Census Tracts in Chicago’s Near South and Southwest Side)
| Mean (SD) Rate per 100 Baseline Cycle (8/2011–7/2013) | Mean (SD) Rate per 100 Follow-up Cycle (8/2013–7/2015) | Mean (SD) Change in Rate per 100 | |
|---|---|---|---|
| Study catchment area census tracts (N = 398) | |||
| All area Medicaid/age 40–49 | 21.2 (29.6) | 29.1 (38.0) | 7.8 (13.2) |
| All area Medicaid/age 50–64 | 15.8 (24.9) | 31.4 (31.8) | 15.5 (15.8) |
| All area IBCCP/free care age 40–49 | 10.8 (13.3) | 22.3 (35.5) | 11.9(22.3) |
| All area IBCCP/free care age 50–64 | 16.1 (19.2) | 22.8 (30.6) | 6.3 (24.1) |
| All area both programs/age 40–49 | 32.0 (35.2) | 51.9 (51.5) | 19.8 (25.5) |
| All area both programs age 50–64 | 31.1 (35.2) | 53.7 (53.0) | 21.8 (30.4) |
| < 1% Chinese ancestry census tracts (n = 297) | |||
| Medicaid <1% Chinese census tracts age 40–49 | 19.4 (13.6) | 27.4 (20.7) | 8.0 (11.7) |
| Medicaid <1% Chinese census tracts age 50–64 | 14.9 (12.4) | 30.4 (22.6) | 15.5 (14.9) |
| IBCCP/free care <1% Chinese census tracts age 40–49 | 8.8 (11.5) | 18.9 (27.6) | 10.1 (20.0) |
| IBCCP/free care <1% Chinese census tracts age 50–64 | 15.4 (19.4) | 20.1 (35.7) | 4.8 (23.3) |
| Both programs <1% Chinese census tracts age 40–49 | 28.2 (21.2) | 46.3 (37.6) | 18.1 (22.2) |
| Both programs <1% Chinese census tracts age 50–64 | 30.3 (27.1) | 50.5 (49.5) | 20.3 (29.4) |
| 1%–20% Chinese ancestry census tracts (n = 85) | |||
| Medicaid 1%–20% Chinese census tracts age 40–49 | 25.2 (58.3) | 32.3 (72.0) | 7.1 (17.9) |
| Medicaid 1%–20% Chinese census tracts age 50–64 | 20.0 (48.8) | 35.7 (54.1) | 15.7 (19.8) |
| IBCCP/free care 1%–20% Chinese census tracts age 40–49 | 14.1 (15.0) | 25.9 (29.2) | 11.9 (21.9) |
| IBCCP/free care 1%–20% Chinese census tracts age 50%–64 | 16.6 (19.4) | 25.7 (36.1) | 9.1 (27.1) |
| Both programs 1%–20% Chinese census tracts age 40–49 | 39.3 (62.0) | 58.2 (77.0) | 19.0 (27.6) |
| Both programs 1%–20% Chinese census tracts age 50–64 | 36.6 (53.6) | 61.4 (66.5) | 24.8 (34.4) |
| > 20% Chinese ancestry census tracts (n = 16) | |||
| Medicaid >20% Chinese census tracts age 40–49 | 34.2 (14.9) | 42.7 (22.8) | 8.6 (10.7) |
| Medicaid >20% Chinese census tracts age 50%–64 | 9.4 (3.5) | 26.3 (7.4) | 16.9 (7.7) |
| IBCCP/free care >20% Chinese census tracts age 40–49 | 31.7 (15.9) | 78.5 (38.1) | 46.8 (35.4) |
| IBCCP/free care >20% Chinese census tracts age 50–64 | 26.4 (11.1) | 45.7 (18.5) | 19.3 (16.1) |
| Both programs >20% Chinese census tracts age 40–49 | 65.9 (27.2) | 121.2 (57.9) | 55.4 (42.3) |
| Both programs >20% Chinese census tracts age 50–64 | 35.9 (11.3) | 72.0 (24.1) | 36.2 (21.7) |
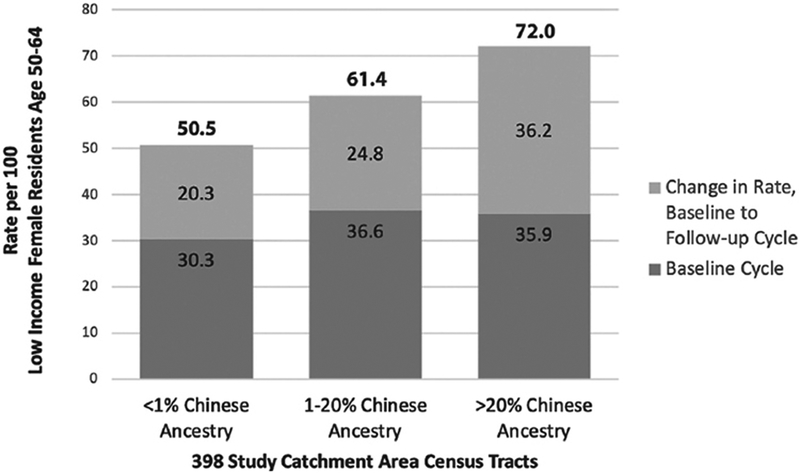
Of note, IBCCP baseline screening rates were about half as large as Medicaid rates for women ages 40 to 49 but actually greater for older women. IBCCP rates doubled for younger women in the follow-up period and increased 39% for older women; the Medicaid rates showed an opposite pattern, with a 37% increase for younger women and rates doubled for older women. The overall mean screening rate for the whole catchment area increased 62% for low-income women ages 40 to 49. The increase was 70% for low-income women ages 50 to 64, or an increase in the mean screening rate for low-income women, age 50 to 64, of 21.8 per 100 (standard deviation, 30.4). Figure 2 presents a histogram of that mean change for women age 50 to 64, with very few tracts experiencing a decline and most experiencing an increase. Figure 3 shows the increase in screening rate from baseline to follow-up cycle for the three Chinese ancestry populations.
Figure 3. Change in Mammography Screening Rates per 100 Women Age 50 to 64 by Census Tract Chinese Ancestry Populations.
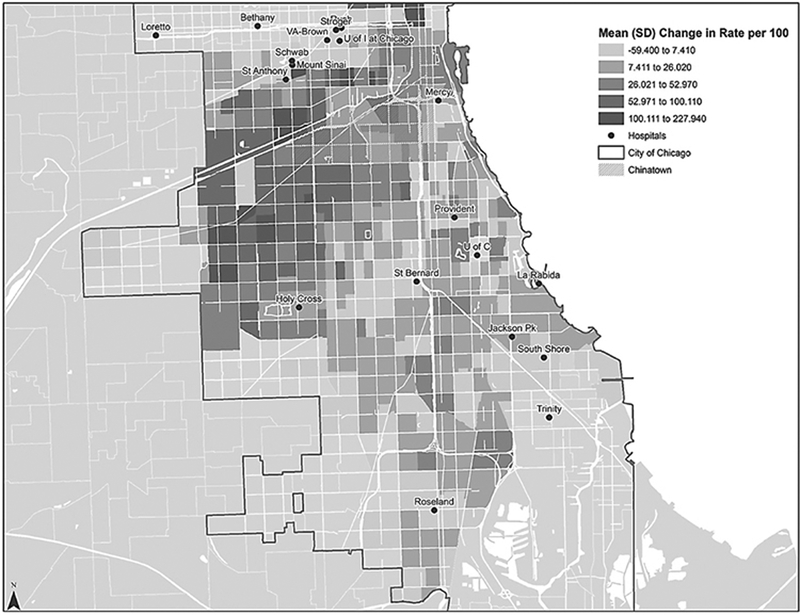
The post-ACA increase in the IBCCP and Medicaid combined screening rate for older women was greatest in the 16 tracts with the highest area Chinese populations, a mean increase of 36.2 per 100 as compared with a mean increase of 24.8 per 100 in the 1% to 20% Chinese tracts and a 20.3 per 100 increase in the less than 1% Chinese tracts. The mean total differences between areas were not significantly different (analysis of variance p = .07). After leaving out the 85 tracts with 1% to 20% Chinese ancestry, the direct t-test comparison between the 16 Chinatown tracts (>20% Chinese ancestry) and the 297 tracts with less than 1% Chinese ancestry was p = .03. Figure 4 provides a census tract map of combined Medicaid and IBCCP mean mammography screening rate changes across all 398 catchment area census tracts for all low-income women, ages 40 to 64.
Figure 4. Quintiles of Mean Change Between Two Biennial Periods in the Combined Medicaid and HFS Screening Mammography Rate Per 100 Low-Income Women Age 40 to 64.
(N = 398 Chicago census tracts).
DISCUSSION
ACA insurance expansion had a major effect on the communities in our study area. The mean annual public use micro area estimates on insurance coverage changes from the ACS for 2012–2013 versus 2014–2015 indicate that approximately 65,000 residents ages 18 to 64 living in the study catchment area gained insurance, with a greater than 55,000 person increase in Medicaid enrollment.13 Illinois insurance expansion would potentially have confounded measuring effects of a Chinatown patient navigation program. However, the study program may have been part of the reason that there was such a large increase in the primary Chinatown community screening rate for older women. Mammography screening rates increased significantly throughout the period in part owing to the efforts of the IBCCP to provide access to residents. The IBCCP endured a number of temporary funding restrictions throughout the study period, but seems to have had a major effect in increasing mammography screening, particularly for immigrants without health insurance.
This study was designed to produce the kind of local, micro area data that our community partners were most interested in. Our results are part of efforts by community health activists to identify which specific neighborhoods were most underserved. These data have the potential to also address screenings providers most frequently use, and how to insure quality services and access to care equity for preventive services.14 The study highlights the potential value of public data for evaluating the impact of public programs and our methods remain a viable option for future ChicagoCHEC community-based research on cancer control. We demonstrate that geocoded address data can be presented in a confidential format when geographic areas contain at least several dozen observations.5
LIMITATIONS AND CONCLUSION
Among a number of limitations, we should note that our results are confined to the areas’ low-income population. The rates shown here do not account for screening performed for privately insured individuals living in the area. Our findings do not address debates about mammography screening or the higher breast cancer mortality of minority patients in Chicago.15–18 We do not know if the greater increase in mammography screening in Chinatown was in fact related to the navigation program or unknown area differences in ACA insurance expansion.
In conclusion, we hope this article inspires health activists to emulate our methods and provide their communities with high quality and actionable epidemiologic monitoring. Going forward, ChicagoCHEC researchers will continue to use public data to inform new cancer prevention and control programs, as one method for academic collaborators to contribute to community health improvement projects.
ACKNOWLEDGMENTS
The authors thank our research partners Patricia Murphy (HFS), Kelly Vrablic, and Tara Sangster-Clark (IDPH) for data acquisition. We are also grateful to Dan Vicencio, MD (Mercy), and Esther Wong, MA (CASL), for guidance based on their community background and experience.
This work was supported by the National Institutes of Health (grants R01CA163830, R34MH100393, and U54CA203000).
REFERENCES
- 1.Holt K, Franks P, Meldrum S, Fiscella K. Mammography self-report and mammography claims. Racial, ethnic, and socioeconomic discrepancies among elderly women. Med Care. 2006:513–8. [DOI] [PubMed] [Google Scholar]
- 2.Rauscher GH, Johnson TP, Cho YI, Walk JA. Accuracy of self-reported cancer-screening histories: A meta-analysis. Cancer Epidemiol Prev Biomark. 2008;17(4):748–57. [DOI] [PubMed] [Google Scholar]
- 3.Jean-Pierre P, Cheng Y, Wells KJ, et al. Satisfaction with cancer care among underserved racial-ethnic minorities and lower-income patients receiving patient navigation. Cancer. 2016;122(7):1060–7. [DOI] [PMC free article] [PubMed] [Google Scholar]
- 4.Karliner LS, Kaplan C, Livaudais-Toman J, Kerlikowske K. Mammography facilities serving vulnerable women have longer follow-up times. Health Serv Res. 2019. February;54(Suppl. 1):226–33. [DOI] [PMC free article] [PubMed] [Google Scholar]
- 5.Krieger N, Chen JT, Waterman PD, Rehkopf DH, Subramanian S. Painting a truer picture of US socioeconomic and racial/ethnic health inequalities: The Public Health Disparities Geocoding Project. Am J Public Health. 2005;95(2):312–23. [DOI] [PMC free article] [PubMed] [Google Scholar]
- 6.Lee HY, Ju E, Vang PD, Lundquist M. Breast and cervical cancer screening disparity among Asian American women: Does race/ethnicity matter [corrected]? J Womens Health (Larchmt). 2010;19(10):1877–84. [DOI] [PubMed] [Google Scholar]
- 7.Simon MA, Tom LS, Nonzee NJ, et al. Evaluating a bilingual patient navigation program for uninsured women with abnormal screening tests for breast and cervical cancer: Implications for future navigator research. Am J Public Health. 2015;105(5):e87–94. [DOI] [PMC free article] [PubMed] [Google Scholar]
- 8.Ma GX, Shive SE, Wang MQ, Tan Y. Cancer screening behaviors and barriers in Asian Americans. Am J Health Behav. 2009;33(6):650–60. [DOI] [PMC free article] [PubMed] [Google Scholar]
- 9.Braun KL, Thomas WL Jr., Domingo JL, et al. Reducing cancer screening disparities in Medicare beneficiaries through cancer patient navigation. J Am Geriatr Soc. 2015;63(2):365–70. [DOI] [PMC free article] [PubMed] [Google Scholar]
- 10.Freund KM, Battaglia TA, Calhoun E, et al. National cancer institute patient navigation research program: Methods, protocol, and measures. Cancer. 2008;113(12):3391–9. [DOI] [PMC free article] [PubMed] [Google Scholar]
- 11.Davern M, Quinn BC, Kenney GM, Blewett LA. The American Community Survey and health insurance coverage estimates: Possibilities and challenges for health policy researchers. Health Serv Res. 2009;44(2 Pt 1):593–605. [DOI] [PMC free article] [PubMed] [Google Scholar]
- 12.Hall FM. Guidelines for screening mammography. J Am Coll Radiol. 2018;15(1 Pt A):8–9. [DOI] [PubMed] [Google Scholar]
- 13.Feinglass J, Cooper AJ, Rydland K, et al. Emergency department use across 88 small areas after Affordable Care Act Implementation in Illinois. West J Emerg Med. 2017;18(5):811. [DOI] [PMC free article] [PubMed] [Google Scholar]
- 14.Hirschman J, Whitman S, Ansell D, Grabler P, Allgood K. Breast cancer in Chicago: Improving mammography quality and eliminating disparities. Chicago: Sinai Urban Health Institute; 2006. [Google Scholar]
- 15.Biller-Andorno N, Jüni P. Abolishing mammography screening programs? A view from the Swiss Medical Board. N Engl J Med. 2014;370(21):1965–7. [DOI] [PubMed] [Google Scholar]
- 16.Bleyer A, Welch HG. Effect of three decades of screening mammography on breast-cancer incidence. N Engl J Med. 2012;367(21):1998–2005. [DOI] [PubMed] [Google Scholar]
- 17.Sighoko D, Murphy AM, Irizarry B, Rauscher G, Ferrans C, Ansell D. Changes in the racial disparity in breast cancer mortality in the ten US cities with the largest African American populations from 1999 to 2013: The reduction in breast cancer mortality disparity in Chicago. Cancer Causes Control. 2017;28(6):563–8. [DOI] [PMC free article] [PubMed] [Google Scholar]
- 18.Smith RA, Andrews KS, Brooks D, et al. Cancer screening in the United States, 2018: A review of current American Cancer Society guidelines and current issues in cancer screening. CA Cancer J Clin. 2018;68(4):297–316. [DOI] [PubMed] [Google Scholar]


