

Supplemental digital content is available in the text.
Key words/Abbreviations: racial discrimination, income, allostatic load, Indigenous, cultural continuity, AL = allostatic load, BMI = body mass index, CAR = cortisol awakening response, CC = cultural continuity, CRP = C-reactive protein, DHEA-S = dehydroepiandrosterone sulfate, LOWESS = locally weighted scatterplot smoother
ABSTRACT
Objective
This study aimed to examine the association between racial discrimination and allostatic load (AL) and whether this association was moderated by cultural continuity among Indigenous adults.
Methods
Data were collected from Indigenous adults attending university in a small city in western Canada between 2015 and 2017 (mean age = 27.8 years). The Experience of Discrimination Situation Score and the Vancouver Index Enculturation Subscale were used to assess racial discrimination and cultural continuity, respectively. AL was measured as a composite of seven biomarkers assessing neuroendocrine, cardiovascular, metabolic, and immune system function. Bias-corrected and accelerated bootstrapped linear regression models were used to examine associations adjusting for confounders (n = 104; 72.5% women).
Results
Across the full sample, racial discrimination was associated with a linear, dose-response increase in AL score after adjustment for confounders. Among adults with low cultural continuity, past-year discrimination was associated with increased AL and explained 22% (adjusted R2) of the variance in AL score. Taken together, the full model including age, sex, and income explained 38% of the variance in AL score in this subgroup. Among adults with high cultural continuity, racial discrimination was not associated with AL, whereas age remained significant and explained 13% of the variance in AL score.
Conclusions
Past-year racial discrimination was associated with early and more pronounced wear and tear on stress response systems among Indigenous adults relative to peers. Indigenous cultural continuity served as an important buffer that promoted biological resilience against the adverse effects of racial discrimination on physiologic regulation among Indigenous adults.
INTRODUCTION
Indigenous people within many countries report high levels of racial discrimination across a variety of life domains (1,2). Racial discrimination is any exclusion, restriction, or preference based on race, color, descent, or ethnic origin that has the purpose of impairing the enjoyment of human rights and fundamental freedoms in public life (3). Racial discrimination has wide-ranging impacts that go beyond mental distress to include alterations in stress biomarkers across multiple domains (4). The cumulative impacts of discrimination on biological health may play a role in the disproportionate burden of health inequities observed across many Indigenous populations (5). The key objectives of this study were to examine the impacts of racial discrimination on multisystem biological dysregulation among Indigenous adults in Canada, operationalized through allostatic load (AL), and the role that Indigenous cultural continuity (CC) may play in resilience.
Allostatic Load
When an environmental challenge to the homeostatic system is evolutionarily appropriate or predictable, the response seems coordinated and synchronous (6). Some stressors in modern life, such as racial discrimination, have been theorized to represent novel challenges that perturb the homeostatic system in ways that are out of context with its evolution, thus exposing fragilities that lead to allostatic states (6–8). Allostasis differs from homeostasis in that it is considered a disordered form of physiologic regulation in which the body strives to promote short-term survival in the face of threat (6,9). Allostasis involves an overresponse of one or more biological markers in magnitude or duration that can, over time, lead to changes in the body’s defended values or range (10,11). Allostasis also involves physiologic responses competing concurrently and thus inefficiently with one another because the triggering events were not anticipated in an evolutionary sense (6). AL characterizes the wear and tear on the body due to the chronic activation of allostasis, and is a 10-year predictor of morbidity, all-cause mortality, and cause-specific mortality across young, middle-aged, and older adults (12,13).
Few studies have examined associations between racial discrimination and AL as an aggregate measure of physiologic stress. Cross sectionally, two studies have found that lifetime discrimination was associated with increased AL among African American and Puerto Rican adults (14,15). Longitudinally, chronic everyday discrimination experienced between 16–18 years of age has been positively associated with AL at age 20 years within an African American population (16). In terms of moderating variables, Allen et al. (17) found that educational attainment moderated the association between racial discrimination and AL among African American women. An important point about these studies is that each operationalized AL in different ways and controlled for different covariates, making it difficult to highlight trends (18,19). In this study, we examined the association between racial discrimination and AL among Indigenous adults, with AL operationalized using markers from the three biological domains that framed the original AL index (i.e., neuroendocrine, cardiovascular, metabolic) and an added immune marker (20).
Indigenous Cultural Continuity
Our second objective was to examine whether CC served as a resilience factor that buffered the impacts of racial discrimination on AL. CC was defined as the extent to which adults are engaged in the cultural practices and values of their Indigenous cultural heritage, as they define those to be, at the time of data collection. CC has been shown to reduce the impact of low educational attainment on substance misuse and the impact of racial discrimination on mental distress among Indigenous adults (1,21). The current study builds on these findings by examining whether CC may also reduce the impact of racial discrimination on AL within an Indigenous adult population.
Population Focus
This study was conceptualized using a participatory action research framework (22). An Indigenous Advisory Committee made up of key members of the Indigenous community in Lethbridge was assembled and worked with the research team to set study priorities and make data collection decisions. The Committee suggested Indigenous university students as the population focus, given that many have overcome significant hardships to enroll and attend. Thus, it was suggested that this population would be a particularly good test of the hypothesis that racial discrimination could impact AL, as this group may be more resilient in the face of stressors relative to other Indigenous adults. That said, more than half of all Indigenous Canadians aged 25 to 64 years have a postsecondary qualification, including 34% who have completed university or college (23). The proportion of Indigenous adults with postsecondary training in Canada continues to grow with each Census cycle (23). Thus, although it is possible that the population examined in this study may be resilient, they also represent a large and growing segment of the Indigenous population in Canada.
METHODS
Study Design
Study procedures were approved by the Human Subjects Research Committee at the University of Lethbridge. Participants were recruited using posters and ads placed in e-newsletters on campus. Recruitment and data collection began in September 2015 and continued for four academic terms ending in April 2017. The final sample size was 150 Indigenous adults.
Cultural Adaptation
Working with an Indigenous Advisory Committee, it was determined that salivary rather than blood samples would be taken, given that blood is a sacred element in many Indigenous cultures and must be respected in ways that may be incompatible with scientific research. Because saliva is also a substance that comes from the body, a system was put in place in consultation with Indigenous Knowledge Holders to ensure that the wishes of participants were honored. The consent form provided participants the option of having their saliva samples returned to them upon analysis or to have their saliva samples included in an Indigenous ceremony led by an Elder that returned the samples to the Earth.
Procedures
Respondents were asked to confirm eligibility by e-mail/phone (i.e., they identified as Indigenous, current postsecondary students, and 18 years or older). Participants then attended an on-campus study office to complete consent procedures, paper-and-pencil surveys, and the physical assessments needed to calculate AL score (mean completion time = 90 minutes) during standard office hours (9:00 AM–4:00 PM). To ensure sufficient participant recruitment, we needed to accommodate student course schedules and thus could not standardize a narrow window for data collection across participants, which may have been useful for some biomarkers examined (e.g., dehydroepiandrosterone sulfate [DHEA-S] and C-reactive protein [CRP]).
Saliva samples were collected at three time points during this visit using the passive drool technique. Participants rinsed their mouth with water, and the first sample was collected after completing a portion of the questionnaire. Remaining samples were taken 30 and 60 minutes later. Whole saliva samples were collected in a 2-ml microcentrifuge tube using a Saliva Collection Aid (Salimetrics, State College, Pennsylvania). During data collection, salivary samples were stored in the in-office freezer and then transferred to a −80°C freezer. Participants were provided with supplies for collecting saliva samples at home for 2 days, as well contact information for the research assistant who collected data from them during the office visit. Participants were asked to call, e-mail, or text with questions, and coordinate a time for sample return.
At home, participants selected two consecutive days with similar wake/sleep times and collected a saliva sample at three time points: immediately upon wake-up, 30 minutes after wake-up, and before bed, and to record the times in which samples were taken on forms provided. Participants were instructed to place the swab under the tongue for 3 minutes and then place it in a prelabeled tube and put it in their freezer. When all six samples were collected, the participant contacted the research assistant to coordinate sample return. We used cortisol awakening response (CAR) expert consensus guidelines to increase at-home adherence including clearly explaining the importance of strict adherence to sampling times, emphasizing the importance of collecting sample S1 immediately upon awakening, encouraging participants to ask questions via text message/e-mail/phone, providing take-home instructions, having participants record data collection time points in a diary log, advising participants to place kits beside the bed for morning collection, and text messaging the evening before sampling to highlight instructions (24). Participants returned the samples in an insulated lunch kit with a freezer pack given to them during the in-office visit. Samples received were transferred to a −80°C freezer. Participants were given an honorarium of $50 for in-office measures and $50 for at-home measures.
Data Collection and Measurements
Allostatic Load
AL score was based on a composite of seven biomarkers across four biological domains:
Cardiovascular markers: Resting systolic and diastolic blood pressures were measured using a Life Source automated sphygmomanometer (Auto Control Medical, Mississauga, Ontario, Canada). Three readings were taken. The first was taken approximately 15 minutes after the participant arrived, once they had completed the consent process and answered the first part of the survey package in a seated position. This reading was discarded. Two additional readings were taken approximately 15 and 30 minutes after the first, whereas the participant was seated and completing the survey package (i.e., before moving the participant to the scale to measure body mass index [BMI] and waist circumference). These two measures were averaged.
Neuroendocrine markers included DHEA-S and CAR. All were analyzed in duplicate. As per manufacturer’s suggestion for DHEA-S, the three in-office samples were pooled and mixed for analysis. To examine CAR, the wake-up (S1) and 30 minutes after wake-up (S2) samples taken at home on the second day were analyzed, and the percent change in cortisol between S1 and S2 was calculated. Day 1 at-home samples were not combined with day 2 samples to produce an average because missing data were higher on day 1. CAR represents the sharp rise in cortisol levels across the first 30 to 45 minutes after morning awakening. In healthy adults, the magnitude of CAR ranges between a 50% and 156% (25).
Metabolic markers included BMI and waist circumference. To calculate BMI, height and weight were measured to the nearest 0.5 cm using a Health O Meter mechanical beam scale and stadiometer, and to the nearly 0.1 kg using a weighbeam scale; respectively. Waist circumference was measured at the top of the iliac crest, to the nearest 0.5 cm. Although correlated (Pearson r = 0.87 in this sample), both measures were included in the AL score because each is independently associated with health risk.
Immune marker: We measured CRP using the third in-office saliva sample.
Cortisol, DHEA-S, and CRP concentrations were assessed using commercially available enzyme-linked immunosorbent assays (Salimetrics, LLC, State College, Pennsylvania). Average intra-assay variabilities were 3.9% for cortisol, 6.6% for DHEAS, and 4.3% for CRP. Average interassay variabilities were 9.2% for cortisol, 12.8% for DHEAS, and 8.3% for CRP. For CAR, all samples from the same participant were analyzed in the same plate, to minimize the effect of interassay variability.
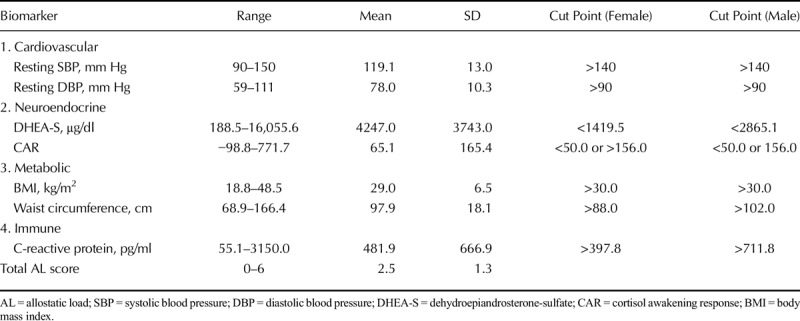
AL risk assessment was based on the distribution of the study sample for salivary CRP and DHEA by dividing the sample into sex-specific quartiles with high risk defined by the highest quartile for CRP and the lowest quartile for DHEA-S. As shown in Table 1, we used standard cutoffs for all other biomarkers (26,27). Consistent with prior studies, one point was assigned if the variable was in the high-risk quartile and 0 if not. Scores were summed across each system type (neuroendocrine, metabolic, immune, and cardiovascular) to create a total score for AL.
TABLE 1.
Mean, Range, and Cut Points Used for AL Biomarkers (n = 104)
Racial Discrimination
The Experiences of Discrimination Scale is a valid and reliable measure of self-reported racial discrimination that has been used across many ethnic groups (28). The situation score is derived by counting the number of situations (1–9) in which racial discrimination was experienced. Previous research suggests that Indigenous Canadians experience high levels of racial discrimination and that a scale adjusted to measure experiences in the past 12 months is recommended to ensure sufficient variability (1,29). Consistent with previous research, each question in the present study was worded as follows, with information in brackets reflecting words added, and X reflecting the situation tested: (In the past 12 months) have you experienced discrimination, been prevented from doing something, or been hassled or made to feel inferior at X because of your (Aboriginal) race, ethnicity, or color? Internal consistency of the measure in this study was good (Cronbach α = .82). For descriptive purposes, participants were also asked how frequently they worried about racial discrimination as an adult, and the frequency of racial discrimination experienced due to their Indigenous race or ethnicity as a child. Response items for each question were 1, rarely or never; 2, some of the time; and 3, most of the time.
Cultural Continuity
Indigenous CC in the past 12 months was measured using the 10-item Enculturation Subscale on the Vancouver Index (30). Sample questions include the following: (1) I often participate in my Indigenous cultural traditions; (2) It is important for me to maintain or develop the practices of my Indigenous culture; and (3) I believe in the values of my Indigenous culture. Response options range from 1 (disagree) to 9 (agree) for each question. Internal consistency was strong (Cronbach α = .85). To understand how CC was defined, participants were asked: Thinking about the Aboriginal cultural group that you most identify with, can you name (1) three cultural behaviors or traditions that a traditional Aboriginal person would typically engage in, and (2) three cultural values that a traditional Aboriginal person would consider important?
Covariates
Age and sex (male or female) were collected as part of the survey package. Current perceived socioeconomic status was assessed by a question that asked participants which income group they currently identified with. The five response options were as follows: upper income, upper-middle income, middle income, lower-middle income, and lower income. Socioeconomic status was assessed in this manner to improve validity, given that university students may not know their household income as a child or currently as an adult if they are living with their parents, and given that previous Indigenous research has documented low missing values when income was measured in this way in our territory (31,32).
Missing Data
Data were collected from 150 participants, 35 of whom were removed from the analysis because they chose to not complete and/or return at-home samples. An additional eight were removed because the timing of at-home sampling was completed in ways that did not follow procedure resulting in the inability to calculate valid CAR (24). Also, two participants were removed for not completing questions about discrimination in the past 12 months, and one was removed for not reporting their age. There were no missing data on survey questions about sex, current socioeconomic position, or CC. The final sample size included in this analysis was n = 104. Independent-samples t tests confirmed that the mean age, income, racial discrimination score, and Indigenous CC score of participants included and excluded from the analysis because of missing data were not statistically different, nor was the sex balance different between groups.
Analysis Strategy
Measures were summarized with means (SDs) for continuous variables and frequencies for dichotomous variables. Scatterplots with best-fit regression lines and locally weighted scatterplot smoother (LOWESS) curves were used to examine unadjusted associations between AL and discrimination to determine the linearity of associations. Next, bootstrapped linear regression models (k = 5000) were used to quantify the change in AL per unit change in the number of situations racial discrimination had been experienced in the past 12 months, with AL examined as a continuous variable. Bias-corrected and accelerated bootstrap intervals were used to adjust for positive skew in the bootstrap distribution of AL scores. Potential confounders including age, sex, and socioeconomic status were selected a priori based on existing literature, given that most studies that have examined the impacts of discrimination on health have adjusted for these variables (4).
Several studies have controlled for behavioral variables and mental health when examining the associations between discrimination and AL biomarkers. We disagree with such an approach, given that racial discrimination has been shown to predict later mental health and health-risk behavior problems across more than 30 longitudinal studies examining a variety of ethnicities and age groups worldwide (4,33,34). This large body of longitudinal evidence suggests that mental health and health-risk behavior variables should be examined as part of the causal chain linking racial discrimination to AL (i.e., as mediators) rather than noise that should be controlled in statistical models, the analysis of which was beyond the scope and focus of the current article.
Statistical interactions between discrimination and confounders (age, sex, income group) were examined using LOWESS curves and multiplicative interaction terms; none were found. Variance inflation factors calculated across all variables included in regression models indicated that multicollinearity was not a concern (variance inflation factor range = 1.01–1.09). To examine the potential role of CC, the sample was dichotomized into high and low CC groups using the sample median. Scatterplots with best-fit and LOWESS curves suggested the presence of nonlinear associations between AL and discrimination that differed by CC group. Thus, the quadratic version of the continuous exposure variable (past-year discrimination) was added to each bootstrapped linear regression model (k = 5000) used to quantify the change in AL per unit change in the number of situations in which discrimination had been experienced in the past year. Given that a number of participants were excluded from the sample because of missing at-home measures for CAR, we also calculated AL using all markers but CAR and repeated the analysis described here as supplementary tests of our hypotheses. Data were analyzed using IBM SPSS 25.
RESULTS
Sample Characteristics
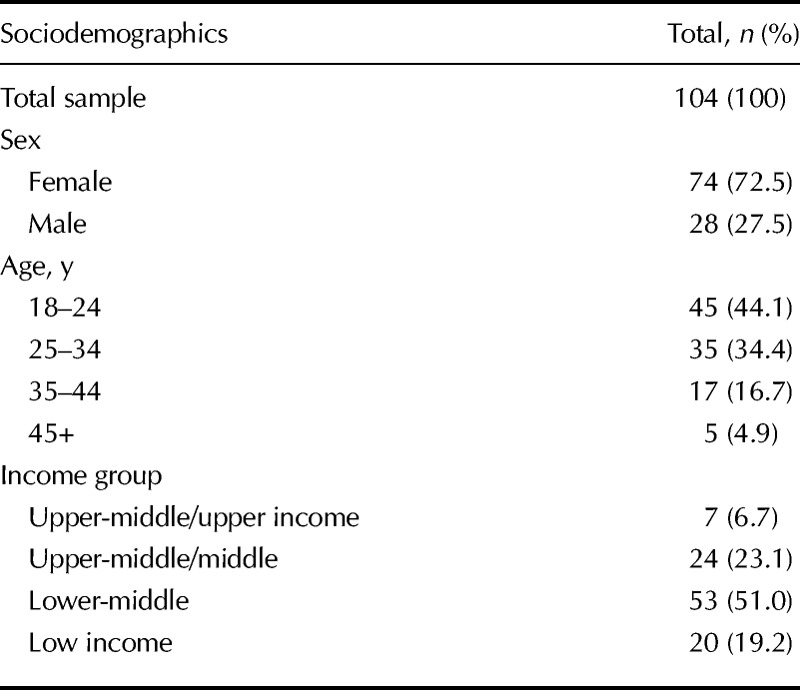
Sample characteristics are shown in Table 2. All participants were adult postsecondary students, and most (98.1%) attended school full-time. The mean (SD) age was 27.8 (8.7) years (range = 18–57 years), which is somewhat lower than the mean age (32.1 years) of Indigenous people in Canada during this time frame (35). Almost three quarters were female in keeping with higher proportions of female Indigenous students at most Canadian universities (36). Most (72.2%) identified as low-middle or low income, and most lived in a city.
TABLE 2.
Characteristics of the Sample
Participants evidenced high levels of CC (mean [SD] = 76.8, median = 78.0, range = 36–90). When asked about the cultural activities a traditional person within his/her Indigenous group would engage in, the most common responses were spiritual ceremonies (e.g., Sweat Lodge and Sun Dance), social activities (e.g., pow wows), and spending time with family. When asked what cultural values a traditional Indigenous person would consider important, the most frequent responses were respect, being close to family, spirituality, Elders, and sharing with others.
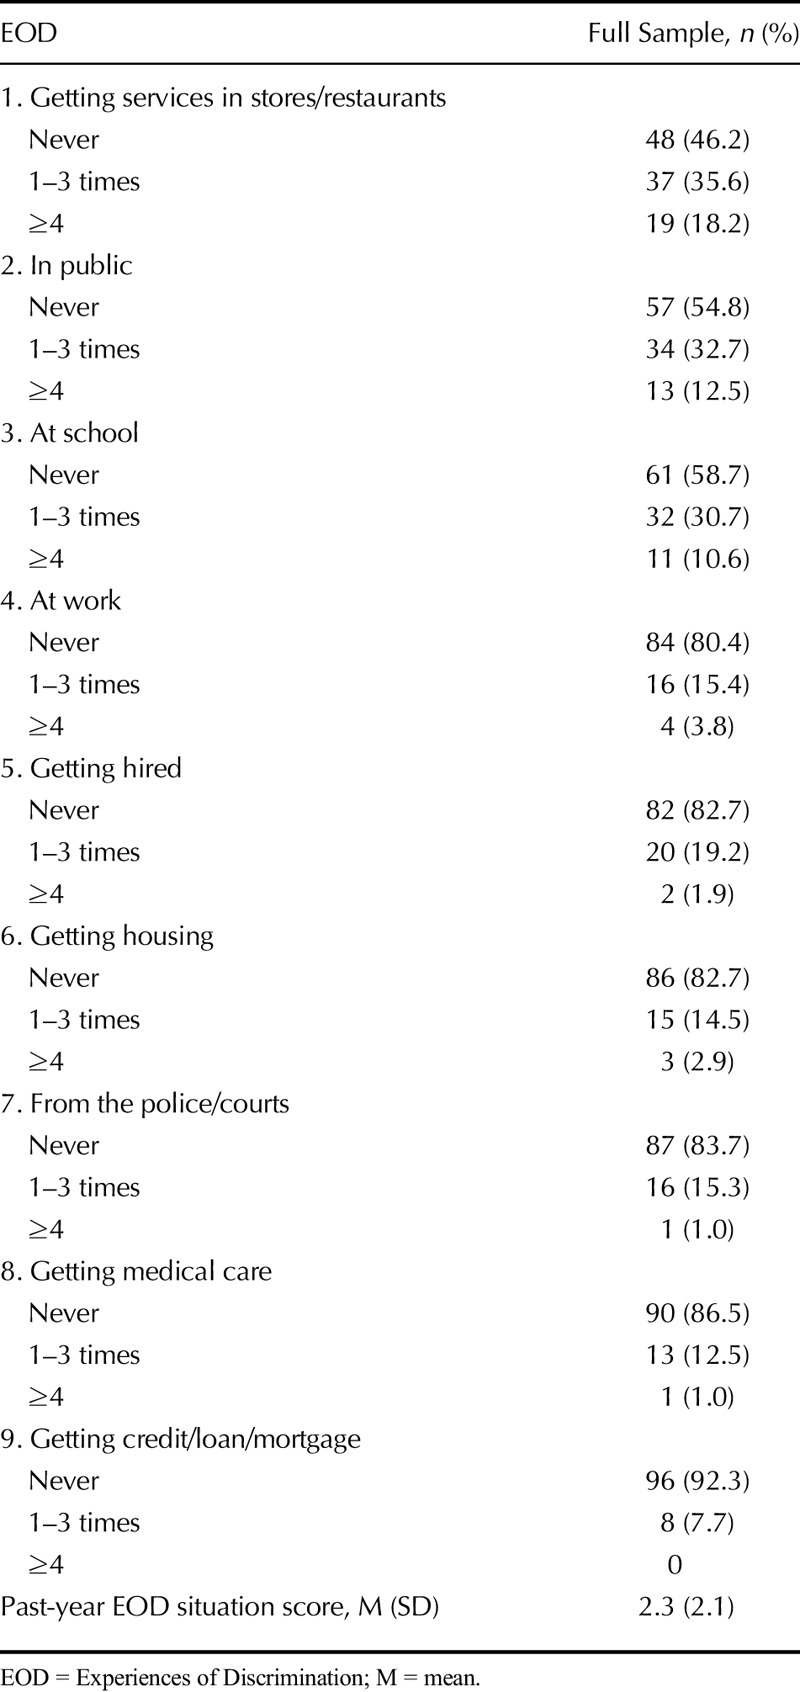
Approximately 7 (73.1%) in 10 participants had experienced discrimination in the past year, most frequently in stores and restaurants, in public settings, and at school (Table 3). On average, participants experienced discrimination in 2.3 of a possible 9 situations in the past year. Most had worried some (49.0%) or most of the time (21.2%) about discrimination in that time frame. The frequencies of racial discrimination experienced in childhood and the past year were moderately correlated (Spearman ρ = 0.52, p < .001). Those who were more culturally continuous experienced racial discrimination across a larger number of situations in the past year (Pearson r = 0.42, p < .001), and more frequently in childhood (Spearman ρ = 0.36, p < .001).
TABLE 3.
EOD in Past 12 Months Among Indigenous Adults (n = 104)
Racial Discrimination and AL
The mean (SD) AL score for this sample was 2.5 (1.3) of a possible 7 (range = 0–6). The AL median and mode were both 2.0. The AL skewness value was 0.5, suggesting that the distribution of AL scores was approximately symmetric. A scatterplot of AL versus discrimination score (Figure 1) illustrated that the LOWESS curve followed the regression line, suggesting that the association was no more complex than linear. In a bootstrapped linear regression model adjusted for age, sex, and income, past-year discrimination was statistically associated with AL score. As shown in Table 4 (model 1), every additional situation in which racial discrimination had been experienced in the past year resulted in a 0.15-point increase in adult AL score, or a 1.35-point maximal AL increase if discrimination had been experienced across all nine situations examined. Model 1 explained 23% of the variance in AL score, of which 12% was explained by past-year racial discrimination (R2 change = 11.9, F change = 13.72; significant F change, p < .001).
FIGURE 1.
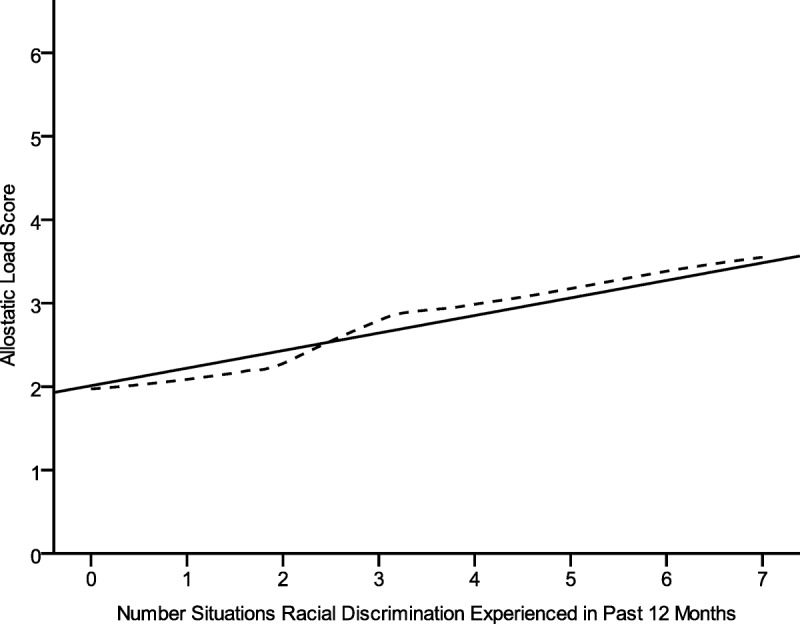
Linear and LOWESS associations between the number of situations in which discrimination was experienced in the past year and AL score (n = 104). LOWESS = locally weighted scatterplot smoother; AL = allostatic load.
TABLE 4.
Linear Regression Models for the Direct Effects of Discrimination Situation Score on AL Score, With and Without Stratification by Indigenous CC (n = 104)
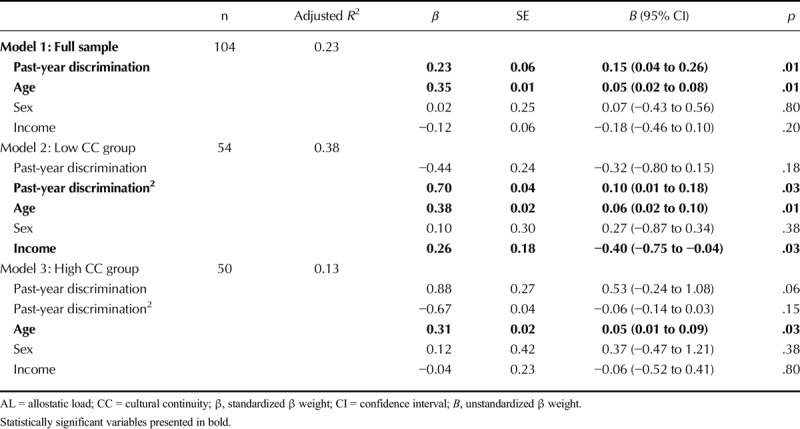
Racial Discrimination, AL, and CC
The distribution of CC scores in this sample was negatively skewed. The mean, median, and mode were 76.8, 78.0, and 90 (range = 36–90), respectively, and the skewness value was −1.4 highlighting a significant negative skew. Thus, we chose to dichotomize the variable rather than model it continuously. To examine the role of Indigenous CC, the sample was stratified into low (n = 54) and high CC (n = 50) groups using the sample median for the Vancouver Index Enculturation score. Perfectly sized groups could not be obtained given the distribution of scores. The high CC group had experienced racial discrimination across 3 situations in the past year compared with 1.6 situations in the low CC group (independent-samples t = 3.67, df = 102, p < .001). There was no significant difference in AL score between those in the low (mean AL = 2.38) and high CC group (mean AL = 2.67, independent-samples t = 0.1.15, df = 105, p = .25).
Within the low CC group, a LOWESS curve illustrated a threshold effect before which discrimination was not associated with or decreased with AL score (Figure 2, red lines). Once the discrimination score approached the sample mean of 1.6, AL began to increase with discrimination in an increasingly monotonic fashion, which became steeper than the regression line once discrimination score surpassed 3. An inverse pattern was observed within the high CC group for whom AL increased with discrimination until the score reached the sample mean of 3.0, after which AL leveled off or decreased (Figure 2, blue lines).
FIGURE 2.
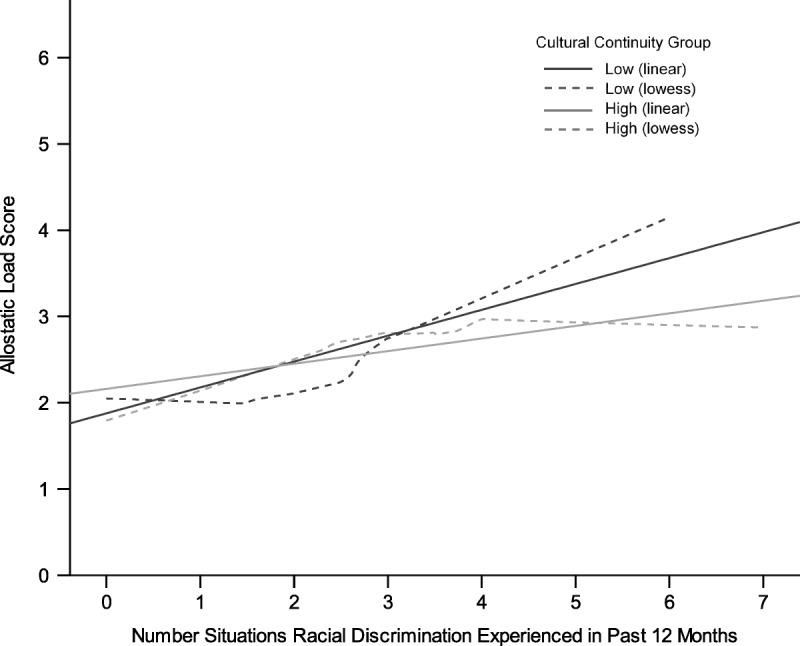
Linear and LOWESS associations between the number of situations in which discrimination was experienced in the past year and AL score, stratified by Indigenous cultural continuity (n = 104). LOWESS = locally weighted scatterplot smoother; AL = allostatic load. Color image is available only in the online version (www.psychosomaticmedicine.org).
Given these findings, associations between past-year discrimination and AL, stratified by CC, were modeled in bootstrapped linear regression models using a quadratic function (past-year racial discrimination score, with the squared term) to account for the bend observed in the LOWESS curve for each group (37). Given that regression β weights cannot be accurately interpreted in the presence of a quadratic equation, variance explained was used to interpret results for the stratified analysis (37). Among those in the low CC group, the variables in model 2 explained 38% of the variance in AL score, of which racial discrimination and its quadratic equation explained 22% (R2 change = 0.22, F change = 7.42, significant F change < .001). Among those in the high CC group (model 3), age explained 13% of the variance in AL score. Racial discrimination and income were not associated with AL within this subsample.
Supplementary Analyses
Table S1 (Supplemental Digital Content, http://links.lww.com/PSYMED/A585) outlines partial associations between racial discrimination and AL adjusted for age, with and without stratification by CC. One-tailed tests were used because it was predicted that racial discrimination would increase risk across each biomarker. Findings suggest that cardiovascular and neuroendocrine biomarkers were adversely affected by past-year racial discrimination in the low CC group, and metabolic biomarkers were adversely affected by past-year racial discrimination in the high CC group. These results were likely confounded by the increased racial discrimination reported by high CC adults in childhood and the past year.
Table S2 (Supplemental Digital Content, http://links.lww.com/PSYMED/A585) outlines a reanalysis of the main findings excluding CAR from the AL calculation, which increased the sample size to n = 143. Racial discrimination remained a significant correlate of AL, explaining 9% of the variance in AL score before stratification by CC (R2 change = 0.09, F change = 14.80, significant F change < .001). Among those in the low CC group (Table S2, Supplemental Digital Content, http://links.lww.com/PSYMED/A585), the variables in model 2 explained 37% of the variance in AL score, of which racial discrimination and its quadratic equation explained 17% (R2 change = 0.17, F change = 7.04, significant F change p = .002). Among those in the high CC group, the variables in model 3 explained 17% of the variance in AL score, of which 14% was explained by racial discrimination (R2 change = 0.14, F change = 5.35, significant F change p = .007).
DISCUSSION
This study was conducted with a relatively young (mean age = 28 years) sample of Indigenous adults with at least some university education. Younger age and higher education are health protective and associated with reduced AL score among adults (19). However, even within this sample, past-year racial discrimination was associated with a linear, dose-response increase in AL. The aggregate measure of AL used in this study suggests that Indigenous adults who experienced more discrimination in the past-year had evidence of early and more pronounced wear and tear on stress response systems relative to peers, after adjustment for age, sex, and income.
The Role of Indigenous CC
Consistent with previous research, Indigenous adults who were highly culturally continuous experienced significantly more racial discrimination in the past year and in childhood than their peers who were less culturally continuous, thus highlighting the ongoing tension between these two social determinants of Indigenous health within colonized societies (31,38). However, despite these experiences, engagement in culture served as a resilience factor that reduced the adverse impacts of racial discrimination on AL. Among adults in the high CC subgroup, AL increased with discrimination until the mean of three discriminatory situations in the past year was reached, after which there were no further increases. These findings suggest a ceiling effect, after which additional discrimination beyond the sample mean did not increase AL among Indigenous adults who were highly engaged in their culture. Findings among the Sami have similarly documented that a strong Indigenous identity may buffer the impact of discrimination on mental distress (21). That said, a review of effective strategies for coping with racial discrimination found that racial identity development buffered the impacts of discrimination on mental health in only 3 of 12 studies (39). Although our study examined biological rather than psychological markers of stress and may not be directly comparable, it is also important to note that the measure of CC used in our study went beyond identity to include engagement in cultural traditions and values. This is significant, as cultural engagement can open up a social milieu that encourages individuals to see the many strengths that exist within their culture and history, to hold high esteem for themselves and their ethnic ancestry, and to socialize with others who are also culturally continuous and thus view them in a similarly esteemed and positive light. Those who are culturally continuous may also be better equipped to recognize that racist experiences are due to social injustices and inaccurate stereotypes rather than personal or ethnic deficits, given that they have direct experience with the actual (rather than the stereotyped) cultural values and traditions of their group.
CC may also provide resilience, given that human beings are not psychologically self-sufficient but naturally inclined to establish and maintain a profound interdependence with society (40). Ongoing discrimination across multiple life situations (e.g., at work, in public, in stores, and seeking health care) conveys rejection from the dominant group and can break down feelings of trust in, and interdependence with, society (41). A lack of psychosocial integration, termed social dislocation, is individually painful and socially destructive (42). CC may buffer the impacts of racial discrimination on psychological and physiologic stress by buffering the degree to which individuals become socially dislocated because of discrimination, given that those who are cultural continuous will have greater access to social resources in which they can establish and maintain a meaningful interdependence. For example, being close to family and spending time with family were key ways Indigenous adults indicated that they were connected to their culture, both within our study and previous studies with Indigenous adults (21,31,32).
Among adults with low CC, the number of situations in which discrimination was experienced in the past-year explained a significant portion (22%) of the variance in AL score. Age and income also exerted independent effects on AL, which taken together explained 38% of the variance in AL score. A systematic review suggests that interventions to increase CC can be effective in enabling the expression of Indigenous cultural identities and can have positive health effects (43). Such programs will not, however, eliminate key obstacles to CC such as high levels of racial discrimination directed at Indigenous people in cities (1,29).
Strengths and Limitations
Study strengths include guidance by an Indigenous Advisory Committee, the use of a validated measure of racial discrimination and CC, and the use of a cumulative AL approach to examine the impact of racial discrimination on the body, after control for age, sex, and income. Limitations include use of a cross-sectional design, which precludes inferences about causation and the temporal sequence of racial discrimination and AL, more female than male participants, and a relatively small sample of university students, which may not be generalizable to the general population. The use of a 12-month measure of discrimination is also a limitation given that the physiologic dysregulation reflected in AL scores may have been a result of discrimination experienced over a much larger period. Approximately 30% of the sample was excluded from the analysis because of missing data; however, a comparative analysis suggests that those excluded did not differ on the variables examined. Response bias due to self-report measures is also a concern, particularly for racial discrimination. Research suggests that racial discrimination, given that it is often implicit in nature and pervasive in society, may not always be consciously perceived and reported (28). Thus, self-reported discrimination may result in underreporting, revealing only a small portion of the actual effect of racial discrimination on the individual (44). Finally, our examination of these associations does not assume that the racial discrimination experienced by racialized groups in different locations is the same.
CONCLUSIONS
Indigenous adults who experienced more racial discrimination in the past year had early and more pronounced wear and tear on stress response systems relative to peers. Indigenous CC served as an important buffer that promoted biological resilience against the adverse effects of racial discrimination on physiologic regulation among Indigenous adults.
Supplementary Material
Acknowledgments
Source of Funding and Conflicts of Interest: All authors report no conflicts of interest. This project was funded by an operating grant from the Canadians Institutes of Health Research, Institutes of Indigenous Peoples’ Health (principal investigator: C.L.C., Grant No. 131590). C.L.C. was also supported by an Alberta Innovates Translational Research Chair in Aboriginal Health.
Footnotes
Supplemental Content
REFERENCES
- 1.Currie CL, Wild TC, Schopflocher D, Laing L. Racial discrimination, post-traumatic stress and prescription drug problems among aboriginal Canadians. Can J Public Health 2015;106:e382–7. [DOI] [PMC free article] [PubMed] [Google Scholar]
- 2.Shepherd CCJ, Li J, Cooper MN, Hopkins KD, Farrant BM. The impact of racial discrimination on the health of Australian Indigenous children aged 5–10 years: analysis of national longitudinal data. Int J Equity Health 2017;16:116. [DOI] [PMC free article] [PubMed] [Google Scholar]
- 3.Office of the High Commissioner for Human Rights. International Convention on the Elimination of All Forms of Racial Discrimination. Geneva, Switzerland: UN General Assembly; 1965Available at: https://www.ohchr.org/en/professionalinterest/pages/cerd.aspx. Accessed July 24, 2019. [Google Scholar]
- 4.Paradies Y, Ben J, Denson N, Elias A, Priest N, Pieterse A, Gupta A, Kelaher M, Gee G. Racism as a determinant of health: a systematic review and meta-analysis. PLoS One 2015;10:–e0138511. [DOI] [PMC free article] [PubMed] [Google Scholar]
- 5.Anderson S, Currie CL, Copeland JL, Metz GA. Community belonging and sedentary behavior among First Nations adults in Canada: the moderating role of income. Am Indian Alsk Native Ment Health Res 2016;23:1–14. [DOI] [PubMed] [Google Scholar]
- 6.Ramsay DS, Woods SC. Clarifying the roles of homeostasis and allostasis in physiological regulation. Psychol Rev 2014;121:225–47. [DOI] [PMC free article] [PubMed] [Google Scholar]
- 7.Cabanac M. Adjustable set point: to honor Harold T. Hammel. J Appl Physiol (1985) 2006;100:1338–46. [DOI] [PubMed] [Google Scholar]
- 8.Karatsoreos IN, McEwen BS. Psychobiological allostasis: resistance, resilience and vulnerability. Trends Cogn Sci 2011;15:576–84. [DOI] [PubMed] [Google Scholar]
- 9.Peters A, McEwen BS. Introduction for the allostatic load special issue. Physiol Behav 2012;106:1–4. [DOI] [PubMed] [Google Scholar]
- 10.Edwards S, Koob GF. Neurobiology of dysregulated motivational systems in drug addiction. Future Neurol 2010;5:393–410. [DOI] [PMC free article] [PubMed] [Google Scholar]
- 11.Koob GF, Le Moal M. Plasticity of reward neurocircuitry and the “dark side” of drug addiction. Nat Neurosci 2005;8:1442–4. [DOI] [PubMed] [Google Scholar]
- 12.Robertson T, Beveridge G, Bromley C. Allostatic load as a predictor of all-cause and cause-specific mortality in the general population: evidence from the Scottish Health Survey. PLoS One 2017;12:e0183297. [DOI] [PMC free article] [PubMed] [Google Scholar]
- 13.McEwen BS. Physiology and neurobiology of stress and adaptation: central role of the brain. Physiol Rev 2007;87:873–904. [DOI] [PubMed] [Google Scholar]
- 14.Ong AD, Williams DR, Nwizu U, Gruenewald TL. Everyday unfair treatment and multisystem biological dysregulation in African American adults. Cultur Divers Ethnic Minor Psychol 2017;23:27–35. [DOI] [PMC free article] [PubMed] [Google Scholar]
- 15.Cuevas AG, Wang K, Williams DR, Mattei J, Tucker KL, Falcon LM. The association between perceived discrimination and allostatic load in the Boston Puerto Rican Health Study. Psychosom Med 2019;81:659–67. [DOI] [PMC free article] [PubMed] [Google Scholar]
- 16.Brody GH, Lei M-K, Chae DH, Yu T, Kogan SM, Beach SRH. Perceived discrimination among African American adolescents and allostatic load: a longitudinal analysis with buffering effects. Child Dev 2014;85:989–1002. [DOI] [PMC free article] [PubMed] [Google Scholar]
- 17.Allen AM, Thomas MD, Michaels EK, Reeves AN, Okoye U, Price MM, Hasson RE, Syme SL, Chae DH. Racial discrimination, educational attainment, and biological dysregulation among midlife African American women. Psychoneuroendocrinology 2019;99:225–35. [DOI] [PMC free article] [PubMed] [Google Scholar]
- 18.Beckie TM. A systematic review of allostatic load, health, and health disparities. Biol Res Nurs 2012;14:311–46. [DOI] [PubMed] [Google Scholar]
- 19.Juster RP, McEwen BS, Lupien SJ. Allostatic load biomarkers of chronic stress and impact on health and cognition. Neurosci Biobehav Rev 2010;35:2–16. [DOI] [PubMed] [Google Scholar]
- 20.Segerstrom SC, Miller GE. Psychological stress and the human immune system: a meta-analytic study of 30 years of inquiry. Psychol Bull 2004;130:601–30. [DOI] [PMC free article] [PubMed] [Google Scholar]
- 21.Friborg O, Sørlie T, Hansen KL. Resilience to discrimination among Indigenous Sami and non-Sami populations in Norway: the SAMINOR2 study. J Cross Cult Psychol 2017;48:1009–27. [Google Scholar]
- 22.McTaggert R. Principles for participatory action research. Adult Educ Q 1991;41:168–87. [Google Scholar]
- 23.Government of Canada. Education in Canada: key results from the 2016 Census. 2017. Available at: https://www150.statcan.gc.ca/n1/daily-quotidien/171129/dq171129a-eng.pdf. Accessed May 25, 2019.
- 24.Stalder T, Kirschbaum C, Kudielka BM, Adam EK, Pruessner JC, Wüst S, Dockray S, Smyth N, Evans P, Hellhammer DH, Miller R, Wetherell MA, Lupien SJ, Clow A. Assessment of the cortisol awakening response: expert consensus guidelines. Psychoneuroendocrinology 2016;63:414–32. [DOI] [PubMed] [Google Scholar]
- 25.Clow A, Thorn L, Evans P, Hucklebridge F. The awakening cortisol response: methodological issues and significance. Stress 2004;7:29–37. [DOI] [PubMed] [Google Scholar]
- 26.Juster RP, Moskowitz DS, Lavoie J, D’Antono B. Sex-specific interaction effects of age, occupational status, and workplace stress on psychiatric symptoms and allostatic load among healthy Montreal workers. Stress 2013;16:616–29. [DOI] [PubMed] [Google Scholar]
- 27.Gustafsson PE, San Sebastian M, Janlert U, Theorell T, Westerlund H, Hammarström A. Life-course accumulation of neighborhood disadvantage and allostatic load: empirical integration of three social determinants of health frameworks. Am J Public Health 2014;104:904–10. [DOI] [PMC free article] [PubMed] [Google Scholar]
- 28.Krieger N, Smith K, Naishadham D, Hartman C, Barbeau EM. Experiences of discrimination: validity and reliability of a self-report measure for population health research on racism and health. Soc Sci Med 2005;61:1576–96. [DOI] [PubMed] [Google Scholar]
- 29.Currie CL, Wild TC, Schopflocher DP, Laing L, Veugelers P. Racial discrimination experienced by Aboriginal university students in Canada. Can J Psychiatry 2012;57:617–25. [DOI] [PubMed] [Google Scholar]
- 30.Ryder A, Alden L, Paulhus D. Is acculturation unidimensional or bidimensional? A head-to-head comparison in the prediction of personality, self identity, and adjustment. J Pers Soc Psychol 2000;79:49–65. [DOI] [PubMed] [Google Scholar]
- 31.Currie CL, Wild TC, Schopflocher DP, Laing L, Veugelers P. Illicit and prescription drug problems among urban Aboriginal adults in Canada: the role of traditional culture in protection and resilience. Soc Sci Med 2013;88:1–9. [DOI] [PubMed] [Google Scholar]
- 32.Currie CL, Wild TC, Schopflocher DP, Laing L, Veugelers PJ, Parlee B, McKennitt DW. Enculturation and alcohol use problems among Aboriginal university students. Can J Psychiatry 2011;56:735–42. [DOI] [PubMed] [Google Scholar]
- 33.Assari S, Moazen-Zadeh E, Caldwell CH, Zimmerman MA. Racial discrimination during adolescence predicts mental health deterioration in adulthood: gender differences among blacks. Front Public Health 2017;5:104. [DOI] [PMC free article] [PubMed] [Google Scholar]
- 34.Assari S, Mistry R, Lee DB, Caldwell CH, Zimmerman MA. Perceived racial discrimination and marijuana use a decade later; gender differences among black youth. Front Pediatr 2019;7:78. [DOI] [PMC free article] [PubMed] [Google Scholar]
- 35.Statistics Canada Aboriginal peoples in Canada: key results from the 2016 Census. Statistics Canada Catalogue no. 11-001-X. Ottawa, ON: 2017. Available at: dq171025a-eng.pdf (Portable Document Format (PDF), 473.70kB). Accessed December 1, 2018. [Google Scholar]
- 36.Ferrao V. Women in Canada: a gender based statistical report. Vols. 89-503-XWE. Statistics Canada; 2010Available at: http://www.statcan.gc.ca/pub/89-503-x/2010001/article/11387-eng.htm. Accessed December 1, 2018.
- 37.Nelder JA. The selection of rerms in response-surface models: how strong is the Weak-Heredity principle? Am Stat 1998;52:315–8. [Google Scholar]
- 38.Dockery AM. Traditional Culture and the Wellbeing of Indigenous Australians: An Analysis of the 2008 NATSISS. Peth, Australia:Curtin University, Centre for Labour Market Research; 2011. [Google Scholar]
- 39.Brondolo E, Brady Ver Halen N, Pencille M, Beatty D, Contrada RJ. Coping with racism: a selective review of the literature and a theoretical and methodological critique. J Behav Med 2009;32:64–88. [DOI] [PMC free article] [PubMed] [Google Scholar]
- 40.Polanyi K. The Great Transformation: The Political and Economic Origins of Our Times. Boston, MA:Beacon; 1944. [Google Scholar]
- 41.Yip T. Ethnic/racial identity—a double-edged sword? Associations with discrimination and psychological outcomes. Curr Dir Psychol Sci 2018;27:170–5. [DOI] [PMC free article] [PubMed] [Google Scholar]
- 42.Alexander B. The Globalization of Addiction: A Study in Poverty of the Spirit. Oxford, UK:Oxford University Press; 2010. [Google Scholar]
- 43.MacLean S, Ritte R, Thorpe A, Ewen S, Arabena K. Health and wellbeing outcomes of programs for Indigenous Australians that include strategies to enable the expression of cultural identities: a systematic review. Aust J Prim Health 2017;23:309. [DOI] [PubMed] [Google Scholar]
- 44.Berger M, Sarnyai Z. “More than skin deep”: stress neurobiology and mental health consequences of racial discrimination. Stress 2015;18:1–10. [DOI] [PubMed] [Google Scholar]
Associated Data
This section collects any data citations, data availability statements, or supplementary materials included in this article.