Supplemental Digital Content is available in the text
Keywords: bladder cancer, data-driven model, nomogram, overall survival, TNM, validation
Abstract
Bladder cancer (BC) is a common malignancy associated with high morbidity and mortality, however, accurate and convenient risk assessment tools applicable to BC patients are currently lacking. Previous studies using nomograms to evaluate bladder cancer (BC) survival have been based on small samples. Using a large dataset, this study aimed to construct more precise clinical nomograms to effectively predict bladder cancer survival.
Data on patients with pathologically-confirmed bladder cancer were extracted from the Surveillance, Epidemiology, and End Results (SEER) database. Additional BC patient data for an external validation cohort were extracted from the Cancer Genome Atlas (TCGA) database. Clinical parameters that constituted potential risk factors were reviewed and analyzed using univariate and multivariate Cox proportional hazards regression. A nomogram was constructed with parameters that significantly correlated with the overall survival (OS). Prognostic performance of a nomogram was assessed using the concordance index (c-index), area under the receiver operating characteristic curve (AUC), and a calibration curve. The model was then tested with data from an internal and external validation cohort. Patients’ survival was analyzed and compared with the Kaplan-Meier (KM) method.
Multivariate Cox regression showed that age, sex, race, stage_T1, stage_T2a, stage_T2b, stage_T3a, stage_Ta, stage_Tis, stage_N, stage_M were independent predictors of BC survival. A nomogram was constructed based on these factors. The c-index of the nomogram was 0.7916 (95% confidence interval CI, 0.79–0.80). The calibration curve showed excellent agreement between the predicted and observed values. The c-index for the internal validation cohort was 0.7917 (95% CI 0.79-0.80), which was higher than for the training cohort, suggesting robustness of the model. For the training cohort, the AUC for the 3- and the 5-year survival was 0.82 and 0.813, respectively. The c-index for the TNM-based model was superior to that for the AJCC-TNM classification.
The models presented in this study might be suitable for clinical use, supporting clinicians in their individualized assessment of expected survival in BC patients. They might also be used as a layered tool for clinical research.
1. Introduction
Bladder cancer (BC) is a common urinary malignant tumor,[1] characterized by high morbidity and mortality. In 2018 in the United States (US) alone, there were 81,190 newly-diagnosed BC cases, and 17,240 BC-attributable deaths.[2] Approximately 25% of BC patients present with muscle-invasive BC or metastatic disease, while 75% present with non-muscle invasive BC (NMIBC).[3] The proportion of patients with NMIBC is relatively high; however, the high rate of recurrence (70%) in low- and intermediate-risk disease, and the fairly high rate of progression to muscle-invasive disease (30%) in high-risk NMIBC are cause for concern.[4–6] The majority of BC cases occur in people aged over 60. The main risk factor for BC is increasing age, but smoking and exposure to some industrial chemicals have also been reported as risk factors.[7]
Numerous staging systems have been proposed for urinary bladder carcinoma and the most commonly used is the American Joint Committee on Cancer (AJCC) staging system.[8] The eighth edition of the US Joint Commission on Cancer (AJCC) staging manual, has established a tumor node metastasis (TNM) classification system, which indicates increasing understanding of the pathophysiology of BC and applicable treatments. This staging system is currently widely used in making prognostic estimates and treatment decisions in clinical practice.[9] However, there is evidence to suggest that patients with the same pathological grade or clinical staging of BC might still have different prognosis and ultimate survival. This further suggests existence of factors not directly related to the characteristics of BC that might affect patients’ prognosis. To predict survival accurately and reliably, the use of nomograms has been proposed. A method based on more refined TNM staging for predicting individualized survival of bladder cancer patients is required, and a nomogram is a good method for this purpose. Nomograms are based on the TNM staging system, and other key prognostic factors associated with patient survival, and have been applied as a layered tool in clinical research on prostate, breast, gastric, and colorectal cancer.[10–13] Analysis of these nomograms has led to identifying potential survival prognostic factors. Overall, using the c-index, these models are considered to surpass clinical judgment when predicting patient survival.[10,14] Within BC research, previous studies have found potential prognostic factors through the construction of novel nomograms; for example, age, stage, grade,[15] tumor size, lymphovascular invasion, variant histology,[16] genetic variants (smad6, fn1, galectin-9, p53, pRB, p21, p27, and cyclin E1),[17–19] and hemocyte type (hemoglobin, albumin, lymphocyte, and platelet type) have been identified using this approach.[20] However, to assess accurately the prognosis of BC patients, studies involving a large number of patients, and internal and external validation datasets, are required. To our knowledge, this study is the first attempt to construct a clinical nomogram for bladder cancer survival, using a large database. We further construct a population-based survival-predicting model with internal validations. In addition, we used a TCGA cohort to externally validate the nomogram.
2. Materials and methods
2.1. Patients and study design
We identified BC cases from the Surveillance, Epidemiology, and End Results (SEER) database of the National Cancer Institute (http://seer.cancer.gov/) before we signed Research Data Agreement is on file at SEER. We are allowed to utilize the SEER∗Stat client-server system and/or download the files which make up the SEER Research Data. To be included in the study, patients had to have had pathologically-confirmed BC recorded in one of the 18 SEER-covered registries at any point during the database's coverage (1973-2015). We extracted data on the patients’ age, sex, race, stage (T/N/M), survival time, and mortality. Patients were excluded if any of the data was missing or incomplete. We used an internal verification method to randomly divide our dataset into 2 cohorts (training and a validation cohort at ratio 7:3). In addition, we also extracted data on 130 patients from the Cancer Genome Atlas (TCGA) (https://portal.gdc.cancer.gov), which is a publicly available database, using as an external validation cohort. The clinical information of BC is publicly available in the SEER and TCGA program, so the approval of local ethics committee was not needed.
2.2. Statistical analysis
First, univariate Cox regression analysis including selected parameters was carried out. Second, independent prognostic factors were identified in multivariate Cox proportional hazards regression analysis. Third, a nomogram based on these prognostic factors was constructed base on the training cohort data.
The Cox proportional hazard regression model was used to estimate the hazard ratio (HR), and the corresponding 95% confidence interval (CI), for each of the potential risk factors. The multivariate Cox regression model was constructed with a nomogram predicting 3- and 5-year BC survival. Validation of the nomogram was performed using the c-index, the area under the receiver operating characteristic curve (AUC), and the calibration curve. The nomogram-predicted survival probability was compared with observed survival probability, calculated with the Kaplan–Meier (KM) method. The c-index was used to estimate the predictive accuracy and discrimination ability of each factor as well as of the overall nomogram: the higher the c-index, the better its prognostic accuracy. The receiver operating characteristics (ROC) curves are similar to the c-index, but are considered less suitable for use with censored data. The calibration curves were used to assess the nomogram-predicted 3- and 5-year survival with the observed 3- and 5-year survival. Patients were divided into high-risk and low-risk with the cut-off value set at the median risk, estimated in the KM analysis. To achieve this, we estimated an optimism-corrected calibration curve with a bootstrapped sample of 1000. Data extraction was performed using the SEER∗Stat software version 8.3.5. Statistical analyses were performed using R software version 3.5.3 (http://www.r-project.org) with the RMS, survival, and foreign statistical packages. For all of the analyses, a two-tailed P value < .05 was considered statistically significant.
3. Results
3.1. Patient characteristics
Data on a total of 398,173 patients were extracted from the SEER database, according to the screening criteria. Subsequently, data from 332,202 patients were excluded, as they had not been assigned accurate parameters. The final sample included 65,971 patients in the entire cohort (Table 1). Subsequently, the cohort was divided and a total of 46,179 (70%) patients were included in the training cohort, while 19,792 (30%) patients were included in the internal validation cohort. The external validation cohort included 130 patients from the TCGA (Table 2). The clinicopathological characteristics of the training and validation cohorts are shown in Table 1. The median survival time for BC patients in this sample was 38 months, with the specific 3- and 5-year survival rates at 52% and 13%, respectively (Fig. 1) in the SEER cohort.
Table 1.
Characteristics of 65,971 patients with Bladder Cancer in SEER.
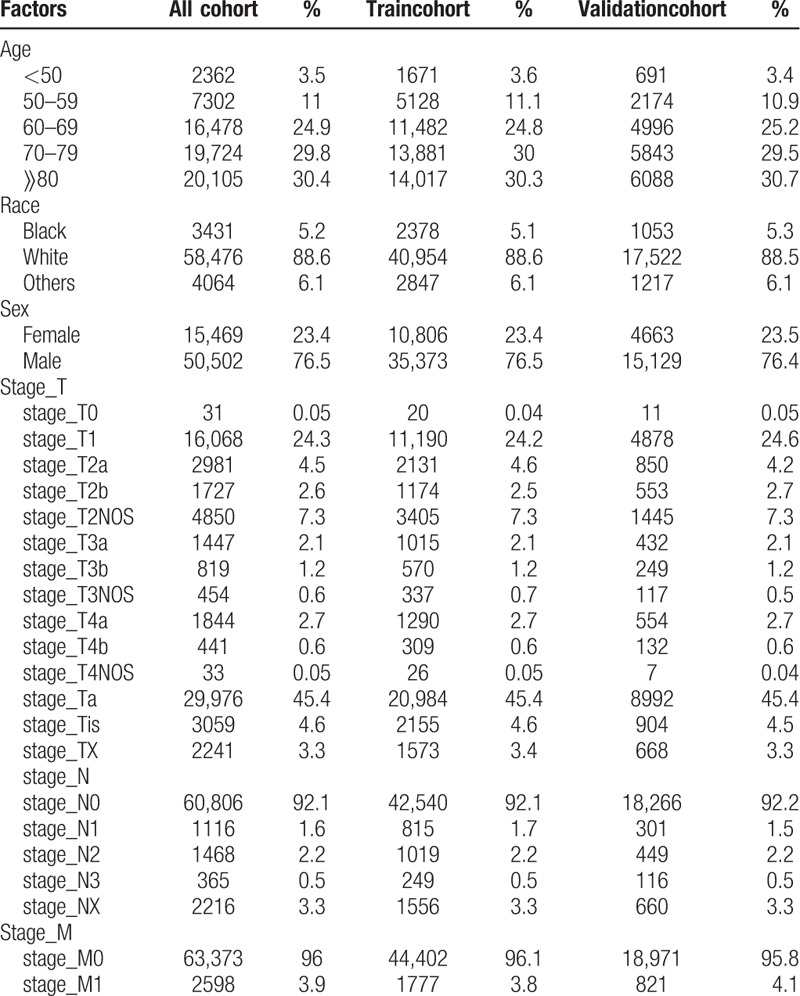
Table 2.
Characteristics of 130 patients with Bladder Cancer in TCGA.

Figure 1.

Kaplan–Meier survival plot for gender.
3.2. Independent bladder cancer survival prognostic factors
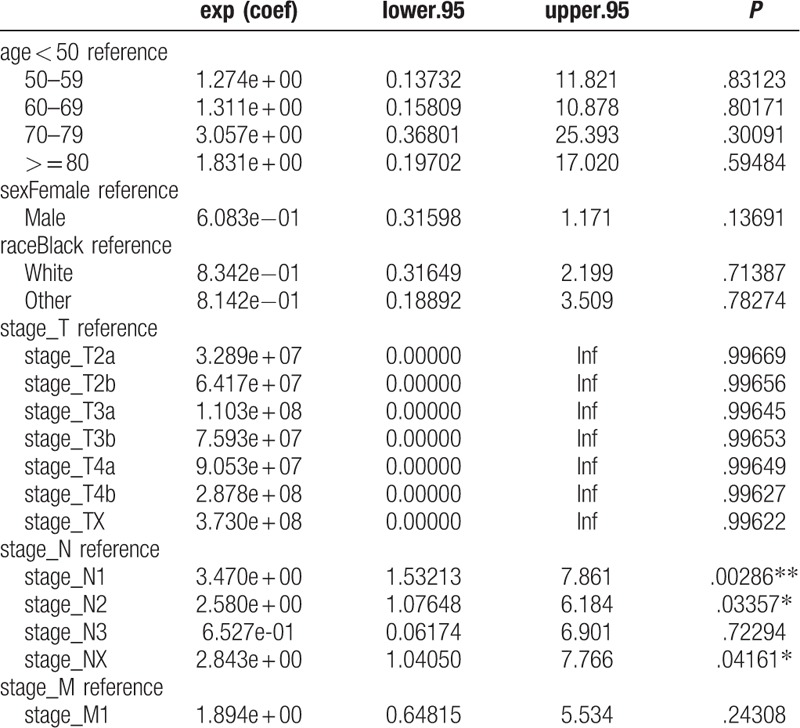
Univariate Cox regression analysis of the training cohort revealed a role of the following parameters in predicting patient survival. Factors such as age, sex, race, stage_T1, stage_T2a, stage_T2b, stage_ T2NOS, stage_ T3a, stage_T3b, stage_T3NOS, stage_T4a, stage_Ta, stage_Tis, stage _TX, stage_N, stage_M were associated with patients’ prognosis. Among these factors, stage_T (c-index = 0.729) and age (c-index = 0.645) each had superior discrimination power in predicting BC survival compared with other factors. The results of multivariate analyses, with stepwise models including risk factors identified as significant in univariate analysis, showed that age, sex, race, stage_T1, stage_T2a, stage_T2b, stage_T3a, stage_Ta, stage_Tis, stage_N, and stage_M were independent predictors of BC survival (Tables 3 and 4). These factors were subsequently included in the predictive model. In the analysis of the TCGA data used for external validation, only lymph node metastasis was associated with survival (Table 5).
Table 3.
Overall survival stratified by clinical characteristics and univariate Cox proportional hazard analyses for patients with Bladder Cancer.
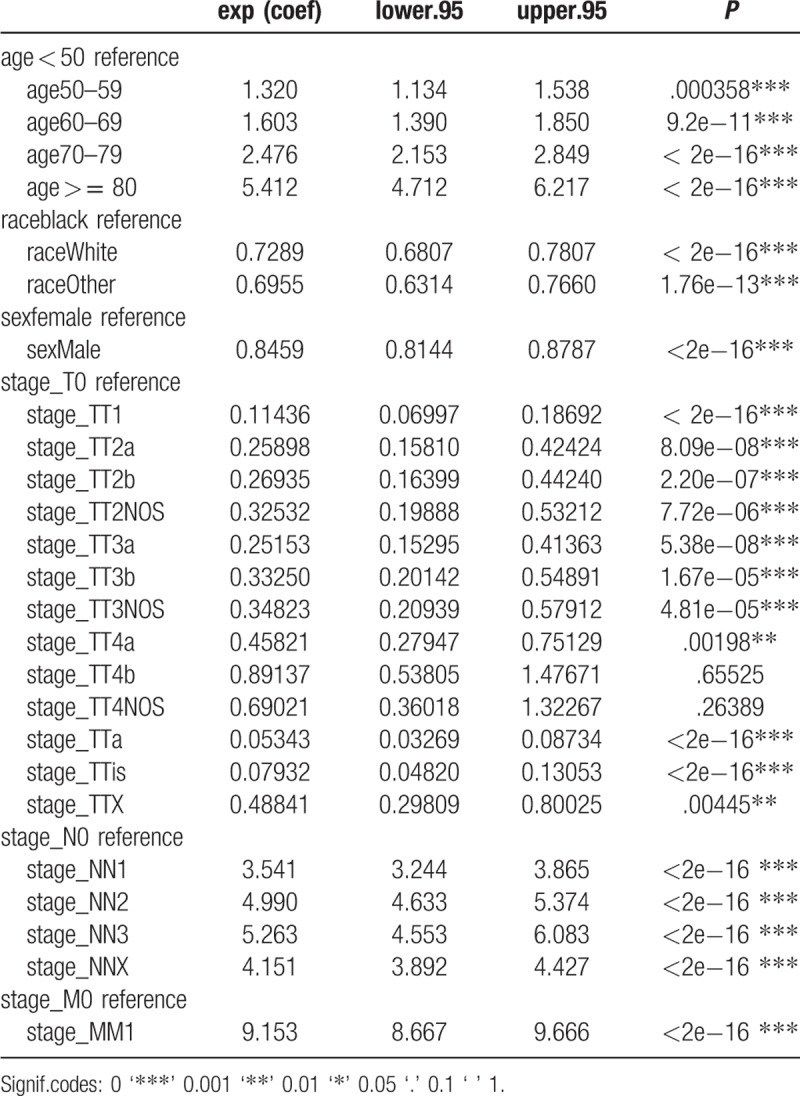
Table 4.
Multivariate Cox proportional hazard analyses of clinical characteristics for overall survival rates in patients with Bladder Cancer.
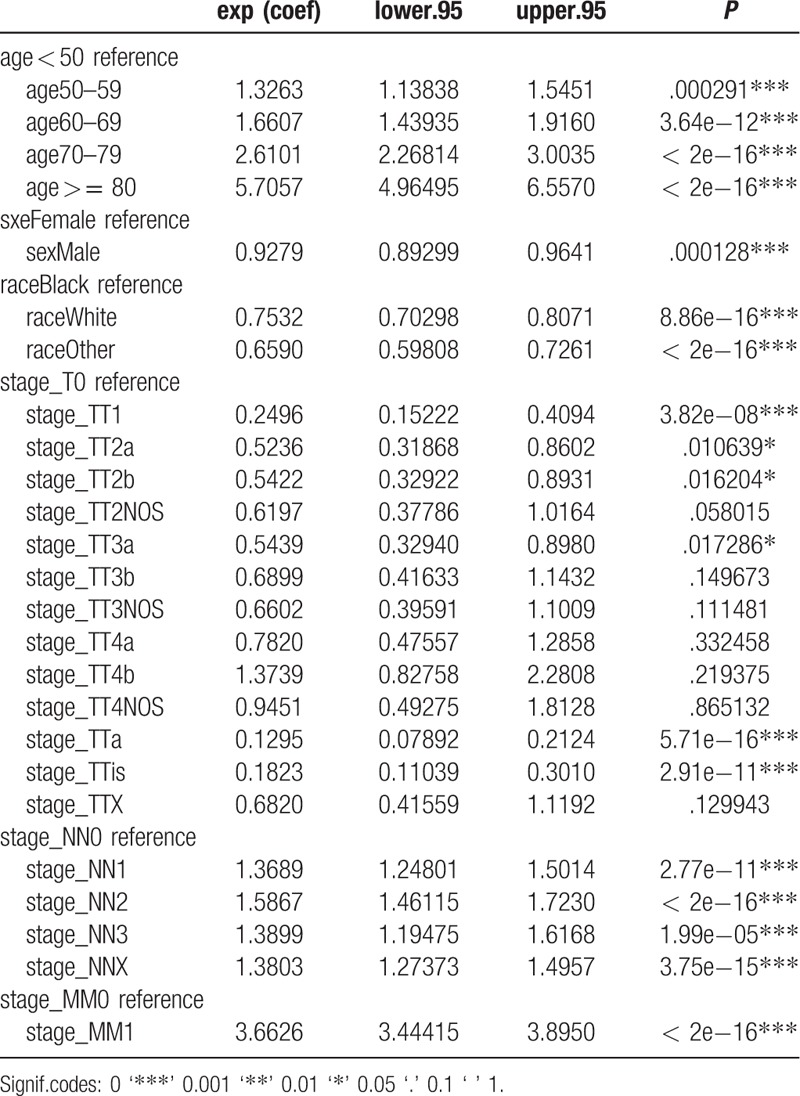
Table 5.
Multivariate Cox proportional hazard analyses of clinical characteristics for overall survival rates in TCGA cohort.
3.3. Prognostic nomogram for OS
Predictive models with nomograms integrating all factors affecting survival in the training cohort are shown in Figure 2. Each prognostic parameter was assigned a score according to its prognostic value; the sum total of the scores was used to predict 3- and 5-year survival. The total score for all the variables was converted into an estimate of the probability of death. The c-index of the prognostic nomogram for overall survival prediction was 0.7916 (95% CI, 0.79–0.80) in the training cohort, and 0.7917 (95% CI, 0.79–0.80) in the internal validation cohort. The validation set was superior to the training set, indicating the robustness of the model. The AUCs for the 3- and 5-year survival were 0.82 and 0.813, respectively, in training cohort (Fig. 3A, B). The AUC combined with the c-index reflected good discrimination ability of the model. The calibration curves estimating survival probability at 3 and 5 years showed excellent agreement between the nomogram-predicted and observed values (Fig. 4A, B). When patients were divided into high-risk and low-risk groups, with median risk used as the cutoff point, the survival curves showed significant differences in prognosis. The 3- and 5-year survival rates for the low-risk group were 85% and 80%, respectively; the same outcomes for the high-risk group were 45% and 35%, respectively (Fig. 5A). Age was strongly predictive of BC survival (Fig. 5B), as was race (Fig. 5C). The 3- and 5-year survival rate for men and women with BC was comparable (Fig. 5D). Lymph node metastasis and the number of the lymph nodes affected as well as the number of distant metastases were also key factors in 3- and 5-year survival outcomes.
Figure 2.
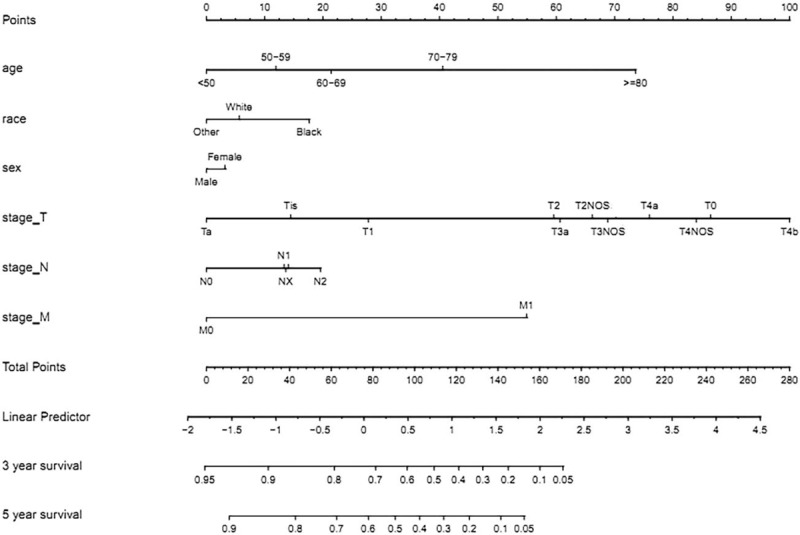
Nomogram predicting the 3-year and 5-year OS for bladder cancer patients. The nomogram summed the points identified on the scale for each variable. The total points projected on the bottom scales indicate the probabilities of 3- and 5-year overall survival.
Figure 3.
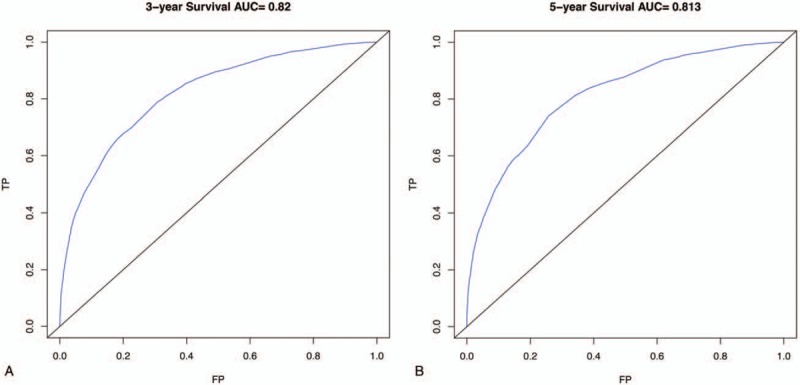
Area under the curves to predict overall survival at 3 years (A) and 5 years (B) using train cohort.
Figure 4.
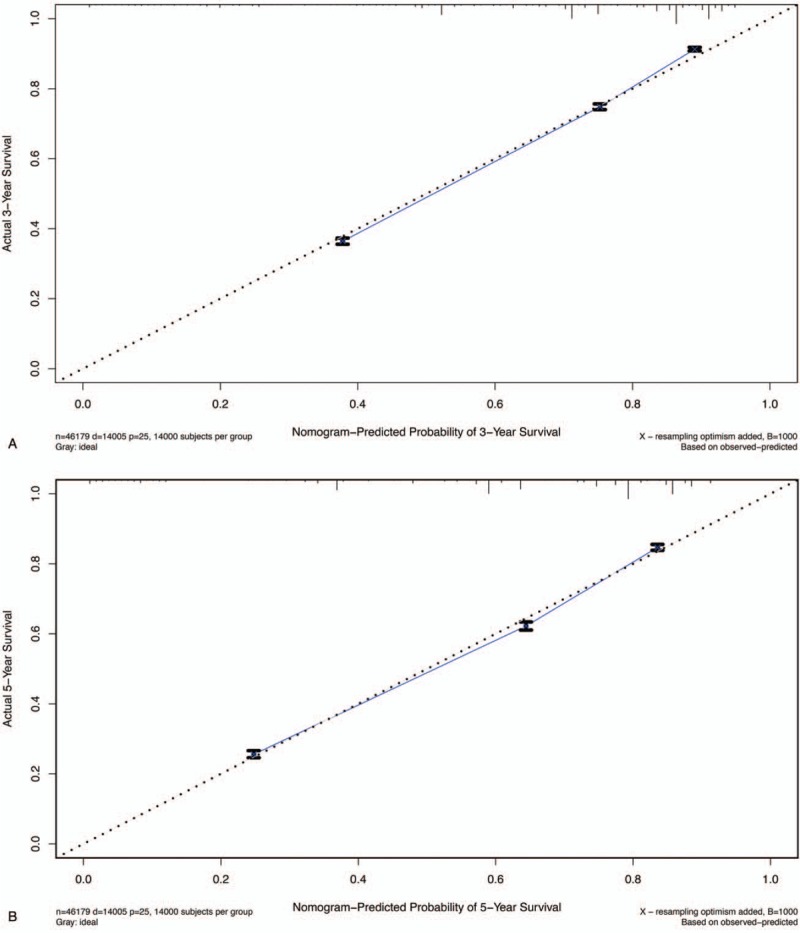
The calibration curves for predicting patient survival at (A) 3-year and (B) 5-year in the train cohort. Nomogram-predicted survival is plotted on the x-axis, and the actual survival is plotted on the y-axis.
Figure 5.
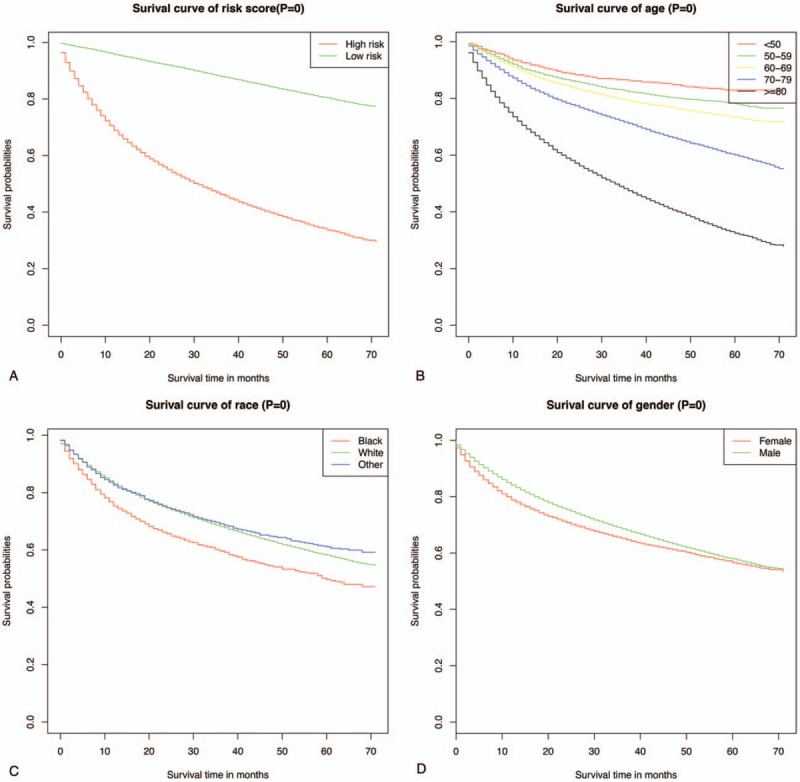
Predicted probability of overall survival by risk (A), age (B), race (C), sex (D) shown using Kaplan–Meier curve.
3.4. Validation of the nomogram's predictive accuracy
In the internal validation cohort, the c-index of the prognostic nomogram for overall survival was 0.7917, which was slightly higher compared to the training cohort (0.7916), suggesting high discrimination ability of the model. The c-index of the external validation cohort was 0.724 (95% CI, 0.66–0.79). The AUCs, an indicator of a model's discrimination ability, were 0.815 and 0.803 for the 3- and 5-year survival, respectively, in the internal validation cohort (Fig. 6A, B). The calibration plots showed excellent agreement between the internal and external validation cohorts (Fig. 7 A–D). The c-index for the TNM-based model was superior to that for the AJCC-TNM classification-based model Whether it's the SEER training cohort (TNM-based model: 0.7916, 95% CI, 0.79–0.80 vs AJCC-TNM:0.739, 95% CI, 0.73–0.74) (see Table 1, Supplemental Content, which illustrates the c-index for the TNM-based model in SEER) (see Table 2, Supplemental Content, which illustrates the c-index for the AJCC-TNM classification-based model in SEER) or in the TCGA cohort (TNM-based model: 0.724, 95% CI, 0.66–0.79 vs AJCC-TNM: 0.689, 95% CI, 0.61–0.77) (see Table 3, Supplemental Content, which illustrates the c-index for the TNM-based model in TCGA cohort)(see Table 4, Supplemental Content, which illustrates the c-index for the AJCC-TNM classification-based model in TCGA cohort).
Figure 6.

Area under the curves to predict overall survival at 3 years (A) and 5 years (B) using the internal validation cohort.
Figure 7.

The calibration curves for predicting patient survival at (A) 3-year and (B) 5-year in internal validation cohort, and at (C) 3-year and (D) 5-year in external cohort. Nomogram-predicted survival is plotted on the x-axis, and the actual survival is plotted on the y-axis.
Figure 7 (Continued).
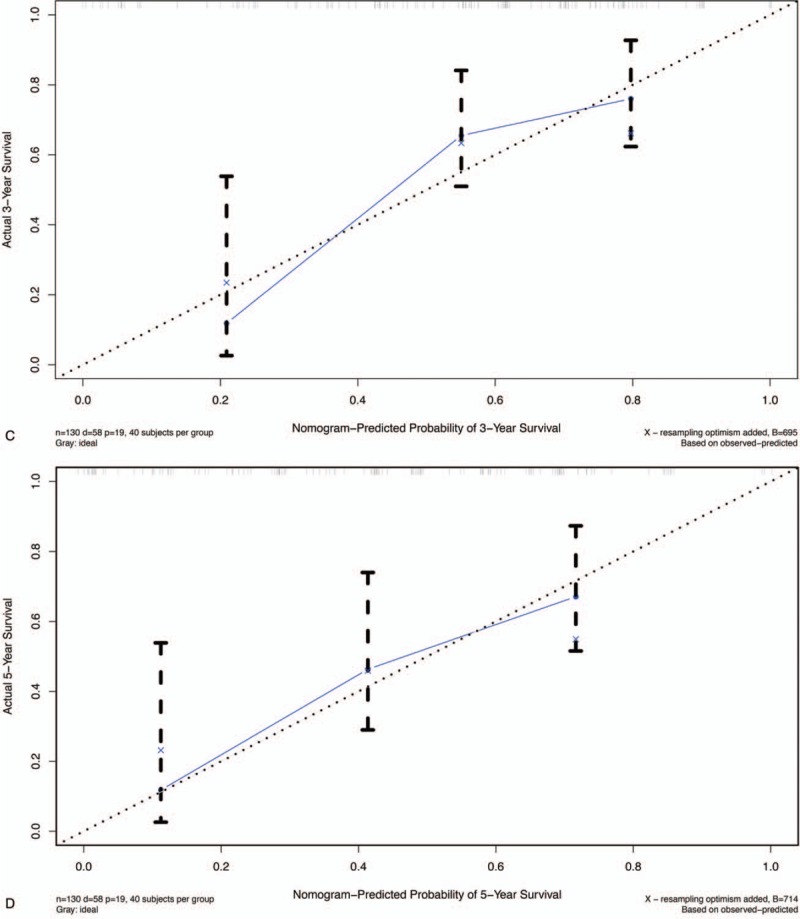
The calibration curves for predicting patient survival at (A) 3-year and (B) 5-year in internal validation cohort, and at (C) 3-year and (D) 5-year in external cohort. Nomogram-predicted survival is plotted on the x-axis, and the actual survival is plotted on the y-axis.
4. Discussion
Urothelial carcinoma of the urinary bladder is a heterogeneous disease with multiple possible treatment modalities and a wide spectrum of clinical outcomes. Nomograms are considered a reliable graphical calculation model that combines all risk factors for tumor occurrence and have been used to predict individual risks of particular events.[21,22] A tool that accurately evaluates the likelihood of metastatic progression, cancer-specific complications and mortality as well as long-term quality of life is important in patient counseling and decision-making.
The model presented in this study was based on more than 60,000 patients from the SEER database and 130 patients in TCGA database. In this retrospective study, we evaluated the clinicopathological parameters of BC and independent prognostic factors that might have affected survival of patients included in the SEER database. We showed that age, sex, race and stage_T1, stage_ T2a, stage_T2b, stage_T3a, stage_Ta, stage_Tis, stage_N, stage_M were independent prognostic factors. In addition, in multivariable analyses, we demonstrated that older age as well as more advanced T and N stages were independently associated with lower overall survival in BC.
Given these independent prognostic factors, we constructed a novel nomogram that combined TNM staging with some clinical parameters. The nomogram illustrated that age, the T stage, and M stage are the most significant contributors to prognosis, while gender and the N stage showed limited impact on outcomes. In addition, over the age of 60 years, for every 10 years of age, the risk of mortality increased multifold. The multivariate analysis revealed that age was the main determinant of a high-risk prognosis, followed by distant and lymph node metastases, and tumor invasion of the abdominal and pelvic wall. Nevertheless, age remains the most significant risk factor for BC mortality, as most BC cases occur among people over 60 years old. Other risk factors, such as smoking and exposure to some industrial chemicals, which have been shown to increase BC risk, should be accounted for in patient assessment. Our nomogram revealed an unexpected finding; in this study, some of the stage_T (T3b, T4a, T4b) sub-categories were not independent prognostic factors.
The TNM staging systems are commonly used for predicting patient prognosis. However, even in patients with the same stage of BC, there might be significant differences in prognosis and survival. In the present study, we developed a pictogram that predicts the overall survival. We observed that the c-index for the TNM-based model was superior to that for the AJCC-TNM classification (SEER training cohort: 0.7916 vs 0.739, P < .05; TCGA cohort: 0.724 vs 0.69, P < .05). The findings presented in this study demonstrate the differences in the clinical value of the distinct risk evaluation systems, TNM- and AJCC-TNM-based systems, in estimating overall survival in BC patients. Moreover, the nomogram based on the TNM staging system was more effective in predicting patients’ survival.
Meanwhile, the c-index for the TNM-based model in the validation cohort was slightly higher than for the internal training cohort based on high level score (training cohort 0.7916 vs internal validation cohort 0.7917), indicating that the nomogram we constructed was robust and accurate. The c-index for the external cohort was 0.724 (95% CI, 0.66–0.79). Although the c-index for the external validation cohort was not higher than the c-index for the training cohort (0.724), it was sufficient to confirm the stability and reliability of the prognostic model.
Calibration plots demonstrated excellent agreement between the nomogram-predicted and observed survival, which confirmed the validity and reliability of the novel nomogram. In addition, the survival curves showed that although the median survival time was 38 months, most patients did not survive beyond that point.
Regarding specific TNM stages, we found that Ta, Tis, and T1 stages were significant predictors of the overall survival compared to the other T-staging indicators. In clinical practice, BC at any of these three stages is referred to as non-muscular invasive bladder cancer (NMIBC). This suggests that NMIBC might be an independent prognostic factor of BC survival.
In addition, we divided our sample into risk levels based on median risk values derived from the KM curve analysis. Such fine-level grouping can support clinicians in assessing distinct prognoses for seemingly similar patients.
To the best of the authors’ knowledge, this is the first nomogram derived based on a large dataset. The data used originated from the SEER database, ensuring the validity and reliability of our conclusions, as well as the internal and external validity of the nomogram, which offers an improvement in predictive accuracy over previously established models. To verify the value and prevent over-fitting of the present model, it was necessary to verify the novel nomogram.[23–25] We have verified the predictive value of the model by using internal and external validation cohorts.
This study used the SEER and TCGA datasets; several similarities and differences between the TCGA and SEER data were observed. More than half of the patients with BC in the SEER database (60.2%) were over 70 years old, while there were slightly fewer patients in this age group in the TCGA database (49.9%). Men were three times as likely to have BC compared to women (SEER F:M ratio: 23.4% vs 76.5%; TCGA F:M ratio: 20.7% vs 79.2%). As previously reported, the incidence of bladder cancer in men is three to four times higher than in women. Seven percent of all new cancer cases were men, but only women include 2% of new cases of the cancer.[26] This is consistent with our findings. Most patients included in the SEER database were BC stage_Ta (45.4%). In contrast, in the TCGA database, most patients had BC stage_T3b (29.2%). However, T-stage classification was the strongest predictor of survival in our study, as reported by a cohort study based on the international Cancer Database.[27] Given that this was retrospective analysis, the time coverage of the SEER database might have resulted in selection bias.
We used the TCGA database for external validation, as an independent validation cohort is required to confirm the validity and reliability of a nomogram. The c-index of the external cohort was 0.724 (95% CI, 0.66–0.79), while the AUCs, another indicator of discrimination ability, were 0.815 and 0.803, for the 3- and 5-year survival, respectively. Moreover, calibration plots showed excellent agreement with the external validation cohort. Using external validation data provides additional evidence of the reliability, accuracy, and validity of our model. This notwithstanding, the TCGA database does not contain details on clinical diversity factors, such as tumor metastasis sites, tumor size, or surgical methods used during patient treatment. As we were not able to account for these potentially relevant factors, our model might be missing potentially relevant variables that could further improve its predictive value. The Surveillance, Epidemiology, and End Results (SEER) database has been chosen in the current analysis given its high quality as well as large suitable cohort sizes. However, the SEER database is a retrospectively rather than a prospectively maintained resource, which might have biased our analysis or affected it in ways that we were not able to adjust for. At the time of writing, there are prospective, randomized studies underway, which aim to verify the validity and reliability of models predicting overall cancer survival. These studies use sophisticated data modeling, accounting for biochemical and immunological factors, such as tumor markers and genetic variants. However, until these results become available, no additional prognostic factors can be included in the nomogram.
It is worth noting that our model is based on the SEER database, which includes different races, further supporting the potential application of our nomogram to international populations. One of the key advantages of the proposed nomogram is the involvement of parameters that are easy to access and assess, meaning the model can be used in clinical practice without the burden of costs associated with complex tests, for example, tumor markers. Considering the size of the study population, these potential classification factors are unlikely to affect our conclusions. However, this nomogram was based on a retrospective study design; prospective clinical trials are needed to further validate this model.
Despite these limitations, the models presented in this study might be suitable for clinical use, supporting individualized assessment of expected survival in BC patients. They might also be used as a layered tool for clinical research, and evidence for development of interventions aimed at improving the overall survival.
Author contributions
Conceptualization: Ming-En Lin, Xue-Jun He
Data curation: Ying-Kai Hong
Funding acquisition: Ming-En Lin.
Methodology: Ye Zhang, Dong-Wu Zhuang.
Project administration: Ming-en Lin.
Software: Ye Zhang.
Visualization: Dong-Wu Zhuang, Ye Zhang.
Writing – original draft: Ye Zhang.
Writing – review & editing: Ye Zhang.
Supplementary Material
Footnotes
Abbreviations: AJCC = American Joint Committee on Cancer, AUC = the area under the time-dependent receiver operating characteristic curve, BC = bladder cancer, C-index = concordance index, HR = hazard ratio, NMIBC = non-muscle invasive bladder cancer, OS = overall survival, ROC = receiver operating characteristic curve, SEER = surveillance, epidemiology, and end result, TCGA= the cancer genome atlas, TNM = tumor node metastasis, US = United States.
How to cite this article: Zhang Y, Hong Yk, Zhuang Dw, He Xj, Lin Me. Bladder cancer survival nomogram: Development and validation of a prediction tool, using the SEER and TCGA databases. Medicine. 2019;98:44(e17725).
This work was supported by Natural Science Foundation of Guangdong province (2015A030310078), Guangdong Medical Research Foundation (A2018103) and Shantou Science and Technology Fund (2017026).
The authors report no conflicts of interest
References
- [1].Antoni S, Ferlay J, Soerjomataram I, et al. Bladder cancer incidence and mortality: a global overview and recent trends. Eur Urol 2016;71:96–108. [DOI] [PubMed] [Google Scholar]
- [2].Siegel RL, Miller KD, Jemal A. Cancer statistics. CA: Cancer J Clin 2018;68:7–30. [DOI] [PubMed] [Google Scholar]
- [3].Kamat AM, Hahn NM, Efstathiou JA, et al. Bladder cancer. Lancet 2016;388:2796–810. [DOI] [PubMed] [Google Scholar]
- [4].Zuiverloon TCM, de Jong FC, Theodorescu D. Clinical decision making in surveillance of non-muscle-invasive bladder cancer: the evolving roles of urinary ytology and olecular markers. Oncology 2017;31:855–62. [PubMed] [Google Scholar]
- [5].Pietzak EJ, Bagrodia A, Cha EK, et al. Next-generation sequencing of nonmuscle invasive bladder cancer reveals potential biomarkers and rational therapeutic targets. Eur Urol 2017;72:952–9. [DOI] [PMC free article] [PubMed] [Google Scholar]
- [6].Zhan Y, Du L, Wang L, et al. Expression signatures of exosomal long non-coding RNAs in urine serve as novel non-invasive biomarkers for diagnosis and recurrence prediction of bladder cancer. Mol Cancer 2018;17:142. [DOI] [PMC free article] [PubMed] [Google Scholar]
- [7].Bladder cancer: diagnosis and management of bladder cancer: (NICE (2015) Bladder cancer: diagnosis and management of bladder cancer. BJU Int 2017;120:755–65. [DOI] [PubMed] [Google Scholar]
- [8].Amin MB, Greene FL, Edge SB, et al. The Eighth Edition AJCC Cancer Staging Manual: continuing to build a bridge from a population-based to a more “personalized” approach to cancer staging. CA Cancer J Clin 2017;67:93–9. [DOI] [PubMed] [Google Scholar]
- [9].Validation of the Eighth AJCC new substages for bladder cancer among different staging contexts. Clin Genitourin Cancer 2017;15:e1095–106. [DOI] [PubMed] [Google Scholar]
- [10].Wang X, Mao M, He Z, et al. Development and validation of a prognostic Nomogram in AFP-negative hepatocellular carcinoma. Int J Biol Sci 2019;15:221–8. [DOI] [PMC free article] [PubMed] [Google Scholar]
- [11].Fakhry C, Zhang Q, Nguyen-Tân PF, et al. Development and validation of nomograms predictive of overall and progression-free survival in patients with oropharyngeal cancer. J Clin Oncol 2017;35:4057–65. [DOI] [PMC free article] [PubMed] [Google Scholar]
- [12].Huang L, Balavarca Y, van der Geest L, et al. Development and validation of a prognostic model to predict the prognosis of patients who underwent chemotherapy and resection of pancreatic adenocarcinoma: a large international population-based cohort study. BMC Med 2019;17:66. [DOI] [PMC free article] [PubMed] [Google Scholar]
- [13].Cao J, Yuan P, Wang L, et al. Clinical nomogram for predicting survival of esophageal cancer patients after esophagectomy. Sci Rep 2016;6:26684. [DOI] [PMC free article] [PubMed] [Google Scholar]
- [14].Jiang S, Zhao R, Li Y, et al. Prognosis and nomogram for predicting postoperative survival of duodenal adenocarcinoma: a retrospective study in China and the SEER database. Sci Rep 2018;8:7940. [DOI] [PMC free article] [PubMed] [Google Scholar]
- [15].Cambier S, Sylvester RJ, Collette L, et al. EORTC nomograms and risk groups for predicting recurrence, progression, and disease-specific and overall survival in non-muscle-invasive stage Ta-T1 urothelial bladder cancer patients treated with 1-3 years of maintenance Bacillus Calmette-Guérin. Eur Urol 2016;69:60–9. [DOI] [PubMed] [Google Scholar]
- [16].D Andrea D, Abufaraj M, Susani M, et al. Accurate prediction of progression to muscle-invasive disease in patients with pT1G3 bladder cancer: A clinical decision-making tool. Urol Oncol 2018;36:239. [DOI] [PubMed] [Google Scholar]
- [17].Riester M, Taylor JM, Feifer A, et al. Combination of a novel gene expression signature with a clinical nomogram improves the prediction of survival in high-risk bladder cancer. Clin Cancer Res 2012;18:1323–33. [DOI] [PMC free article] [PubMed] [Google Scholar]
- [18].Liu Y, Liu Z, Fu Q, et al. Galectin-9 as a prognostic and predictive biomarker in bladder urothelial carcinoma. Urol Oncol 2017;35:349–55. [DOI] [PubMed] [Google Scholar]
- [19].Shariat SF, Karakiewicz PI, Ashfaq R, et al. Multiple biomarkers improve prediction of bladder cancer recurrence and mortality in patients undergoing cystectomy. Cancer 2008;112:315–25. [DOI] [PubMed] [Google Scholar]
- [20].Peng D, Zhang CJ, Gong YQ, et al. Prognostic significance of HALP (hemoglobin, albumin, lymphocyte and platelet) in patients with bladder cancer after radical cystectomy. Sci Rep 2018;8:794. [DOI] [PMC free article] [PubMed] [Google Scholar]
- [21].Kluth LA, Black PC, Bochner BH, et al. Prognostic and prediction tools in bladder cancer: a comprehensive review of the literature. Eur Urol 2015;68:238–53. [DOI] [PubMed] [Google Scholar]
- [22].Balachandran VP, Gonen M, Smith JJ, et al. Nomograms in oncol- ogy: more than meets the eye. Lancet Oncol 2015;16:e173–80. [DOI] [PMC free article] [PubMed] [Google Scholar]
- [23].Liang W, Zhang L, Jiang G, et al. Development and validation of a nomogram for predicting survival in patients with resected non-small-cell lung cancer. J Clin Oncol 2015;33:861–9. [DOI] [PubMed] [Google Scholar]
- [24].Wei JH, Feng ZH, Cao Y, et al. Predictive value of single-nucleotide polymorphism signature for recurrence in localised renal cell carcinoma: a retrospective analysis and multicentre validation study. Lancet Oncol 2019;20:591–600. [DOI] [PubMed] [Google Scholar]
- [25].Fang C, Wang W, Feng X, et al. Nomogram individually predicts the overall survival of patients with gastroenteropancreatic neuroendocrine neoplasms. Br J Cancer 2017;117:1544–50. [DOI] [PMC free article] [PubMed] [Google Scholar]
- [26].Ahmadi M, Ranjbaran H, Amiri MM, et al. Epidemiologic and socioeconomic status of bladder cancer in mazandaran province, northern Iran. Asian Pac J Cancer Prev 2012;13:5053–6. [DOI] [PubMed] [Google Scholar]
- [27].Wakai K, Utsumi T, Yoneda K, et al. Development and external validation of a nomogram to predict high-grade papillary bladder cancer before first-time transurethral resection of the bladder tumor. Int J Clin Oncol 2018;23:957–64. [DOI] [PubMed] [Google Scholar]
Associated Data
This section collects any data citations, data availability statements, or supplementary materials included in this article.


