Abstract
We investigated the epidemiological and clinical characteristics deaths from road traffic injury (RTI) in Beijing, and provided evidence useful for the prevention of fatal traffic trauma and for the treatment of traffic-related injuries.
We retrospectively reviewed death cases provided by the Beijing Red Cross Emergency Center on road traffic injury deaths from 2008 to 2017. We analyzed population characteristics, time distribution, distribution of transportation modes, intervals to death, locations and injured body parts.
From 2008 to 2017, there were 3327 deaths from RTI recorded by the Beijing Red Cross Emergency Center, with mainly males among these deaths. The average age at death was 46.19 ± 17.43 years old (46.19, 0.43–100.24). In accidents with more detail recorded, pedestrians and people using nonmotorized transportation modes suffered the most fatalities (664/968, 68.60%). The most commonly injured body parts were the head (2569/3327, 77.22%), followed by the chest (180/3327, 5.41%), abdomen (130/3327, 3.91%), lower extremities (68/3327, 2.04%), pelvis (67/3327, 2.01%), spinal cord (31/3327, 0.93%), and upper extremities (26/3327, 0.78%). Burns accounted for 0.96% (32/3327), and unknown body parts were affected in 11.28% (365/3327). The average time interval from injury to death was 36.90 ± 89.57 h (36.90, 0–720); 46.7% (1554/3327) died within 10 minutes after injury; 9.02% (300/3327) died between 10 min and 1 hour; 30.33% (1009/3327) died between 1 hour and 3 days; 13.95% (464/3327) died between 3 and 30 days.
In Beijing, RTI is a significant cause of preventable death, particularly among pedestrians and users of non-motorized vehicles. Head trauma was the most lethal cause of RTI deaths. Our findings suggested that interventions to prevent collisions and reduce injuries, and improved trauma treatment process and trauma rescue system could address a certain proportion of avoidable RTI deaths.
Keywords: death analysis, road traffic injuries, trauma care
1. Introduction
Road traffic injury (RTI) has become a global public health problem. According to World Health Organization (WHO) data,[1,2] nearly 1.3 million people die from road traffic accidents every year worldwide, and nearly 90% of road traffic injury deaths occur in low- and middle-income countries, which have fewer than half the total number of registered vehicles around the world. Road traffic injuries are expected to become the fifth leading cause of death in the world by 2030 if no effective action is taken.[1,3,4] At present, high-income countries pursue the most research and implement more interventions in preventing RTI than low- and middle- income countries. The experience of these countries shows that RTI can be prevented or reduced to a large extent by effective intervention.[5] However, because of different road use characteristics, experiences in high-income countries may not be applicable to low- and middle-income countries. Therefore, the prevention of traffic injuries is an important public health problem in developing countries. Furthermore, reducing the number of road casualties requires continuous intervention based on the analysis of high-quality road safety data.[6]
As the largest developing country in the world, China has a heavy RTI burden as its economy and society develop rapidly, more new roads are being built, and the numbers of motor vehicles and drivers grow. Beijing, as the capital city of China with over 20 million residents, has the patterns of urbanization and the characteristics of RTI that widely represent most large Chinese cities with similar settings. Analysis and study of the characteristics and patterns of road traffic deaths in Beijing will provide experience and data support for the prevention and treatment of traffic trauma in Beijing and other cities with similar settings. This article reviews and analyzes the characteristics and patterns of road traffic deaths in Beijing and the related epidemiological and clinical features of the traffic trauma deaths, aiming at providing support for the prevention and treatment of traffic injuries that result in fatality, which can be useful not only for Beijing but also other cities with similar situations.
2. Methods
2.1. Study population
Research in context
Evidence before this study
We searched PubMed and the China National Knowledge Infrastructure for articles published before December, 2018, by using the following search terms for titles and abstracts: ("death" AND "road" AND "traffic" AND "analysis") OR ("fatalities" AND "road" AND "traffic" AND "analysis"). We screened papers by reviewing abstracts to identify full-text reports that were relevant to the study aims. There were 161 papers involving these key words. Previous studies have reported that the effective measures taken by developed countries in the past 40 years have significantly reduced trauma as well as some deaths. However, because of insufficient research on traffic trauma prevention and treatment in low- and middle-income countries, road traffic trauma has a higher mortality rate compared with developed countries. So study of the characteristics of fatalities caused by traffic trauma in low- and middle-income countries is of great importance in preventing the occurrence of fatal accidents and in treating trauma patients.
Added value of this study
A total of 3327 patients were studied from a time span of ten years. Through the analysis of these deaths, we summarize the time distribution of fatal accidents, distribution of road use modalities, and location of death. We also clarify the distribution of injured body parts in different time periods after the accidents as well as time interval from injury to death. These findings will provide data support for improving the prevention of traffic accidents and treatment of injuries due to them in Beijing and other places with similar settings.
Implications of all the available evidence
Our data provide confirmatory evidence that of all the people using roads, pedestrians and nonmotorized vehicle users are the most vulnerable groups. We believe that the following elements are important in preventing traffic-related fatalities: improving the traffic safety awareness of all citizens, implementing separation of people and vehicles, improving road traffic facilities, strengthening traffic safety supervision such as using helmets and safety belts properly, establishing a trauma rescue system, and providing prompt and reasonable treatment according to the characteristics of patients’ injuries.
The data in this article were provided by Beijing Red Cross Emergency Rescue Center (999 Emergency Center) which is affiliated with the Beijing Red Cross Society. It is a comprehensive trauma emergency hospital aiming to assist the government in providing pre-hospital and in-hospital medical first-aid protection for all citizens in Beijing. The research objective was RTI deaths from January 1, 2008 to December 30, 2017. The data were reported with death records from Beijing Red Cross Emergency Rescue Center to Beijing Center for Disease Control. The patients’ death information was synchronized with the Beijing Police Bureau's household registration data. The fatalities and related information provided by the institute are traceable. All data are accurate and reliable. The data screening process is shown in Figure 1.
Figure 1.
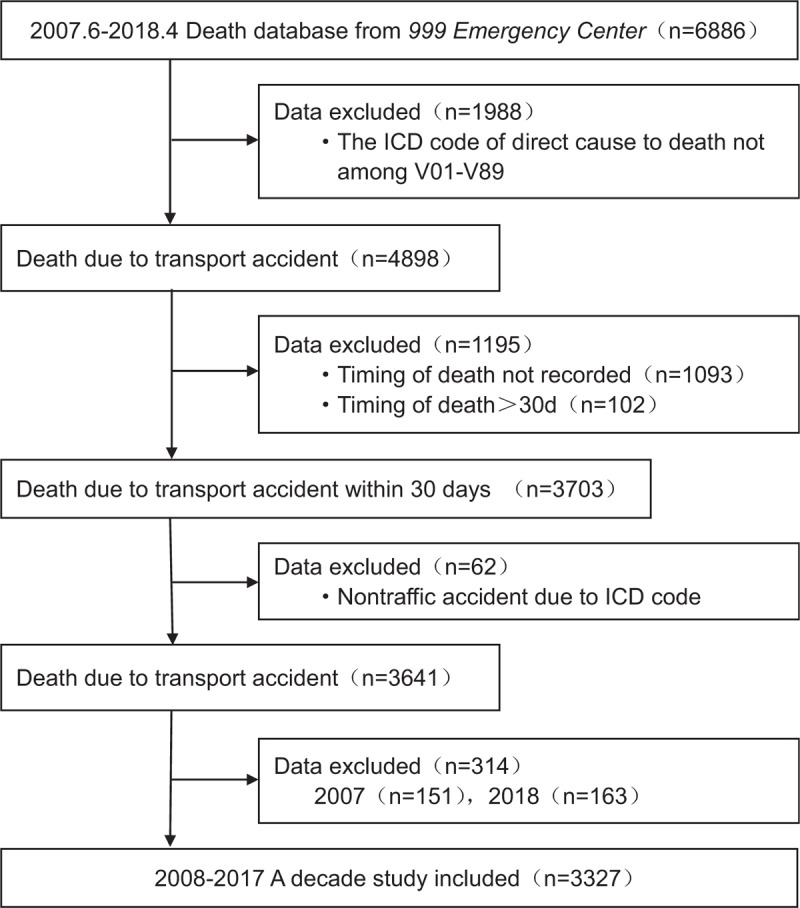
Data screening process.
Data in this study included demographic information, death time, and location and cause of death. The cause of death is based on the ICD-10 code. There are three characteristic figures from V01 to V89 such as V41.5. The cause of death is related to road traffic injury (RTI), which is a transport accident. The number after the decimal point represents the death and whether it is a traffic accident.[7] Death is defined as death on the spot and death within 30 days after the accident.[8,9]
2.2. Coding procedures
For demographic characteristics, we divided the age of people in our study, which is the unique continuous variable, into seven groups according to WHO classification criteria: 0–4, 5–14, 15–29, 30–44, 45–59, 60–69, and 70+. For the record of the death location, a unified code is used in Beijing: 1, hospital ward; 2, emergency room; 3, home; 4, en route to the hospital; 5, in the field and others; and 9, unknown. In the original data coded as 9, since the place of death in most of the situations in our study was the accident site, it is therefore relabeled as “other” places, namely code 5, for a more consistent approach of our statistics.
We used the WHO International Classification of Diseases, tenth revision (ICD-10) code for the purposes of identifying the cause of the traffic accident, and it is a key step in data screening. Under the ICD-10 code system, V01-V89 refer to situations of land transport accidents (compared with accidents on water or in the area). In more detail, the first digit following the letter “V” represents the transportation mode of the injured party, the second digit represents the object with which the injured party collided, and the number after the decimal point clarifies whether it is a traffic or nontraffic accident.[7] The list below sets out the sub-groups under the ICD-10 code system that apply to traffic accident classification:
V01-V09: Pedestrian injured in transportation accident
V10-V19: Pedal cyclist injured in transportation accident
V20-V29: Motorcycle rider injured in transportation accident
V30-V39: Occupant of three-wheeled motor vehicle injured in transportation accident
V40-V49: Car occupant injured in transportation accident
V50-V59: Occupant of pick-up truck or van injured in transportation accident
V60-V69: Occupant of heavy transport vehicle injured in transportation accident
V70-V79: Bus occupant injured in transportation accident
V80-V89: Other land transportation accidents
With respect to the injury locations of the deceased studied by us, we found inconsistency in the ICD-10 codes in the original data, and we therefore artificially screened the Chinese characters recorded in the original reports under section of “disease directly caused death a, b, c, d,” and translated them into a unified substitution code as follows: head = H, chest = C, abdomen = A, pelvis = P, lower limbs = L, upper limbs = U, spine = S, burn = B, and nonspecific = N. Multiple injuries were replaced by multicharacter codes, such as “AC” for abdomen and chest trauma.
With respect to the time interval to death, we reviewed the ICD-10 code between V01 and V89 from the original records of “disease directly caused death a, b, c, d,” and used the “time interval from onset to death” therein as the “time interval to death.” For the data on the deceased having multiple V01–V89 codes, we manually chose the ICD-10 code which had the closest meaning to the Chinese description and used the relevant “time to death interval.” The units of the time interval to death in the original data were not uniform; various time units of “hours,” “days,” and “months” were used, with the minimum unit being “hour”. According to trimodal distribution of trauma deaths[10] and recent related studies,[11,12] we reclassified the “time interval to death” into the following groups in unit of “hour”: death within 10 minutes (0, 1/6), between 10 minutes and 1 hour (1/6, 1), between 1 hour and 3 days (1, 72) and between 3 days and 30 days (72, 720).
2.3. Parameters of interest
In this study, our parameters of interest of fatal road traffic accidents included time distribution, location of death, transportation mode, time interval from injury to death, and injured body parts.
2.4. Statistical analysis
We used statistical method developed from the Cochran-Armitage test[13,14] to test if there is a linear trend in the proportions over the years. Death cases are divided into several groups by some criterion, such as transportation modes, death locations, time intervals to death and injured body parts. Let yi be the number of deaths in one group in the ith year and ni be the total number of deaths in the ith year. Consider the logistic regression model  , where xi is the calendar year. Using the maximum likelihood estimate (MLE) of β and the standard deviation of β, we can construct a statistical test (e.g., Wald test) for the hypothesis H0:β = 0
  versus
  . If H0 is rejected, we can claim there is a statistically significant linear trend in the proportions over the years.
R software version 3.4.0, and Excel (Microsoft Corp., Redmond, WA, USA) were used for data analysis. Continuous variables including age and interval from injury to death were discretized as stated before. Then all categorical variables were summarized as percentages. Data on demographic information and time interval to death for all subjects were expressed as mean ± standard deviation (SD).
2.5. Ethics declaration
Institutional review board of Peking University People's Hospital and Beijing Red Cross Emergency Center approved this study.
3. Results
3.1. Population characteristics
After data cleansing and screening with respect to the data provided by 999 Emergency Center (Fig. 1), we noted that the total number of deaths caused by traffic accidents in Beijing between 2008 and 2017 was 3327. There were 2553 males (76.74%) and 774 females (23.26%), the total consisting of 2323 married people (69.82%), 567 unmarried (17.04%), 223 widowed (6.70%), 157 divorced (4.72%), and 57 unknown (1.71%). The age divisions were: 0–4 years, 16 people (0.48%); 5–14 years, 41 people (1.23%); 15–29 years, 671 people (20.17%); 30–44 years, 884 people (26.57%); 45–49 years, 954 people (28.67%); 60–69 years, 411 people (12.35%), and 70+ years, 350 people (10.52%), with the average age of death being 46.19 ± 17.43 years old (0.43–100.24).
3.2. Time distribution of fatal road traffic accidents
In terms of the annual distribution of traffic accident deaths, the trend in the ten-year time span was in general an increase year over year, growing from a low of 122 in 2008 to 675 in 2017 (Fig. 2A). Looking at the ten-year death tolls on a month-to-month basis, we notice that most deaths occurred in December, with the total number of all December deaths being 323, and the fewest deaths occurred in February, with the total number of all February deaths being 150. Looking at the numbers in the units of weeks, we noticed that the number of deaths generally did not fluctuate much from Mondays to Sundays, with Saturdays having a fairly obviously lower death toll than the other 6 days (Fig. 2B).
Figure 2.
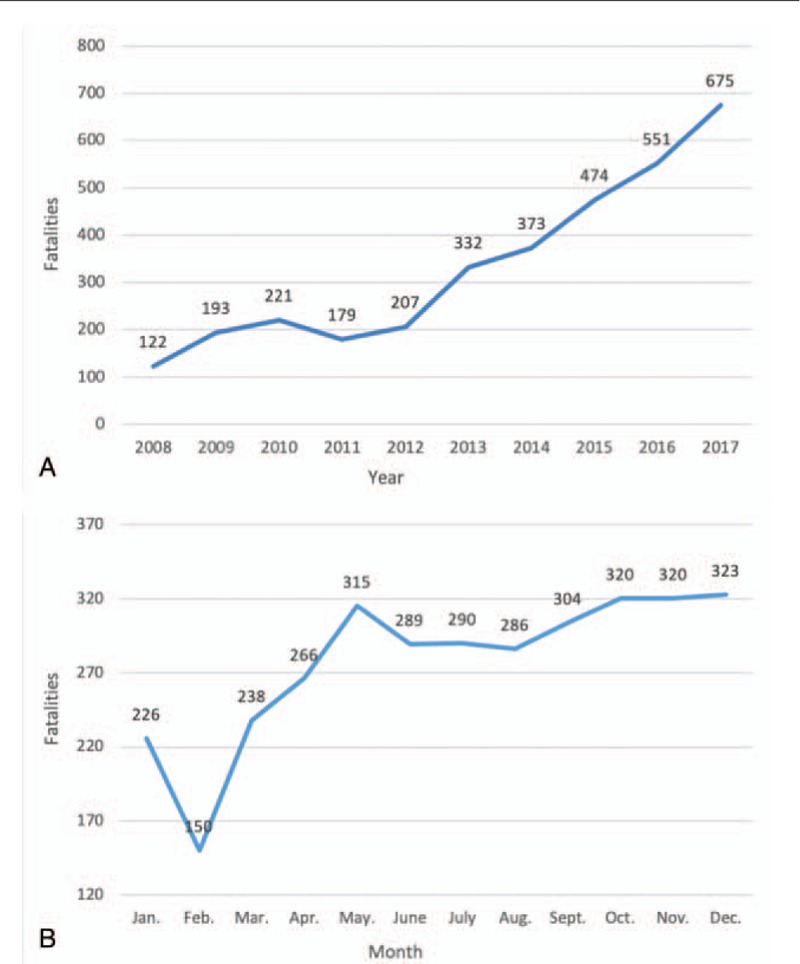
A. Annual distribution of traffic accident deaths. Figure 2b. Monthly and daily distribution of traffic accident deaths.
3.3. Distribution of transportation modes
The 70.90% (2359 cases) of the fatal cases we studied did not include clear record of transportation mode. Among the 968 fatal cases with clear transportation mode records, 363 victims were cyclists (37.50%), 301 were pedestrians (31.10%), 129 were four-wheelers (13.33%), 51 were heavy-duty truck occupants (5.27%), 123 were motorized 2 to 3 wheelers (12.71%), and one was a bus passenger (0.12%). While pedestrian deaths decreased steadily since 2008, cyclists have become the largest group of fatal RTI victims ever since. Among the motor vehicle occupants in the fatal RTIs, drivers (72.86%) were much more likely to be the deceased parties compared with passengers (Fig. 3A-B). And there is a significant trend in each mode proportion over the years (P < .05).
Figure 3.
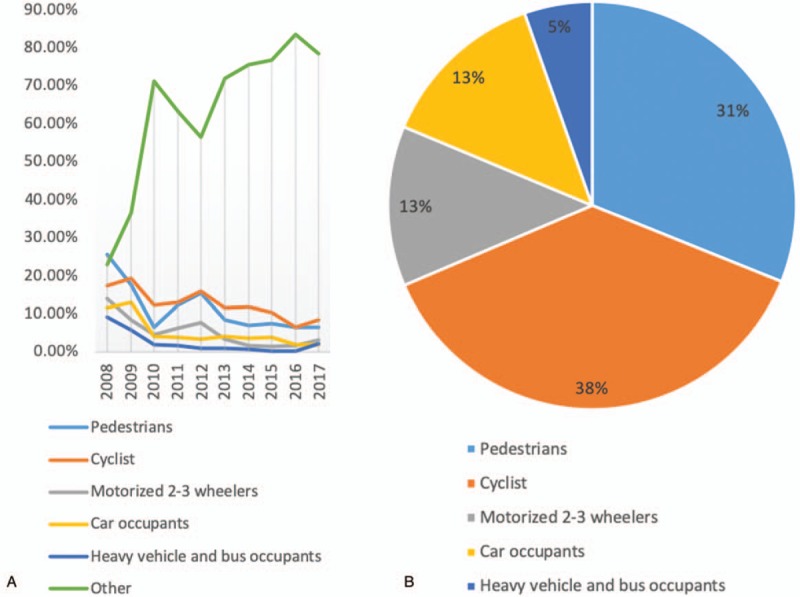
A-B. Distribution of transportation mode in traffic accident deaths.
3.4. Distribution of death locations and injuries
Among the cases we studied, 1793 (53.89%) of the total deaths occurred before the wounded reached the hospital, 182 (5.47%) died in the emergency department, and 1304 (39.19%) died in the hospital wards. Among the 1793 pre-hospital deaths, 1458 patients (81.32%) died from craniocerebral injury, 39 (2.18%) died from chest trauma, three (0.17%) died from abdominal trauma, and the cause of death of the remaining 293 people (16.34%) was unknown. Of the 182 patients who died in the emergency department, 112 (61.54%) died from craniocerebral injury, 35 (19.23%) died from traumatic hemorrhagic shock, and five (2.75%) died from fracture. Of the 1304 patients who died in the hospital ward, 886 (67.94%) died from craniocerebral injury; 178 (13.65%) died from traumatic hemorrhagic shock; and 47 (3.60%) died from fracture, including 22 (46.81%) patients with thoracic and rib fractures, and 14 patients with pelvic fractures (29.79%). And there is a significant trend in proportions of emergency department, hospital wards and pre-hospital over the years (P < .05).
3.5. Distribution of time interval to death
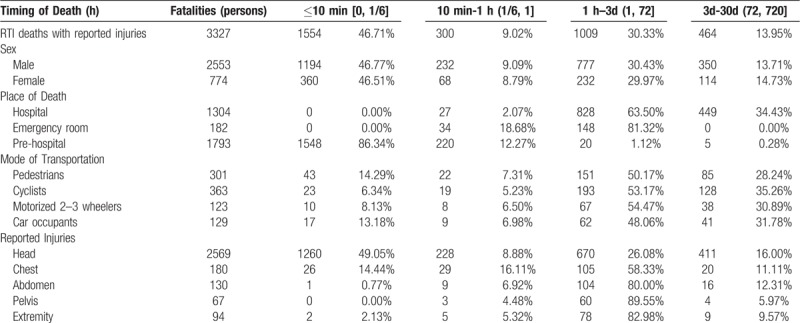
The average time to death was 36.90 ± 89.57 h (0–720 hours). According to the three time peaks of post-traumatic death, we divided the time interval to death into four groups, and we found that 1554 (46.71%) of the deaths occurred within 10 minutes of the accident, 300 (9.02%) died between 10 minutes and 1 hour, 1009 (30.33%) died between 1 h and 3 d, and 464 (13.95%) died between 3 d and 30 d. The multilevel distribution of the time interval to death with respect to such factors as gender, location of death, mode of transportation, and location of injury is shown in Figure 4 and Table 1. And each time interval group proportions showed significant trend over the years (P < .05).
Figure 4.
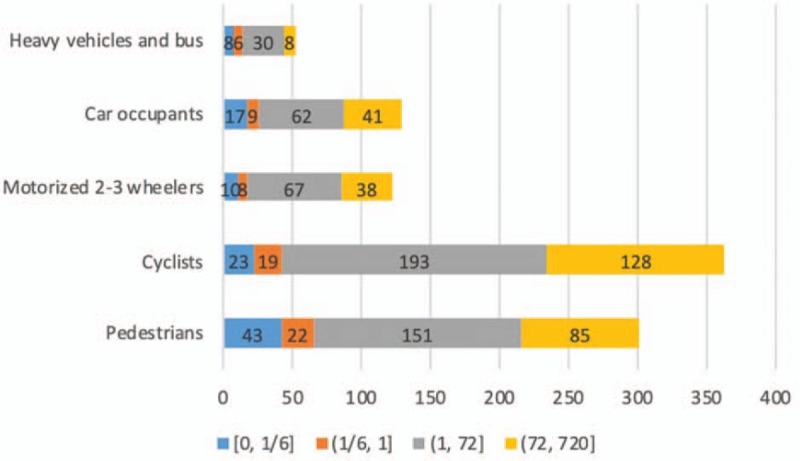
Transportation mode in road traffic injury fatalities and time interval to death statistics.
Table 1.
Time interval to death in road traffic injury fatalities by gender, place of death, mode of transportation, and injuries.
3.6. Distribution of injuries
There were 3235 (97.23%) patients with an isolated injury and 92 (2.77%) with multiple injuries. Among those with isolated injury, 2518 people (77.84%) had head trauma, 124 (3.83%) chest trauma, 105 (3.25%) abdominal trauma, 41 lower limb trauma (1.27%), 40 pelvic trauma (1.24%), 32 had burns (0.99%), 9 spinal cord injury (0.28%), one (0.03%) with upper limb trauma, and 365 (11.28%) had unknown injuries (Fig. 5).
Figure 5.
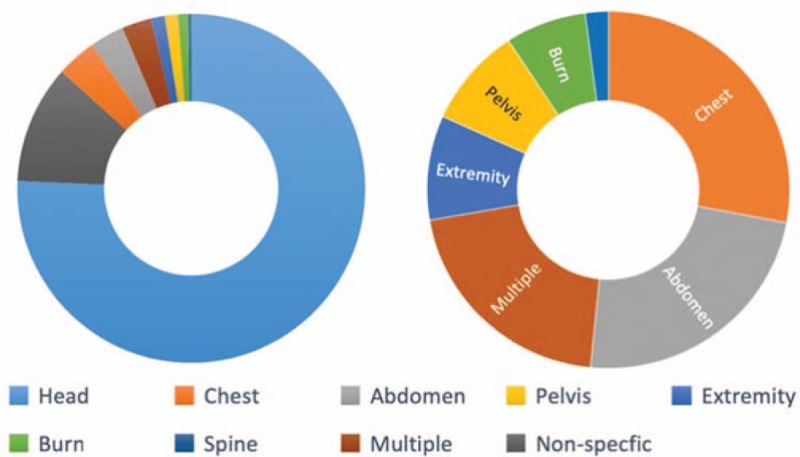
Distribution of injuries in road traffic injury deaths.
Head trauma was the most common injury (77.22%, 2569/3327). Pedestrians (81.73%, 246/301), pedal cyclists (82.09%, 298/363), and those on motorized 2–3 wheelers (78.05%, 96/123) were most likely to suffer from fatal injuries to the head. Comparatively, the occupants (drivers and passengers) of a car (63.57%, 82/129) were less likely to suffer fatal head injuries.
Among the patients who died within 10 minutes after the accident, the proportion of those with head trauma (81.08%, 1260/1554) was significantly greater than patients with chest, abdomen, pelvis, and extremity injuries. Among those who died later, head trauma also comprised the largest proportion among all kinds of trauma. Individuals with trauma to the chest (10.41%, 105/1009), abdomen (10.31%, 104/1009), pelvis (5.95%, 60/1009), and extremities (74.33%, 75/1009), were more likely to die between 1 hour and 3 days after the accident (Table 2).
Table 2.
Reported injuries of road traffic injury fatalities by gender, place of death, timing of death, and mode of transportation.
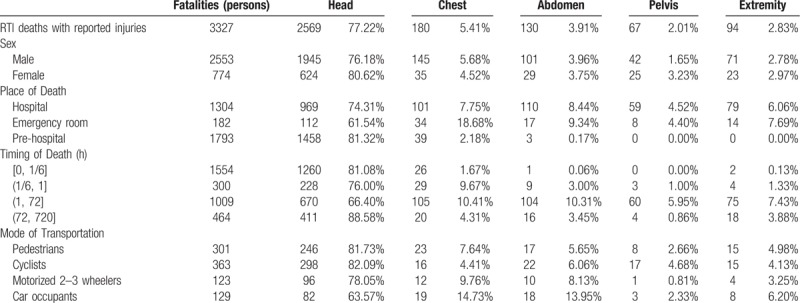
Patients with chest (18.68%, 34/182) or abdominal (9.34%, 17/182) trauma were more likely to die in the emergency department than in other locations.
According to our analysis, there is a significant trend in proportions of each injury part over the years (P < .05).
4. Discussion
RTI is an important threat to public health. Traffic trauma deaths account for 80% of accidental deaths in China.[15] Compared with developed countries, China has a lot to improve in the prevention of and treatment for RTI. According to the latest data published by WHO[8], the death rate from RTI per 100 000 people in China is as high as 18.8, compared with 2.9 in the UK, 4.7 in Japan, 4.3 in Germany, and 10.6 in the United States. With the continuous urbanization, the growing number of motor vehicles, and new drivers, Beijing faces serious traffic safety situations.
Compared with developed countries, Beijing's fatal RTI accidents have their own characteristics. The 2017 data released by the International Traffic Safety Data and Analysis Group[16] showed that, in terms of the age distribution of deaths, the proportion of road users over 65 years old in developed countries increased significantly in 2016 compared with 2010, a more than 17% increase in Germany, France, the United Kingdom, and the United States. However, the results of our study show that the average age of deaths caused by car accidents in Beijing in the decade 2008–2017 was 46.19 ± 17.43 years old, and the proportion of people under 44 years old was as high as 59.54%. Most of the deceased individuals were young males. They are the primary breadwinners of the family and the bulk of the workforce for the society, and they in general have more traffic exposure and therefore are more vulnerable to the danger of RTI. As a result, RTI has far more negative impact on families and society than any other illness in Beijing and other cities with similar settings.[17]
Road traffic deaths in developed countries indicate that the fatality rate of drivers and passengers is significantly higher than for other modes of transportation: 44% in the UK, 47% in Germany, and 68% in the United States.[8,16,18] However, according to the data published by the China Ministry of Transport, pedestrian death in China is 9.5 times than that of drivers and passengers. The results of our study show that nearly two-thirds of the deceased were pedestrians or cyclists. Pedestrian traffic accidents occur mainly at intersections and nearby areas because of poor pedestrian crossing facilities, poor traffic organization management, and road users’ lack of safety awareness. Most pedestrians and pedal cyclists tend to choose a shortcut or a more convenient route. Several studies have documented that pedestrians prefer to cross dangerous roads, and are unwilling to walk a few steps to a crosswalk. Pedestrians’ risk of RTI decreases more than four times when they use designated road-crossing facilities.[19–21] Studies in Denmark have shown that the establishment of dedicated bicycle lanes can reduce the number of cyclist deaths by 35%.[22] Therefore, designating crosswalks (known as “zebra crossings”) and building flyovers, installing traffic barriers, and designating separate nonmotorized lanes can significantly improve the safety protection of pedestrians and other users of nonmotorized transportation modes.
WHO data shows that speed limits can effectively reduce traffic deaths, and Switzerland, the Netherlands, Sweden, the United Kingdom, France, and Germany have reduced the number of deaths from road traffic accidents by 9% to 39% after their imposing vehicle speed limits.[6,8,16] In addition, traffic lights, intelligent traffic management systems, traffic signs, street lights, and other facilities should be improved to optimize the overall traffic supervision level.[23]
While providing more convenient routes for vulnerable road users, Beijing has also implemented speed limits on more roads, and has extensively carried out some campaigns for drivers, such as “No driving after drinking” and “Yield before approaching zebra crossings.” These actions will undoubtedly play a positive role in reducing road traffic accidents and deaths. In addition, according to the different characteristics of road users based on their modes of transportation, road traffic safety education and training should be carried out with emphasis on avoiding vehicle-pedestrian collisions and vehicle and nonmotorized vehicles collisions.[24]
The results of this study show that head trauma is the most common RTIs, representing 77.22% of all the RTIs. Pedestrians, bicyclists, and drivers of 2–3 wheelers are the most likely to receive lethal trauma to the head, while car occupants suffer relatively less damage to the head. In addition, nearly half of the total number of the deceased in our study died within 10 minutes after the accident, 81.08% of whom suffered head trauma. Therefore, it is critical to improve nonmotorized road users’ precaution measures to avoid more fatal tragedies from happening. Studies also show that bike riders who do not wear safety helmets are three times more likely to have head injuries than those wearing them.[25] Safety helmets can reduce lethal and severe head trauma by 20% to 45%.[26] Furthermore, it is important to wear helmets properly and wear good quality helmets that meet the required standards, and we believe that the government should strengthen the supervision of helmet quality and ensure that relevant persons wear helmets according to the law. A study in the United States reported that the use of nonstandard helmets can also be dangerous.[27] Research shows that fewer than 15% of pedal cyclists and electric bike riders in China use safety helmets correctly.[28,29] With respect to vehicle occupants, studies have shown that seat belts can reduce the risk of death for drivers and front seat passengers by 45% to 50%, and the death and serious injury rate of rear seat passengers by 25%.[30,31] Unfortunately, the proportion of seat belt use by Beijing drivers is less than 20%.[32,33] Therefore, enforcement of consistent safety belt use by all vehicle occupants should be implemented.
RTIs often entail severe trauma and multiple injuries. They are highly time-sensitive, and the concept of overall treatment is required in rescuing and treating RTI patients, especially those with severe trauma. The prime time for rescue and treatment is 1 hour after the injury.[34] For patients who are unconscious or comatose after injury, on-the-spot first aid should encompass two points: keeping the airway open and quickly dealing with active bleeding. The medical staff in the emergency department of the hospital should promptly and decisively manage the condition, closely monitor for changes in vital signs as well as pupils and consciousness, and complete a CT scan of the head to determine whether there is craniocerebral injury. A neurosurgeon should be consulted and join the rescue team immediately to assure the recovery of brain function to the greatest extent possible. The more quickly a craniocerebral injury is treated, the better the patient's prognosis.[35–37] While treating craniocerebral trauma, doctors should check the general condition of the patient, especially the chest and abdomen. Nearly one-third of the fatalities occur between 1 h and 3 d after injury. During this interval, while patients with head trauma still represent the most deaths, patients of chest or abdominal injuries reach their respective peak time of death. 58.33% of the deceased of chest trauma and 80.00% of the deceased of abdominal trauma died between 1 hour and 3 days after RTI. During this period of time, patients should be monitored for occult or delayed chest and abdominal organ damage resulting from the trauma. After the patient's arrival at the hospital, the systemic rapid CT and FAST should be completed as soon as possible and be reviewed in time according to the patient's condition to accurately spot traumatic hemorrhagic shock, and if necessary, emergency thoracotomy or laparotomy can be performed to control the bleeding. It is suggested to avoid tissue perfusion and oxygen supply reduction due to acute blood volume loss, the persistency of which can lead to acidosis and multiple organ dysfunction.[38–40] Patients often cannot tolerate routine definitive surgery after traumatic injury, and therefore procedures in such situations should take into consideration injury control. In other words, the surgical goal would be to stabilize multiple injuries and later perform staged surgeries to improve the outcome of rescue.[41,42]
During time interval from 3 days to 30 days, victims suffered from head trauma still represent the most deaths (88.58%, 411/464). Of the 411 patients with head trauma who died between 3 d to 30 d, 148 (36.01%) died from traumatic subdural hemorrhage, 93 (22.63%) died from brainstem injury, 83 (20.19%) died from cerebral hernia. During this period, we should continue to pay attention to the changes of neurological examination and clinical manifestations of patients with head trauma, clarify the diagnosis of patients, positively monitor intracranial hemorrhage by CT scan, and provide life support consistently if necessary.
Since trauma treatment centers are still not common in China, we propose to reform the emergency department function of existing general hospitals, which includes establishing professional treatment teams for severe trauma at the hospital level and organizing professional training on treatment techniques and treatment procedures and norms. The trauma rescue team should include the emergency department, orthopedics, urology, cardiothoracic surgery, neurosurgery, general surgery, anesthesiology, and ICU personnel. Members of the trauma rescue team must arrive at the hospital emergency room before the arrival of the patient of severe trauma. Upon the arrival of the patient, team doctors should quickly judge the condition and immediately provide life support, injury stabilization, and preparation for surgery, all according to the principle of “evaluation-decision-treatment-reevaluation-redecision.” We can therefore transition from a “step by step” process to an “entire closed-loop” process.[41,43,44]
Additionally, we should notice the important role of a trauma treatment system to be played in the entire traffic trauma rescue and treatment. A number of studies in Europe and the United States show that trauma treatment requires a complete system,[45,46] and trauma centers can significantly improve the treatment of trauma, especially severe trauma.[47] The United Nation's Global Plan for the Decade of Action for Road Safety 2011–2020[2] proposes the development of a pre-hospital rescue system and hospital trauma rescue and treatment system, and the assessment of treatment quality. The team of Professor Jiang Baoguo (Peking University Trauma Medicine Center) has established a closed-loop regional trauma rescue system which is built around the trauma rescue and treatment team of existing general hospitals instead of independent trauma rescue centers. In this system, a general hospital functions as a hub for the local trauma system in each regional area, and by implementing the new system, the average hospital mortality of severe trauma patients (patients with an Injury Severity Score ≥ 16) has decreased from 33.82% to 20.49%. This system is known by domestic and foreign scholars as the Chinese model for trauma care.[41,48–50] This model has been highly valued and supported by the National Health Commission of China,[51] and it has been promoted and implemented in more than 400 hospitals in 28 provinces nationwide to improve the success rate of treatment for severe trauma.
Our study faced certain limitations. First, our database contained only death cases provided by the Beijing Red Cross Emergency Center on road traffic injury deaths from 2008 to 2017 so the study population only included fatalities that did not allow for risk factor analysis for mortality outcome. Second, for pre-hospital death cases, the injured body parts were extracted from death diagnosis which the recorders may have most likely undercounted less visible injuries (chest, abdomen and spine) compared to highly visible injuries such as bleeding and deformity for head and extremity injuries. Third, over half of deaths had missing data for the mode of transportation, therefore, the discovery analyzed from these data may be less representative for all RTI deaths. Finally in further study, with more and more death data related to RTI, we suggest fitting a nonlinear model[52] for our death data for statistical analysis, which could be more rigorous epidemiologically and inspiring for the prevention of RTI deaths.
Although the causes of fatal RTI are multifaceted, we believe that society can take the following actions to reduce the occurrence of RTIs, improve the efficiency of rescue and treatment, and thereby reduce the harm caused by RTI to both families and society: improve the awareness of traffic safety, eliminate traffic safety hazards by improving road traffic facilities, strengthen traffic safety supervision, improve the rescue and treatment system including building an efficient system adapted to the local regions, and treat trauma patients in a timely and proper manner according to the characteristics of their traumatic injuries.
5. Conclusion
In Beijing, RTI is a significant cause of preventable death, particularly among pedestrians and users of non-motorized vehicles. Head trauma was the most lethal cause of RTI deaths. Our findings suggested that interventions to prevent collisions and reduce injuries, and improved trauma treatment process and trauma rescue system could address a certain proportion of avoidable RTI deaths.
Author contributions
Conceptualization: Tianbing Wang, Yanhua Wang, Tingmin Xu, Libing Li, Mingli Huo, Bingsong Mei, Xiaohua Zhou, Baoguo Jiang.
Data curation: Tingmin Xu, Libing Li, Mingli Huo, Xian Li, Yingdong He, Qiushi Lin, Xiaohua Zhou, Baoguo Jiang.
Formal analysis: Yanhua Wang, Tingmin Xu, Yingdong He, Qiushi Lin, Xiaohua Zhou, Baoguo Jiang.
Investigation: Tianbing Wang, Yanhua Wang, Libing Li, Xian Li, Bingsong Mei.
Methodology: Yanhua Wang, Mingli Huo, Xian Li, Yingdong He, Qiushi Lin, Bingsong Mei, Xiaohua Zhou, Baoguo Jiang.
Project administration: Bingsong Mei, Baoguo Jiang.
Resources: Yanhua Wang, Mingli Huo, Xian Li, Bingsong Mei, Baoguo Jiang.
Software: Xiaohua Zhou.
Supervision: Tianbing Wang, Yanhua Wang, Bingsong Mei, Xiaohua Zhou, Baoguo Jiang.
Writing – original draft: Tingmin Xu, Yingdong He, Qiushi Lin.
Writing – review & editing: Tianbing Wang, Yanhua Wang, Xiaohua Zhou, Baoguo Jiang.
Footnotes
Abbreviations: ICD = International statistical classification of diseases and related health problems, RTI = road traffic injury, WHO = World Health Organization.
How to cite this article: Wang T, Wang Y, Xu T, Li L, Huo M, Li X, He Y, Lin Q, Mei B, Zhou X, Jiang B. Epidemiological and clinical characteristics of 3327 cases of traffic trauma deaths in Beijing from 2008 to 2017: a retrospective analysis. Medicine. 2020;99:1(e18567).
TW, YW, and TX contributed equally to this work.
This study was supported by Innovation Team of the Ministry of Education, No. IRT1601
The authors have no conflicts of interest to disclose.
References
- [1].WHO Violence, I Prevention - Global status report on road safety World Health Organization. 2013. [Google Scholar]
- [2].Sminkey ML. Global Plan for the Decade of Action for Road Safety 2011–2020. World Health Organization 2011;http://www.who.int/roadsafety/decade_of_action [Google Scholar]
- [3].Wang S, Li Y, Chi G, et al. Injury-related fatalities in China: an under-recognised public-health problem. Lancet 2008;372:1765–73. [DOI] [PubMed] [Google Scholar]
- [4].World Health Organization, Peden M, Scurfield R, Sleet D, et al. World report on road traffic injury prevention. 2004. [Google Scholar]
- [5].OECD Scientific Expert Report. Targeted road safety programs. Organization for Economic Co-operation and Development 1994. [Google Scholar]
- [6].IRTAD: OECD. International Road Traffic and Accident Database: Road Safety Annual Report 2018. [Google Scholar]
- [7].International statistical classification of diseases and related health problems: instruction manual. Vol 2. World Health Organization. 2004. [Google Scholar]
- [8].World health statistics 2018: Monitoring health for the SDGs (sustainable development goals). Geneva: World Health Organization. In:2018. [Google Scholar]
- [9].Toroyan T. Global status report on road safety 2015. Supporting a decade of action Geneva: World Health Organization, Department of Violence and Injury Prevention and Disability. 2013. [Google Scholar]
- [10].Trunkey DD. Trauma. Sci Am Lancet 1983;249:25–35. [Google Scholar]
- [11].Wang Z, Zhang L. Research advances in trauma death curve. Chin J Trauma 2011;27:382–4. [Google Scholar]
- [12].MacLeod JB, Cohn SM, Johnson EW, et al. Trauma deaths in the first hour: are they all unsalvageable injuries? Am J Surg V 193 2007;195–9. [DOI] [PubMed] [Google Scholar]
- [13].Armitage P. Tests for linear trends in proportions and frequencies. Biometrics 1955;11:375–86. [Google Scholar]
- [14].Cochran WG. Some methods for strengthening the common χ2 tests. Biometrics 1954;10:417–51. [Google Scholar]
- [15].National Work Safety in 2011. State Administration of Work Safety; 2012. http://www.chinasafety.gov.cn/newpage/Contents/Channel_4181/2012/0114/167212/content_167212.htm [Google Scholar]
- [16].Road Safety Annual Report 2017. International Road Traffic and Accident Database; 2018. [Google Scholar]
- [17].Mokdad AH, Forouzanfar MH, Daoud F, et al. Global burden of diseases, injuries, and risk factors for young people's health during 1990-2013: a systematic analysis for the Global Burden of Disease Study. Lancet 2016;387:2383–401. [DOI] [PubMed] [Google Scholar]
- [18].Johnston I, Campbell B, Mohan D, et al. Traffic safety in low-income countries: issues and concerns regarding technology transfer from high-income countries. In: Reflections on the transfer of traffic safety knowledge to motorising nations Melbourne, Global Traffic Safety Trust. 1998:27–56. [Google Scholar]
- [19].Guo H. The causes of the “Chinese-style crossing the road” phenomenon and its enlightenment to the construction of urban slow-moving system. Dec Making Inform 2015;12:238–42. [Google Scholar]
- [20].Mohan D. Traffic safety and health in indian cities. J Transp Infrastr 2002;9:79–92. [Google Scholar]
- [21].Gains A, Humble R, Robertson S, Heydecker B. A cost recovery system for speed and red-light cameras: two-year pilot evaluation. Research Paper, 11 February 2003, Department for Transport. 2003. [Google Scholar]
- [22].Herrstedt L. Planning and safety of bicycles in urban areas. In: Proceedings of the Traffic Safety on Two Continents Conference, Lisbon, 22-24 Spetember 1997. Linköping: Swedish National Road and Transport Research Institute;1998:0347–6030. [Google Scholar]
- [23].Zhang H. Analysis of the impact of road traffic safety facilities on traffic safety. Achitect Eng Technol Des 2018;17:533–5. [Google Scholar]
- [24].Lee CC, Zhang S, Li T. Policing strategies on road safety management in metropolis: Singapore's experience in road safety education. Urban Transport China 2018;16:52–61. [Google Scholar]
- [25].Kulanthayan S, Umar RR, Hariza HA, et al. Compliance of proper safety helmet usage in motorcyclists. Med J Malaysia 2000;55:40–4. [PubMed] [Google Scholar]
- [26].Servadei F, Begliomini C, Gardini E, et al. Effect of Italy's motorcycle helmet law on traumatic brain injuries. Injury Prevent 2003;9:257–60. [DOI] [PMC free article] [PubMed] [Google Scholar]
- [27].Peek-Asa C, McArthur DL, Kraus JF. The prevalence of non-standard helmet use and head injuries among motorcycle riders. Accid Anal Prev V 31 1999;229–33. [DOI] [PubMed] [Google Scholar]
- [28].Xu N, Gao N, Su H, et al. Online investigation on prevalence and cognition of e-bike helmet use in Shanghai. Shanghai J Prev Med 2018;30:744–9. [Google Scholar]
- [29].Jin Y. Research on the correct wearing method of electric bicycle helmet. Electr Bicycle 2017;11:50. [Google Scholar]
- [30].Cummings P, McKnight B, Rivara FP, et al. Association of driver air bags with driver fatality: a matched cohort study. BMJ 2002;324:1119–22. [DOI] [PMC free article] [PubMed] [Google Scholar]
- [31].Seat Belts and Child Restraints: Increasing Use and Optimizing Performance. Brussels 1996. [Google Scholar]
- [32].Zhang Z, Wang D, Liu T, et al. Seat belt use of drivers and front passengers in Beijing. Road Traffic Saf 2016;16:15–22. [Google Scholar]
- [33].Zhao X, Liu H. Progress in the early emergency treatment of patients with severe trauma-Team mode and standardization details. Chin J Emerg Med 2016;25:553–6. [Google Scholar]
- [34].Picetti E, Iaccarino C, Servadei F. Guidelines for the management of severe traumatic brain injury fourth edition. Neurosurgery 2017;81:E2–12. [DOI] [PubMed] [Google Scholar]
- [35].Bernard SA, Nguyen V, Cameron P, et al. Prehospital rapid sequence intubation improves functional outcome for patients with severe traumatic brain injury: a randomized controlled trial. Ann Surg 2010;252:959–65. [DOI] [PubMed] [Google Scholar]
- [36].Jacob M, Kumar P. The challenge in management of hemorrhagic shock in trauma. Med J Armed Forces India 2014;70:163–9. [DOI] [PMC free article] [PubMed] [Google Scholar]
- [37].Xu L, Liu W, Liu B. Interpretation of the 2016 american guidelines for the treatment of severe head trauma (Fourth Edition). Chin J Neurosurg 2017;33:8–11. [Google Scholar]
- [38].Rossaint R, Bouillon B, Cerny V, et al. The European guideline on management of major bleeding and coagulopathy following trauma. Crit Care 2016;20:100. [DOI] [PMC free article] [PubMed] [Google Scholar]
- [39].Liu L. Interpretation of early treatment norms for traumatic hemorrhagic shock. J Traum Surg 2017;19:884–7. [Google Scholar]
- [40].Liu Y, Liu G. Injury control management of multiple trauma patients under multidisciplinary joint mode. J Clin Surg 2018;26:563–6. [Google Scholar]
- [41].Jiang B, Liang S, Peng Z-R, et al. Transport and public health in China: the road to a healthy future. Lancet 2017;390:1781–91. [DOI] [PMC free article] [PubMed] [Google Scholar]
- [42].American College of Surgeons Committee on Trauma. Advanced trauma life support for doctors. ATLS Student Course Manual 2004;1:7. [Google Scholar]
- [43].Jiang B. The challenges faced in the field of trauma care in China. Chin J Surg 2015;53:401–4. [PubMed] [Google Scholar]
- [44].China Trauma Rescue and Treatment Association. Consensus on the establishment of urban trauma rescue system in China. Chin J Surg 2017;55:830–3. [DOI] [PubMed] [Google Scholar]
- [45].American College of Surgeons Committee on Trauma. In: Papadakos PJ, Gestring ML, eds. Encyclopedia of Trauma Care. Berlin, Heidelberg: Springer Berlin Heidelberg; 2015:134–134. [Google Scholar]
- [46].MacKenzie EJ, Rivara FP, Jurkovich GJ, et al. A national evaluation of the effect of trauma-center care on mortality. N Engl J Med 2006;354:366–78. [DOI] [PubMed] [Google Scholar]
- [47].Tinkoff GH, Reed JF, III, Megargel R, et al. Delaware's inclusive trauma system: impact on mortality. J Trauma 2010;69:245–52. [DOI] [PubMed] [Google Scholar]
- [48].Wang T, Yin X, Zhang P, et al. Road traffic injury and rescue system in China. Lancet 2015;385:1622. [DOI] [PubMed] [Google Scholar]
- [49].Yin X, Wang T, Zhang P, et al. Evaluation of the effects of standard rescue procedure on severe trauma treatment in china. Chin Med J 2015;128:1301. [DOI] [PMC free article] [PubMed] [Google Scholar]
- [50].Jiang B. Current status of trauma treatment and establishment of rescue and treatment standard in China. Chin J Surg 2012;50:577–8. [Google Scholar]
- [51].National Health Commission of the People's Republic of China. Notice on Further Improving the Ability of Trauma Rescue. 2018. [Google Scholar]
- [52].Zhang Z. Multivariable fractional polynomial method for regression model. Ann Transl Med 2016;4:174. [DOI] [PMC free article] [PubMed] [Google Scholar]


