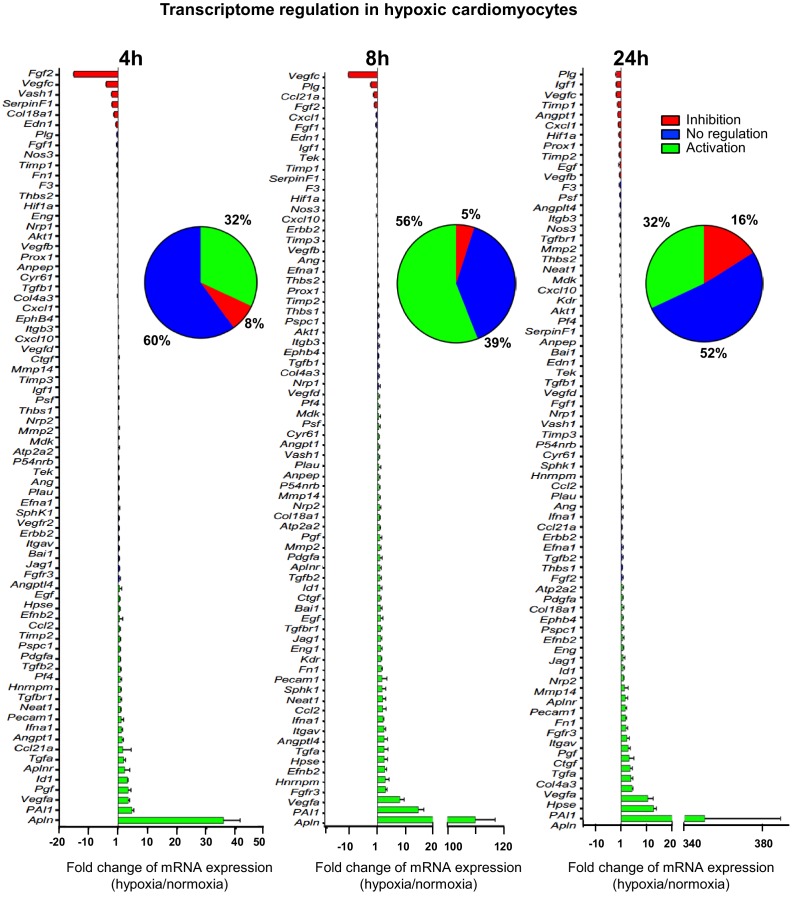
Figure 1. (Lymph)angiogenic genes are not drastically induced at the transcriptome level in hypoxic cardiomyocytes.
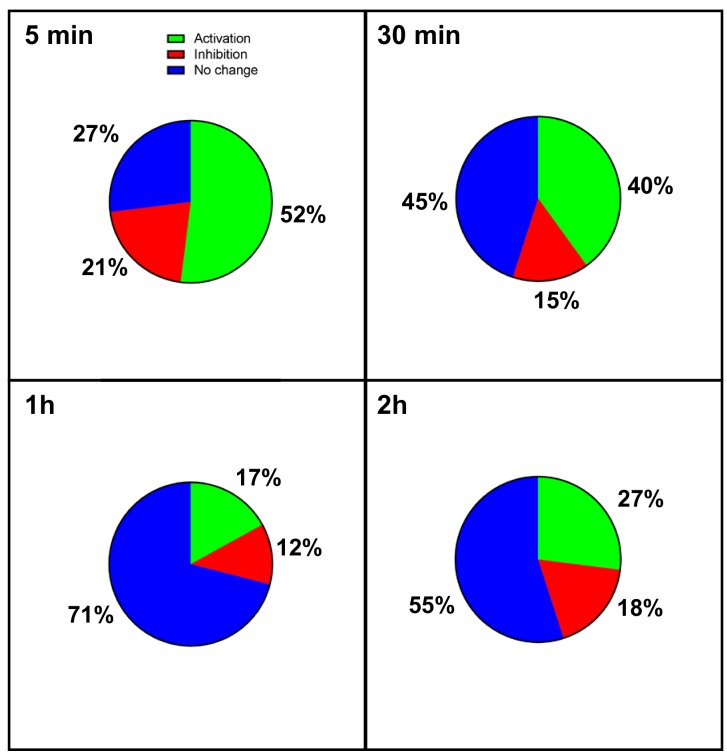
Total RNA was purified from HL-1 cardiomyocytes submitted to increasing durations (from 5 min to 24 hr) of hypoxia at 1% O2, as well as from normoxic cardiomyocytes as a control. cDNAs were synthesized and used for a Fluidigm deltagene PCR array dedicated to genes related to (lymph)angiogenesis or stress (Supplementary file 6). Analysis was performed in three biological replicates (cell culture well and cDNA), each of them measured in three technical replicates (PCR reactions). Relative quantification (RQ) of gene expression during hypoxia was calculated using the 2–ΔΔCT method with normalization to 18S rRNA and to normoxia. mRNA levels are presented as histograms for the times of 4 hr, 8 hr and 24 hr, as the fold change of repression (red) or induction (green) normalized to normoxia. Non-regulated mRNAs are represented in blue. The threshold for induction was set at 1.5. When the RQ value is inferior to 1, the fold change is expressed as −1/RQ. The percentage of repressed, induced, and non-regulated mRNAs is indicated for each duration of hypoxia. For shorter durations of 5 min to 2 hr, the percentages are shown in Figure 1—figure supplement 1. The detailed values for all of the durations of hypoxia are presented in Supplementary file 1.


