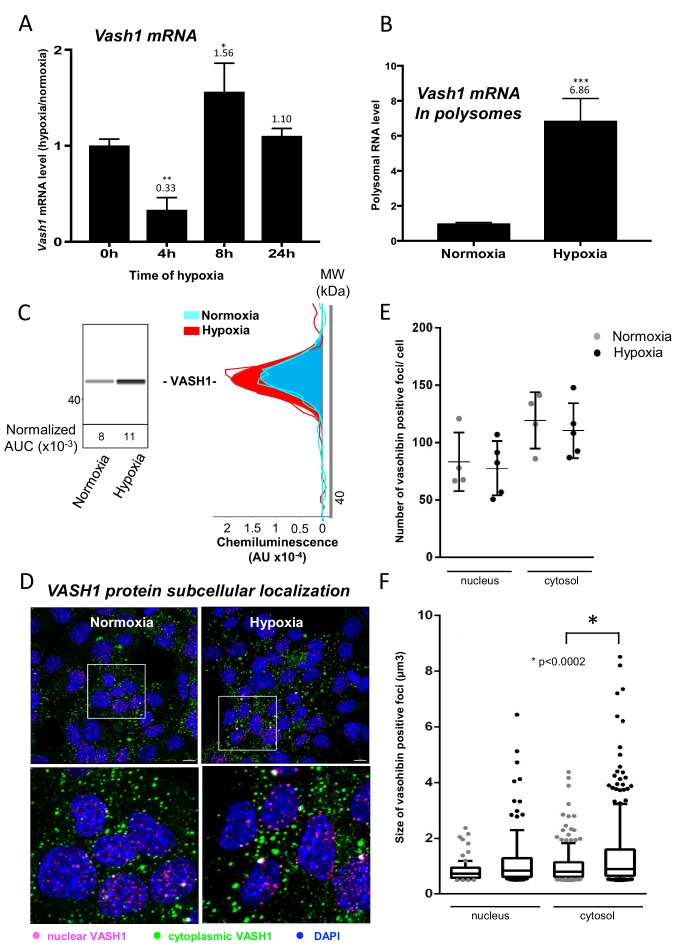
Figure 6. Vasohibin1 is translationally induced in early hypoxia and is localized in nuclear and cytoplasmic foci.
(A–D) VASH1 expression was analyzed in HL-1 cardiomyocytes subjected to hypoxia at the transcriptome and translatome levels. A fluidigm RT qPCR array (Supplementary file 2) was performed with two biological replicates (cell culture and cDNA), each of them measured in two technical replicates (PCR reactions). Detailed values at 4 hr and 24 hr are presented in Supplementary file 2. As for Figure 2, total RNA was purified from the cell lysate of cardiomyocytes in normoxia or submitted to 4 hr, 8 hr or 24 hr of hypoxia (A). Polysomal RNA was purified from cardiomyocytes in normoxia or after 4 hr of hypoxia, from pooled heavy fractions containing polysomes (fractions 19–27) (B). Histograms correspond to mean ± standard deviation of the mean, with two-tailed t-test, *p<0.05, **p<0.01, ***<0.001 used to compare data from hypoxic and normoxic cardiomyocytes. VASH1 protein expression was measured by capillary Simple Western of extracts from cardiomyocytes in normoxia or submitted to 4 hr of hypoxia (C). VASH1 was immunodetected in HL-1 cardiomyocytes in normoxia or after 4 hr of hypoxia (D). DAPI staining allows to detect VASH1 nuclear localization (MERGE). VASH1 foci in the nucleus are shown in purple and those in the cytoplasm in green using Imaris software. The number of VASH1 foci was quantified in the nucleus and in the cytoplasm in normoxia and after 4 hr of hypoxia (n = 4–5 images with a total cell number of 149 in normoxia and 178 in hypoxia) (E). Boxplots of volume of vasohibin foci in normoxia and hypoxia (F). All foci above 0.5 μm3 were counted. Whiskers mark the 10% and the 90% percentiles with the mean in the center. One-way Anova with Tukey’s comparisons test was applied.

