Abstract
Objective
To examine changing features of cortical morphology in middle-aged adults with autism spectrum disorders (ASDs) vs typical comparison (TC) participants, hypothesizing regionally decreased local gyrification index (lGI), given our previous findings of accelerated lGI decline during adolescence.
Methods
After quality assurance, T1-weighted MRI sequences from 20 participants with ASD and 21 TC participants (40–61 years) matched on age were analyzed. lGI, cortical thickness (CT), and surface area (SA) were measured with FreeSurfer version 5.3. Statistical analyses used a general linear model including age, nonverbal IQ, and total brain volume as covariates. Clusters of significant group effects were used as regions of interest for behavioral analyses.
Results
Clusters of decreased lGI were observed bilaterally in the ASD group with large effect sizes in insular and anterior cingulate (ACC), left postcentral, and middle frontal and right orbitofrontal and supramarginal regions. lGI was also shown to decline with age across groups in bilateral precentral and right supramarginal clusters. No significant group, age, or group-by-age interaction effects were observed for CT or SA in this age group. lGI showed a significant correlation with Social Responsiveness Scale total scores in a right caudal ACC cluster in the TC group only, while several correlations were found in the ASD group between executive function scores and clusters in the bilateral insula and right orbitofrontal cortex.
Conclusion
The pattern of regionally decreased lGI observed here in middle-aged adults with ASDs is consistent with an abnormal trajectory of cortical folding changes across different stages of life in ASDs, as shown in previous studies.

Autism spectrum disorders (ASDs) are lifespan neurodevelopmental conditions associated with age-specific abnormalities in cortical morphology. Early cerebral overgrowth in the first years of life is reflected in various morphometric features,1 but cortical thickness (CT) and surface area (SA) do not show definitive patterns of abnormality across later childhood and adulthood.2,3 Our previous research showed regionally increased local gyrification index (lGI) in ASDs in school-age children, potentially informative of earlier brain growth anomalies,4 but lGI declined rapidly from childhood to adolescence in ASDs. However, whether neuroanatomic trajectories remain atypical into adult life is not well understood.
A previous study of adults aged 18-43 years reported increased lGI in participants with ASDs in frontal and parietal regions.5 No age effects were reported. Another study of 30- to 75-year-old participants showed no group differences in lGI, but a subsample of older adults with ASDs (mean age 62.35 years) showed atypical age-related decline of lGI in insular cortex.6 The present study further examined changing features of cortical morphology specifically in middle-aged adults with ASDs vs typical comparison (TC) participants, with a focus on cortical folding. Given our previous findings of accelerated decline in lGI during adolescence, we hypothesized that lGI would be regionally decreased in mature adults.
Methods
Participants
Fifty-three adults (26 with ASD, 27 TC participants; age 40–61 years) were recruited. Participants with ASD were recruited through referrals from autism clinics, service providers (e.g., group homes, day programs), contacts with the Autism Society San Diego, advertisement at local autism-related events (resource fairs, fundraisers, etc.), and community advertisement. A preexisting diagnosis of ASD was not required for recruitment, but all diagnoses were confirmed as described below. Participants in the TC group were recruited through community advertisement. Participants with a history of neurologic (e.g., epilepsy, tuberous sclerosis) or genetic (e.g., fragile X, Rett syndrome) conditions other than ASD were excluded. TC participants had no family history of autism or personal history of other neurologic conditions or serious mental illness. ASD diagnoses were made by a clinical psychologist according to DSM-V criteria7 and supported by module 4 of the Autism Diagnostic Observation Schedule, 2nd edition (ADOS-2),8 along with developmental history when available. IQ was assessed with the Wechsler Abbreviated Scale of Intelligence, 2nd edition.9 Social skills were further assessed with the self-report version of the Social Responsiveness Scale, 2nd edition (SRS-2).10 Executive functioning was assessed with the Trails, Verbal Fluency, and Color Word Interference subtests of the Delis-Kaplan Executive Function System (D-KEFS).11
Standard protocol approvals, registrations, and patient consents
The study was approved by the San Diego State University and University of California, San Diego institutional review boards. All participants (or their conservators) gave written informed consent before participation.
Imaging data
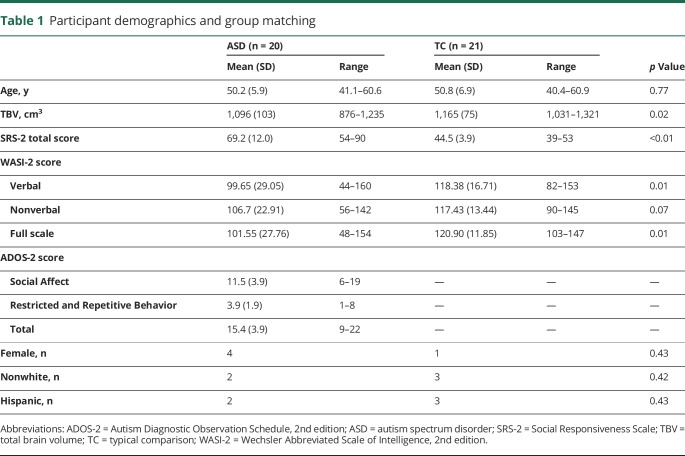
Anatomic images were obtained with a 3T GE Discovery MR750 scanner with a 32-channel head coil and a T1-weighted magnetization prepared rapid gradient echo sequence (repetition time 8.776 milliseconds, echo time 3.656 milliseconds, flip angle 8°, matrix 320 × 320, 0.8-mm3 resolution). Two participants with ASD with abnormal neuroanatomic findings (callosal dysgenesis; temporal lobe cyst) were excluded. After visual assessment of MRI data and FreeSurfer output, 4 participants with ASD and 6 TC participants were excluded due to insufficient quality of raw images or surface reconstruction. Individuals who were excluded were very similar to those who were included with regard to age and diagnostic and cognitive characteristics with no significant differences between excluded and included participants for either the ASD or TC groups (supplemental tables 1 and 2 available from Dryad, doi.org/10.5061/dryad.tb971n0). Data from 20 participants with ASD and 21 TC participants were subsequently analyzed, with groups matched on age, sex, race, and ethnicity (table 1).
Table 1.
Participant demographics and group matching
Image processing: Cortical reconstruction and quality assessment
FreeSurfer version 5.3.0 was used to perform semiautomated cortical reconstruction.12,13 In brief, individual scans were intensity normalized, skull stripped, and registered to a standard space. White matter and pial surfaces were then constructed with a polygonal tessellation. All images and surfaces were visually inspected on a slice-by-slice basis, and images with inaccurate surfaces or excessive image artifacts such as ghosting or ringing were excluded. SA and CT were calculated at each FreeSurfer surface vertex, and lGI was measured with an additional FreeSurfer processing stream.14 lGI is a 3D, surface-based method for calculating the ratio of cortical SA buried within the sulcal folds relative to the amount of cortex on the outer visible cortex within a sphere of 25-mm default radius surrounding each surface vertex.
Statistical analyses
Statistical analyses were performed for each vertex with a 2-step general linear model, with separate models for CT, SA, and lGI. All analyses were conducted with total brain volume and nonverbal IQ as covariates, given group differences in these measures. A smoothing kernel of 15-mm full width half-maximum was applied for CT and SA analyses, while no additional smoothing was implemented for lGI because the measure is inherently smoothed. Corrections for vertex-wise multiple comparisons were conducted with Monte Carlo null-z simulations, with a cluster-forming threshold of p < 0.01 and a cluster-wise significance threshold of p < 0.05.
Main effects and group-by-age interactions were tested in separate models to ensure that the presence of main effects would not be confounded by interactions. Main effects of group and age were tested with the different offset, same slope matrix design as implemented in FreeSurfer with the following model:  . Group-by-age interactions were tested using the different offset, different slope matrix design with the following model:
  .
.
Clusters of significant group effects were used as regions of interest for behavioral analyses. Mean values were extracted, and partial correlations controlling for age were run to examine the relationships between anatomy and scores on the SRS-2 (total score), ADOS-2 (Social Affect, Restricted and Repetitive Behavior, and total scores), and subtests of the D-KEFS. Behavioral analyses were adjusted for multiple comparisons with the false discovery rate.15
Data availability
Data included in these analyses will be available through the National Institute of Mental Health Data Archive (ndar.nih.gov/). Qualified researchers may request access through this system.
Results
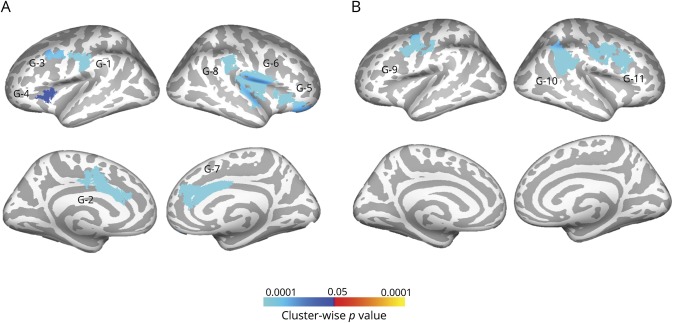
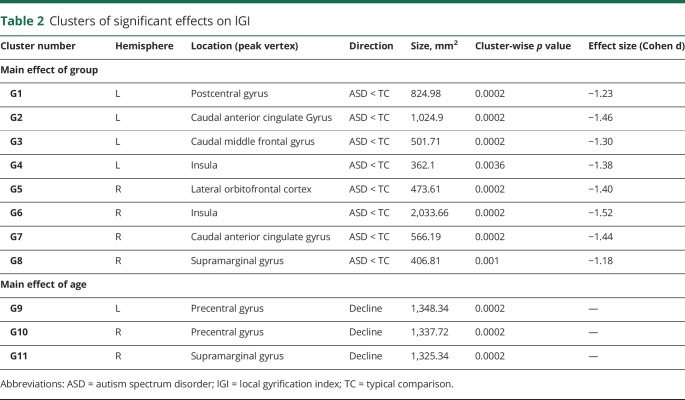
No significant group-by-age interactions were observed in the model for lGI, but the main effect model revealed several clusters of decreased lGI in the ASD group that reached large effect sizes (figure and table 2). These were observed bilaterally in perisylvian (G4 and G6) and anterior cingulate (G2 and G7), left postcentral (G1) and middle frontal gyri (G3), and right orbitofrontal (G5) and supramarginal regions (G8). Main effects of age were also observed (figure), showing lGI declining with age in the right supramarginal (G11) and bilateral precentral (G9 and G10) gyri.
Figure. Main effects of group and age on lGI.
(A) Local gyrification index (lGI) is significantly decreased bilaterally in anterior cingulate, insular, and perisylvian regions in the autism spectrum disorders group. (B) lGI declines with age across groups in the right supramarginal and bilateral precentral gyri. Cluster-forming threshold p < 0.01; cluster-wise significance threshold p < 0.05.
Table 2.
Clusters of significant effects on lGI
No main effects of group or group-by-age interactions were observed for CT or SA, but a significant negative main effect of age on CT was observed across the cortex. No main effects of age on SA were observed.
In the behavioral analyses (supplemental table 3 available from Dryad, doi.org/10.5061/dryad.tb971n0), no significant correlations were observed with ADOS-2 scores in the ASD group. Greater gyrification bilaterally in insular regions in the ASD group (clusters G4 and G6) was associated with higher (better) verbal fluency scores, a neuropsychological measure of generativity on the D-KEFS (supplemental table 4 available from Dryad).11 Similarly, greater gyrification in the ASD group in the right orbitofrontal region (cluster G5) was related to higher scores on a test of set shifting. This pattern of correlations is consistent with the main effect of regionally decreased gyrification in the ASD group, who showed lower performance on tests of executive function on average. In the TC group, greater gyrification in the right anterior cingulate (cluster G7) was associated with higher SRS-2 total scores, indicating poorer social functioning, but this relationship was absent in the ASD group. Behavioral correlations did not remain statistically significant after false discovery rate adjustment.
Discussion
The current study provides evidence of regionally decreased lGI in adults with ASDs between 41 and 61 years of age. Decreased lGI may suggest accelerated tissue loss, possibly consistent with previous research reporting increased cortical thinning in early adulthood in ASD.16 Two clusters of reduced lGI were located bilaterally in the insula, overlapping with areas of increased lGI found in a previous study4 of 2 independent samples of children and adolescents with ASDs. This spatial overlap may indicate that regions most affected by early overgyrification are also more susceptible to subsequent decline in ASDs. However, given the lack of a statistically significant group-by-age interaction in the present study, this interpretation should be made with caution. Both the current study and this previous study in adolescents showed group differences in lGI but not CT or SA, suggesting that lGI may be a more sensitive measure of abnormalities of cortical macrostructure in ASDs. The observed correlations between lGI and executive function scores in the same insular clusters further support the potential clinical relevance of these lGI differences.
While no group-by-age interactions were observed in the current study, the clusters of decreased lGI in the anterior cingulate are consistent with our previous report of a group-by-age interaction in an overlapping area, which showed greater decline in lGI across childhood and adolescence in individuals with ASDs. This may indicate that lGI of the anterior cingulate cortex begins to decrease in adolescence, leading to a measurable difference between groups in adulthood, again supporting an atypical trajectory of lGI change. The location of this effect is of particular interest, given postmortem reports of altered cellular density in anterior cingulate cortex in ASDs17 and the known importance of this brain region in social and emotional function.18 In addition, the presence of a correlation between gyrification in the right anterior cingulate and social function in the TC group but not in the ASD group may suggest a disruption of the typical function of this region in the disorder.
The pattern of regionally decreased lGI observed here in middle-aged adults with ASDs is consistent with an abnormal trajectory of cortical folding changes across different stages of life in ASDs, as shown in previous studies. Correlations between regional lGI and performance on tests of executive function suggest a potential functional impact of these brain changes.
Limitations
The present study examined a relatively small sample of adults with ASD. However, given the extremely limited literature on this age range, it provides valuable early insight into neuroanatomic differences that may present with older age in the disorder. The study included mostly high-functioning individuals, which is necessary to ensure high-quality MRI data but may limit the generalizability of findings. Finally, as a result of the cross-sectional nature of the data, we were unable to directly test for age-related changes. Follow-up longitudinal analyses will allow better characterization of changes in brain structure that occur over the second half of the lifespan in ASDs.
Acknowledgment
The authors thank the study participants and their families for sharing their time.
Glossary
- ADOS-2
Autism Diagnostic Observation Schedule, 2nd edition
- ASD
autism spectrum disorder
- CT
cortical thickness
- D-KEFS
Delis-Kaplan Executive Function System
- DSM-V
Diagnostic and Statistical Manual of Mental Disorders, 5th edition
- lGI
local gyrification index
- SA
surface area
- SRS-2
Social Responsiveness Scale, 2nd edition
- TC
typical comparison
Appendix. Authors

Study funding
Funded by NIH R01-MH103494.
Disclosure
The authors report no disclosures relevant to the manuscript. Go to Neurology.org/N for full disclosures.
References
- 1.Redcay E, Courchesne E. When is the brain enlarged in autism? A meta-analysis of all brain size reports. Biol Psychiatry 2005;58:1–9. [DOI] [PubMed] [Google Scholar]
- 2.Yang DYJ, Beam D, Pelphrey KA, Abdullahi S, Jou RJ. Cortical morphological markers in children with autism: a structural magnetic resonance imaging study of thickness, area, volume, and gyrification. Mol Autism 2016;7:11. [DOI] [PMC free article] [PubMed] [Google Scholar]
- 3.Wallace GL, Robustelli B, Dankner N, Kenworthy L, Giedd JN, Martin A. Increased gyrification, but comparable surface area in adolescents with autism spectrum disorders. Brain 2013;136:1956–1967. [DOI] [PMC free article] [PubMed] [Google Scholar]
- 4.Kohli JS, Kinnear MK, Fong CH, Fishman I, Carper RA, Müller RA. Local cortical gyrification is increased in children with autism spectrum disorders, but decreases rapidly in adolescents. Cerebral Cortex 2019;29:2412–2423. [DOI] [PMC free article] [PubMed] [Google Scholar]
- 5.Ecker C, Andrews D, Dell'Acqua F, et al. Relationship between cortical gyrification, white matter connectivity, and autism spectrum disorder. Cereb Cortex 2016;26:3297–3309. [DOI] [PMC free article] [PubMed] [Google Scholar]
- 6.Koolschijn PCM, Geurts HM. Gray matter characteristics in mid and old aged adults with ASD. J Autism Develop Disord 2016;46:2666–2678. [DOI] [PMC free article] [PubMed] [Google Scholar]
- 7.Diagnostic and Statistical Manual of Mental Disorders. 5th ed. Washington, DC: American Psychiatric Association; 2013. [Google Scholar]
- 8.Lord C, Rutter M, DiLavore PC, Risi S, Gotham K, Bishop S. Autism Diagnostic Observation Schedule: ADOS-2. Los Angeles, CA: Western Psychological Services; 2012. [Google Scholar]
- 9.Wechsler D. Wechsler Abbreviated Scale of Intelligence: San Antonio, TX:Psychological Corp; 1999. [Google Scholar]
- 10.Constantino JN, Gruber CP. Social Responsiveness Scale. 2nd ed. Torrance, CA: Western Psychological Services; 2012. [Google Scholar]
- 11.Delis DC, Kaplan E, Kramer JH. Delis-Kaplan Executive Function System (D-KEFS): San Antonio, TX:Psychological Corp; 2001. [Google Scholar]
- 12.Fischl B, Sereno MI, Dale AM. Cortical surface-based analysis, II: inflation, flattening, and a surface-based coordinate system. Neuroimage 1999;9:195–207. [DOI] [PubMed] [Google Scholar]
- 13.Dale AM, Fischl B, Sereno MI. Cortical surface-based analysis, I. segmentation and surface reconstruction. Neuroimage 1999;9:179–194. [DOI] [PubMed] [Google Scholar]
- 14.Schaer M, Cuadra MB, Tamarit L, Lazeyras F, Eliez S, Thiran JP. A surface-based approach to quantify local cortical gyrification. IEEE Trans Med Imaging 2008;27:161–170. [DOI] [PubMed] [Google Scholar]
- 15.Benjamini Y, Hochberg Y. Controlling the false discovery rate: a practical and powerful approach to multiple testing. J R Stat Soc Ser B 1995;57:289–300. [Google Scholar]
- 16.Wallace GL, Dankner N, Kenworthy L, Giedd JN, Martin A. Age-related temporal and parietal cortical thinning in autism spectrum disorders. Brain 2010;133:3745–3754. [DOI] [PMC free article] [PubMed] [Google Scholar]
- 17.Bailey A, Luthert P, Dean A, et al. A clinicopathological study of autism. Brain 1998;121:889–905. [DOI] [PubMed] [Google Scholar]
- 18.Mundy P. The neural basis of social impairments in autism: the role of the dorsal medial-frontal cortex and anterior cingulate system. J Child Psychol Psychiatry 2003;44:793–809. [DOI] [PubMed] [Google Scholar]
Associated Data
This section collects any data citations, data availability statements, or supplementary materials included in this article.
Data Availability Statement
Data included in these analyses will be available through the National Institute of Mental Health Data Archive (ndar.nih.gov/). Qualified researchers may request access through this system.


