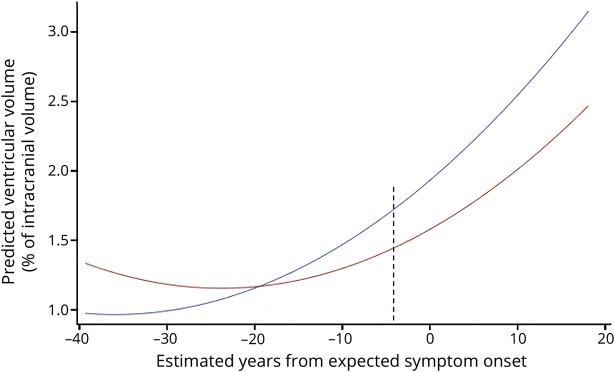
Figure 1. Total ventricular volume by years from expected symptom onset in presymptomatic carriers vs noncarriers.
Total ventricular volume by estimated years from expected symptom onset in presymptomatic carriers (blue, n = 46) and noncarriers (red, n = 53). Ventricular volume is expressed as a percentage of intracranial volume. To prevent disclosure of genetic status, individual data points are not plotted. Differences are noted beginning at 4 years prior to symptom onset as indicated by the dashed line (p = 0.04).

