Figure 5. A3G binding to ssDNA/dsDNA hybrid construct.
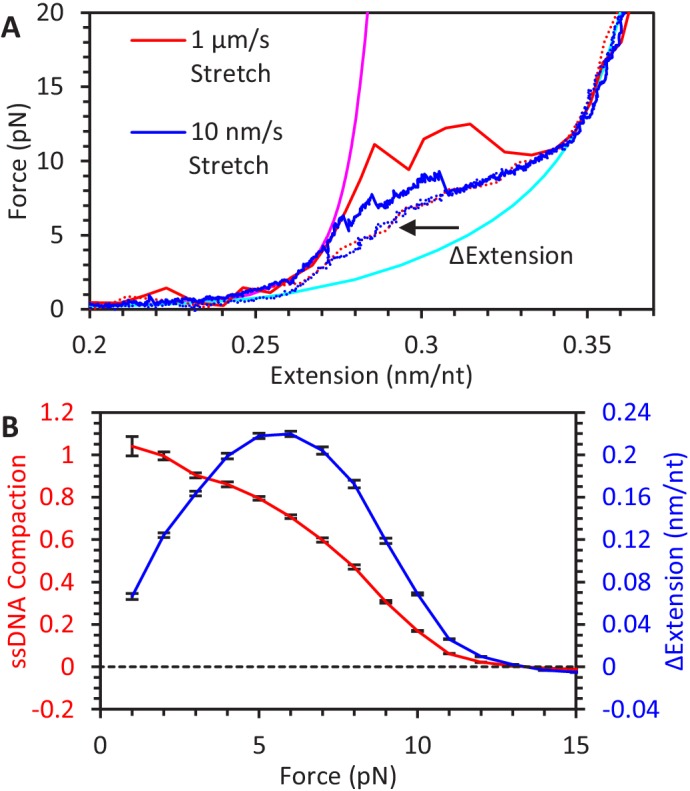
(A) FECs of hybrid construct. A 6.5 kbp dsDNA construct is stretched using optical tweezers (blue diamonds). The first stretch follows the WLC model (yellow line), but a one knt section of ssDNA between two nicking sites dissociates during overstretching, altering the FEC of subsequent stretches (red triangles). At low forces, secondary structure compacts the ssDNA and the constructs total extension is consistent with the ssDNA section having zero net extension (magenta line). At higher forces, secondary structure is disrupted, and the ssDNA’s contribution to the construct’s total extension follows the FJC model (cyan line). (B) ssDNA extension change due to A3G binding at low force. The hybrid construct is held at a constant force and incubated with 50 nM A3G. At the lowest forces (4 pN in yellow and 8 pN in green), ssDNA is initially compacted due to secondary structure but increases it extension as A3G binds. (C) Average ssDNA extension changes. The average total extension changes (compared to initial extension, blue circles) and average relative extension changes (compared to FJC model, red triangles) are plotted as a function of force. Above ~10 pN, ssDNA extension is decreased similar to experiments using the fully ssDNA construct at 20 pN (green symbols). At lower forces ssDNA extension appears to increase, but when the initial decrease in extension due to ssDNA secondary structure prior to A3G incubation is taken into account, the final ssDNA-complex is still shorter than bare, linear ssDNA. (D) Average rate of extension change. While the timescale required for the ssDNA to reach an equilibrium length at forces above ~10 pN agrees with 20 pN data obtained using a fully ssDNA construct, this process is greatly slowed at low forces where significant ssDNA secondary structure is present. (E) Stabilization of ssDNA loops by A3G. After incubating the hybrid construct with A3G at near zero force so that the ssDNA region is completely unextended, the DNA is stretched at a rate of 100 nm/s. As compared to the compaction of ssDNA due to intrinsic secondary structure formation (panel B), much higher forces are required to extend the ssDNA once A3G is bound (blue line). This effect remains even after removing free A3G from solution (red line). Similar effects are seen when incubating with FW mutant A3G (green line), indicating this A3G looping does not require A3G oligomerization. Error bars are standard error based on multiple experimental replications (N ≥ 5) with different ssDNA molecules.
Figure 5—figure supplement 1. Kinetics and equilibrium of ssDNA secondary structure formation.

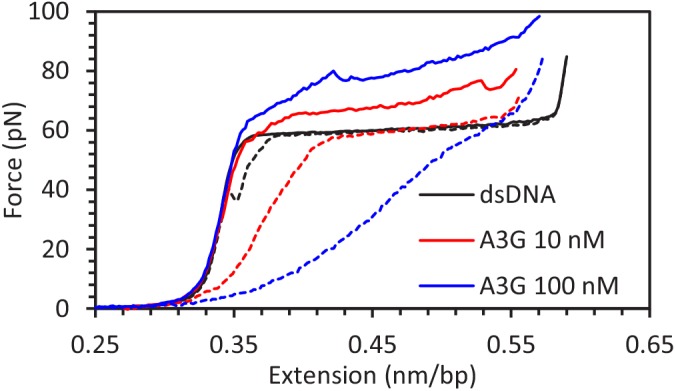
Figure 5—figure supplement 2. A3G binding to dsDNA.


