

Abstract
Spontaneous and sensory-evoked activity propagates across varying spatial scales in the mammalian cortex, but technical challenges have limited conceptual links between the function of local neuronal circuits and brain-wide network dynamics. We present a method for simultaneous cellular-resolution two-photon calcium imaging of a local microcircuit and mesoscopic widefield calcium imaging of the entire cortical mantle in awake mice. Our multi-scale approach employs an orthogonal axis design where the mesoscopic objective is oriented above the brain and the two-photon objective is oriented horizontally, with imaging performed through a microprism. We also introduce a viral method for robust and widespread gene delivery in the mouse brain. These approaches allow us to identify the behavioral state-dependent functional connectivity of pyramidal neurons and vasoactive intestinal peptide (VIP)-expressing interneurons with long-range cortical networks. Our novel imaging system provides a powerful strategy for investigating cortical architecture across a wide range of spatial scales.
Reporting summary
Further information on research design is available in the Life Sciences Reporting Summary linked to this article.
Introduction
In the mammalian neocortex, single neurons integrate synaptic inputs arising from both local circuits and long-range projections originating in various cortical and sub-cortical structures 1–3, giving rise to networks dedicated to processing various streams of information relevant for cognition, including sensory and motor representations4, 5. Anatomical, electrophysiological, and imaging studies have demonstrated distinct local and large-scale connectivity associated with varied feature encoding even for neighboring neurons in a single region6–10. Nevertheless, most experimental protocols are confined to measuring activity within single areas, limiting the ability to link the function of local circuits to global cortical dynamics. Recent studies have sought to bridge this gap by expanding the capabilities of existing techniques11–14, but methods for relating cortical function across these scales remain elusive.
Here, we describe a novel approach for performing simultaneous measurements of the micro-scale activity of single neurons and the meso-scale activity of diverse areas across the cortical mantle by combining two-photon and mesoscopic calcium imaging. To facilitate this approach, we have also developed a viral method for whole-brain expression of genetically-encoded calcium indicators. Compared to previously described methods pairing extracellular electrophysiology with mesoscopic calcium imaging15, 16, our method has several advantages. With two-photon imaging, we can monitor hundreds of neurons simultaneously and target genetically defined (often sparse) cell populations. Furthermore, we can easily follow the same cells over days or weeks, allowing us to monitor the stability and flexibility of cortical circuits.
We utilize this system to study how individual cells in somatosensory cortex (S1) of awake mice associate with networks across the cortical mantle. We apply a novel functional parcellation for mesoscopic calcium imaging data17, finding that activity-based segmentation of cortical cell-centered networks (CCNs) reveals surprising heterogeneity in the large-scale connectivity of neighboring neurons. We leverage the cell-type specificity afforded by genetically-encoded indicators to determine the association of both pyramidal neurons and vasoactive intestinal peptide-expressing interneurons (VIP-INs) with distal cortical areas across behavioral state. These results highlight the power of our multi-scale imaging approach to reveal novel aspects of functional cortical architecture.
Results
Design of a dual-axis microscope for simultaneous two-photon and mesoscopic imaging
To simultaneously record activity from hundreds of neurons at cellular resolution within a cortical area and the mesoscopic activity across the cortical mantle, we employ a “dual-axis” design18 that combines a widefield epifluorescence “mesoscope” using an objective positioned normal to the surface of the animal’s skull with a two-photon microscope using an ultra-long working distance (20 mm) objective positioned tangential to the skull surface and orthogonal to the mesoscope objective (Fig. 1a). To reflect the two-photon excitation and emission paths to/from the microscope, we utilize a square right angle glass microprism with an uncoated hypotenuse implanted into a small craniotomy over the brain surface (Fig. 1a, left inset). The uncoated microprism enables imaging the same brain tissue with either the two-photon (reflected emissions) or mesoscopic (transmitted emissions) system (see Fig. 2a).
Fig. 1. Design of a dual-axis microscope for simultaneous mesoscopic and two-photon imaging.
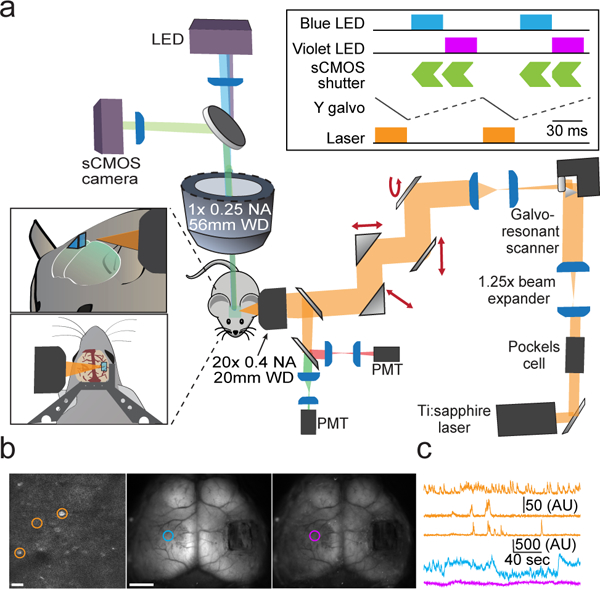
a, Schematic overview of the dual-axis microscope. Left insets show the position of the two-photon objective relative to an implanted glass microprism and titanium headpost. Upper right inset shows timing of the widefield LED illumination, widefield sCMOS detector, two-photon excitation laser, and two-photon galvanometric Y-scan mirror. b, Example frames showing two-photon imaging (left) and mesoscopic imaging under blue (middle) and violet (right) illumination. Scale bar is 20 μm (left) and 2 mm (middle). c, Example cellular (orange) and mesoscopic (blue, violet) activity traces from the color-coded regions/cells shown in (b).
Fig. 2. Analysis of simultaneously acquired micro- and meso-scale calcium imaging data.
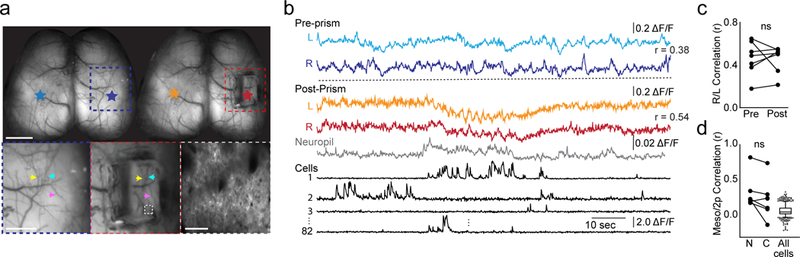
a, Top: Mesoscopic images of the same animal acquired before and after microprism implantation over right S1. Colored stars correspond to regions-of-interest for traces in (b). Scale bar is 2 mm. Bottom left, middle: Expanded images corresponding to colored boxes in top images. Colored arrowheads highlight matching blood vessels on the surface of the brain before and after microprism implantation. Scale bar is 1 mm. Bottom right: two-photon field-of-view corresponding to dashed box in middle image. Scale bar is 50 μm. b, Mesoscopic calcium imaging traces (ΔF/F) corresponding to regions-of-interest indicated in (a). Neuropil and cellular data are for two-photon calcium imaging. Prism, neuropil, and cell traces were acquired simultaneously, whereas pre-prism traces were acquired during a previous imaging session. R values between mesoscopic traces are Pearson’s correlations. c, Pearson’s correlations between bilateral S1 mesoscopic pixels pre- and post-prism implantation. p = 0.87, n = 6 sessions across 6 animals, paired two-tailed t test. d, Pearson’s correlations between mean fluorescence of mesoscopic pixels corresponding to the two-photon field-of-view and mean fluorescence of all neuropil pixels (N), all cell pixels (C), or individual cell pixels in the two-photon field-of-view. P = 0.05, n = 7 trials across 6 animals, paired two-tailed t test. Box-and-whisker plots of cell correlations show median, interquartile, and 5th-95th percentile values.
Analysis of imaging quality revealed only modest loss of resolution caused by imaging through a microprism (Supplementary Fig. 1). We also had success with other similar objectives, suggesting the broad potential for this approach without the need for highly specific optics (see Supplementary Table 1). To prevent optical cross-talk, we interleave the acquisition of two-photon and widefield epifluorescence frames (Fig. 1a, upper inset). Thus, the start of each widefield frame lags the start of each two-photon frame by 34 – 67 milliseconds, comparable to the rise time and substantially shorter than the decay time of current genetically encoded calcium indicators (e.g., GCaMP6f) for a single action potential19. As mesoscopic imaging of green fluorescent GCaMP6 signals may be contaminated by artifacts linked to both movement and hemodynamics20, we can collect both calcium-independent and -dependent emissions by interleaving frames of violet (395 nm) and blue (470 nm) illumination, respectively 21. Two-photon excitation is conducted via a titanium-sapphire laser tuned to 920 nm. This system enables an overall acquisition rate for both modalities of up to 15 Hz (Fig. 1b–c).
Monitoring neuronal activity via micro- and meso-scale calcium imaging
We leveraged our previous experience to analyze data from the two imaging modalities 8, 22, 23. For two-photon data, motion correction was performed by rigid body transformation 24 followed by manual identification of regions-of-interest (ROIs) and neuropil subtraction (see Methods)8, 19. Notably, non-rigid motion correction and automated ROI extraction 25 yielded similar results (Supplementary Fig. 2). After ROI extraction, calcium signals were normalized by baseline fluorescence to yield ΔF/F values. For the mesoscopic data, we performed top-hat filtering followed by baseline normalization and regressed out the violet-illuminated isosbestic GCaMP6 signal to remove fluorescence changes attributable to motion and hemodynamic artifacts21
Imaging through a microprism on the cortical surface did not impact neuronal health or activity. Excitation power emerging from the prism necessary for successful 2-photon imaging was ~100 mW, within previously described limits for thermal damage26. Moreover, post-hoc staining revealed that imaging through the prism produced no activation of heat-shock proteins (HSP70/72), a marker of damaged tissue (Supplementary Fig. 3) 26, 27. We also acquired mesoscopic data in transgenic mice expressing GCaMP6f selectively in cortical pyramidal neurons (Slc17a7-cre;CaMK2α-tTA;TITL-GCaMP6f) before and after implantation of the glass microprism over right S1. Much of the area under the microprism continues to be optically accessible to the mesoscope (Fig. 2b). In awake mice, the correlation of spontaneous activity between right and left S1 is typically high, and we observed no difference in this interhemispheric correlation resulting from prism implantation (Pearson’s r before vs. after, p=0.87, n=7 mice, Fig. 2c). We also compared neuronal activity in V1 measured with a standard two-photon objective and with our dual imaging objective, before and after prism implantation. Analyses revealed that imaging through a prism did not negatively impact the signal-to-noise of visually evoked responses or the orientation selectivity of single neurons (Supplementary Fig. 1).
Having simultaneous meso-scale and cellular-resolution optical access to the same brain area also permits us to investigate the relationship between the mesoscopic signal and its cellular sources, indirectly inferred in previous studies15, 20, 21. We found that the mesoscopic signal was similarly correlated with layer 2/3 neuropil and the summed activity of all cell bodies in the two-photon field-of-view (p = 0.05, n=7 imaging sessions across 6 mice). Interestingly, the activity of individual cell bodies was poorly correlated with the mesoscopic signal (Fig. 2d). These data suggest that the mesoscopic activity reflects substantial fluorescence from the neuropil, including dendritic and axonal processes of cell bodies not in the field of view.
Determination of functionally connected cell-centered networks using multi-scale imaging
We performed simultaneous two-photon imaging of layer 2/3 neurons in mouse S1 and mesoscopic imaging of the entire cortical surface in a cohort of juvenile transgenic mice expressing GCaMP6f in cortical pyramidal neurons (Fig. 3). Mice were awake and free to run on a circular treadmill28, 29. Previous studies have suggested that S1 neurons are linked anatomically and functionally to bilateral sensorimotor areas16, 30, and we sought to determine the extent to which this network structure is shared among neighboring cells within S1.
Fig. 3. Simultaneous imaging reveals functional connectivity of single neurons with large-scale cortical networks.
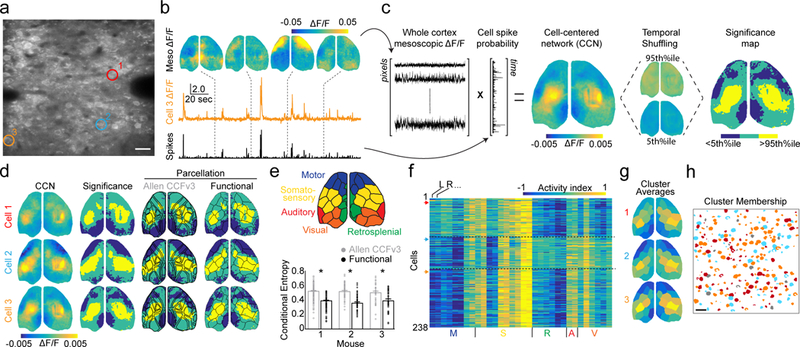
a, Example average two-photon field-of-view showing pyramidal neurons in a P17 mouse during simultaneous imaging. Colored circles highlight cells for panels (b-f). Scale bar is 20 μm. b, Example mesoscopic ΔF/F images with simultaneous ΔF/F trace and deconvolved spike probability for cell 3 from (a). c, Schematized procedure for calculating cell-centered networks (CCNs) and significance maps. d, Left: example CCNs for the three cells indicated in (a). Middle left: corresponding significance maps. Middle right: significance maps overlaid with an anatomical parcellation based on the Allen CCFv3. Right: significance maps overlaid with a functional parcellation calculated for that mouse. e, Illustration of the functional parcellation with regions labelled based on correspondence with the anatomical parcellation. Plot below shows the conditional entropy of significance maps given the anatomical or functional parcellation for three mice. Lower values indicate better fit. Mean±SEM: Allen CCFv3: H=0.54±0.01, 0.56±0.01, 0.53±0.02; functional: H=0.41±0.01, 0.39±0.01, 0.42±0.02; p < 0.001, paired two-tailed t-test for each mouse, n = 238, 64, 41 significance maps. f, Activity index calculated from all significance maps for a single animal using the functional parcellation. Higher values indicate a large number of pixels that are significantly co-active with each cell. Cells are clustered into three groups (see Methods). Arrows on the left indicate rows corresponding to the cells in (a). g, Averages of the three clusters in (f) with parcels colored by their activity index. h, Schematized two-photon field-of-view, same as in (a), with pixels colored to indicate membership of individual cells in the three clusters shown in (g). Scale bar is 20 μm.
We estimated the relative probability of cell spiking from its ΔF/F31 (Fig. 3a–b) and computed the dot product with the ΔF/F for each mesoscopic pixel, producing an activity-weighted map illustrating the co-activation-based functional connectivity of that neuron (Fig. 3c). To determine which pixels in these cell-centered networks (CCNs) are significantly activated or deactivated, we compared each CCN to a null distribution generated by randomly shuffling the timing of cell activity (Fig. 3c). We assessed the reliability of CCNs by computing this network structure separately for two halves of the data set (see Methods), and cells with a split-half Pearson’s correlation less than 0.3 were excluded from further analysis. Three example significance maps demonstrate that neighboring S1 neurons are coupled with distinct, though overlapping cortical networks (Fig. 3d). Notably, CCNs were highly similar for fluorescence time series extracted either manually or via automation (see Supplementary Fig. 2).
To quantify this diversity of CCNs, we first superimposed these maps derived from spontaneous activity onto a 16 node-per-hemisphere anatomical parcellation based on the Allen CCFv3 atlas9. The anatomical parcels were only in modest agreement with the contours of the activity-dependent CCNs (Fig. 3d), potentially due to individual differences in the functional organization of cortical networks across mice. As a complementary approach, we utilized a multi-graph k-way spectral clustering algorithm 32 to determine a functional 16 node-per-hemisphere parcellation for each mouse based on awake, spontaneous mesoscopic calcium imaging data recorded prior to prism implantation (Fig. 3e). This segmentation more closely approximated the CCN contours (Fig. 3d). To quantitatively compare the quality of fit provided by the two parcellations, we calculated the conditional entropy of each CCN given the parcellation (anatomical versus functional), where lower conditional entropy indicates a better fit. We found that across all three mice, the functional parcellation significantly outperformed the anatomical parcellation (anatomical: H=0.54±0.01, 0.56±0.01, 0.53±0.02; functional H=0.41±0.01, 0.39±0.01, 0.42±0.02; p < 0.001 for all; Fig. 3e). Analysis of sensory-evoked responses also revealed closer agreement of activity for functional versus anatomical parcellations (Supplementary Fig. 4).
CCNs may represent underlying structural motifs that reflect patterns of long-range connectivity4, 6. In order to identify categories of CCNs from our data, we calculated an activity index vector for each cell, which is the number of activated and deactivated pixels in each parcel normalized by the number of pixels in the parcel. We clustered these values to identify the three most prominent meso-scale patterns of activity for each mouse (Fig. 3f–g, Supplementary Fig. 5). For all three mice, the most prominent patterns included bilateral S1 activation, with variable activation of the medial motor cortex (cluster 1), deactivation of lateral motor cortex (cluster 2), and deactivation of visual (cluster 1) and retrosplenial cortex (clusters 1 and 3). Importantly, within these clusters are multiple outliers whose activity patterns are not well-captured by the cluster averages (Supplementary Fig. 6). Cells belonging to each cluster are spatially intermixed within the two-photon field-of-view (Fig. 3h, Supplementary Figure 5), suggesting long-range connectivity may be independent of local somatic position. We also examined other methods for assessing network membership of individual cells,15, 16 and found qualitatively similar results (Supplementary Fig. 7).
Viral vector-driven whole-brain expression of GCaMP6
Both mesoscopic and two-photon imaging of neuronal activity typically rely on expression of genetically-encoded indicators such as GCaMP6, which can be limited by the complexity of breeding transgenic driver and reporter mouse lines33–35 and the potential for pathological activity following embryonic indicator expression36. To overcome these challenges, we optimized a viral approach to achieve widespread and robust expression of GCaMP6s throughout the mouse brain using serotype 9 adeno-associated virus (AAV9) injected into the transverse sinuses of early postnatal animals.
AAV9 crosses the blood-brain barrier37, and recently published work demonstrated whole-brain gene delivery by retro-orbital injection of this serotype as well as other engineered AAV variants38. While retro-orbital injections are difficult and disruptive in early postnatal mice due to eyelid closure, the transverse sinuses are easily accessible along the posterior edge of the cortex, and the delivery of large volumes of virus is relatively simple (Fig. 4a).
Fig. 4. Systemic AAV9 produces robust GCaMP expression in the brain.
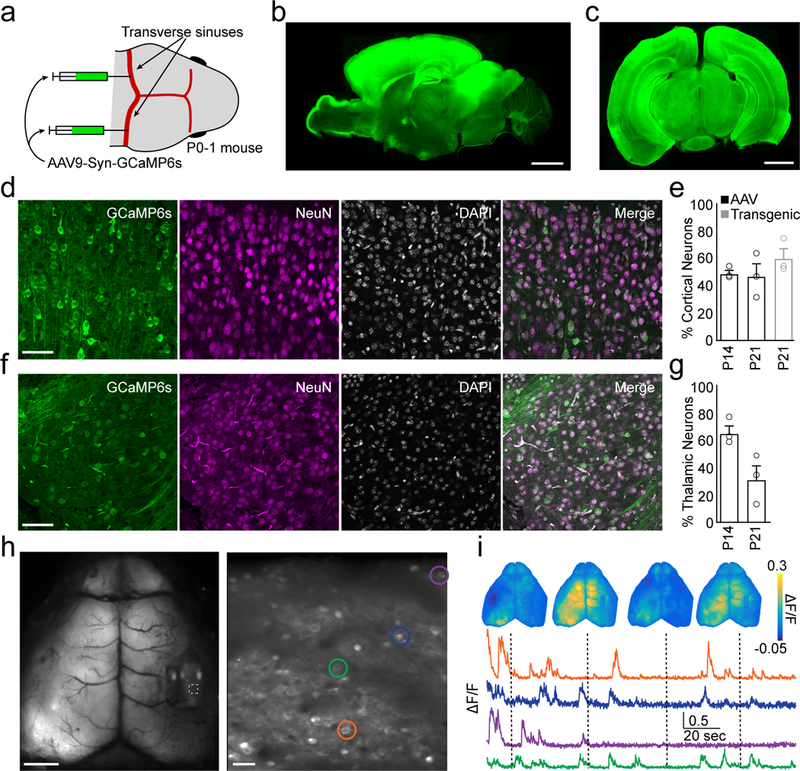
a, Schematic showing sites of viral injection in a neonatal mouse. b, Example sagittal section of a P21 mouse brain showing widespread expression of GCaMP6s across the cortex and other brain regions. Scale bar is 2 mm. c, Example coronal section. Scale bar is 2 mm. d, Confocal images showing GCaMP6s expression in mouse cortex at P14. Left: GCaMP6s, middle left: NeuN, middle right: DAPI, right: merge. Scale bar is 40 μm. Images are representative across 6 mice. e, Quantification of cortical neuron labeling at either P14 or P21 following AAV injection (black) or transgenic (Slc17a7-cre;CaMK2a-tTA;TITL-GCaMP6f) expression (gray). Mean±SEM: P14 AAV: 48.3±2.4, P21 AAV: 46.4±9.1, P21 transgenic: 59.3±7.0; n = 3 mice per group. f, As in (d), but for thalamus. Images are representative across 6 mice. g, As in (e), but for thalamus. Mean±SEM: P14 AAV: 65.3±5.5, P21 AAV: 31.5±10.3; n = 3 mice per group. h, Mean fluorescence images from simultaneously acquired mesoscopic (left, scale bar is 2 mm) and two-photon (right, scale bar is 20 μm) imaging following AAV9 sinus injection. i, Example simultaneously acquired mesoscopic ΔF/F images and cellular ΔF/F traces from cells indicated in (h).
We performed sinus injections of AAV9-Syn-GCaMP6s at P1 in wild-type mice and observed robust, widespread expression of green fluorescence as early as P14 throughout the brain, including both the telencephalon and diencephalon (Fig. 4b–c, see Methods). Using this method, we labeled 48.3±2.4% and 46.4±9.1% of cortical neurons at P14 and P21, respectively, similar to the density of cells (59.3±7.0%) labeled in transgenic mice (Fig. 4d–e). Virus injection also labeled 65.3±5.5% and 31.5±10.3% of thalamic neurons at P14 and P21, respectively (Fig. 4f–g). These virus-driven expression levels are sufficient for carrying out in vivo imaging (Fig. 4h–i). In our hands, neither widespread viral expression of GCaMP6 nor transgenic expression disrupted cortical electrophysiological activity relative to control mice (Supplementary Fig. 8). Moreover, we have also used this approach to drive indicator expression conditionally in genetically-specified GABAergic interneurons and in rats, enabling mesoscopic imaging in targeted cell types and across species39.
Distinct large-scale networks associated with arousal-modulated PNs and VIP-INs
A key advantage arising from the combination of optical imaging and genetically-encoded indicators is the ability to target sparse neuronal populations that may be critical for cortical function but are generally inaccessible to conventional electrophysiological approaches. For example, VIP-INs account for less than 2% of cortical neurons40, yet they have been strongly implicated in the arousal-dependent modulation of cortical activity via disinhibition of local pyramidal cells41, 42.
To investigate the coupling of VIP-INs to mesoscopic activity, we performed sinus injections of AAV9-Syn-GCaMP6s in P1 mice transgenically expressing the red fluorophore tdTomato in VIP-INs (see Methods). We also used local injections of AAV5-CAG-FLEX-GCaMP6s into S1 at P6 to boost GCaMP6s expression in VIP-INs. We then performed multi-scale imaging between P17-P19 (Fig. 5a). For all mice, we recorded whisker movements by videography (Fig. 5a–c) as a marker of arousal level29, 43. Across four mice, we analyzed 50 red fluorescent VIP-INs and 342 presumptive pyramidal (non-tdTomato-expressing) cells. For each cell, we calculated the correlation of its ΔF/F with whisker motion energy (see Methods) and categorized cells as significantly modulated (positively or negatively) or non-modulated by whisking (Fig. 5c).
Fig. 5. Cell-centered networks vary by neuronal class and sensitivity to arousal.
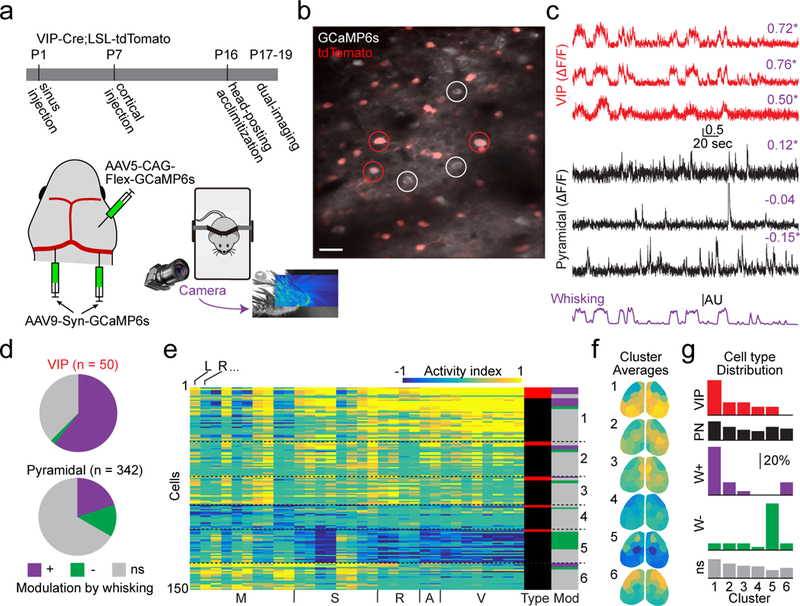
a, Schematic of experimental timeline and setup, including whisker tracking videography. Image shows example facial videography frame overlaid with whisker motion energy heat map. Warmer colors indicate higher mean pixel motion energy. b, Mean two-photon image from data acquired during dual-imaging showing GCaMP6s expression in tdTomato-positive (VIP-INs, examples circled in red) and -negative (presumptive pyramidal neurons, examples circled in white) cells. Scale bar is 20 μm. Image is representative of 15 fields-of-view across 4 mice. c, ΔF/F traces from VIP cells (red) and putative pyramidal cells (black) aligned with whisker motion energy (purple). Pearson’s correlation of ΔF/F with whisking is listed above each trace, with asterisks indicating significant values (p < 0.01, shuffle test, 1000 shuffles). d, Relative numbers of VIP-INs and pyramidal cells that are positively-, negatively-, or not significantly (ns) correlated with whisking (p < 0.01, shuffle test). e, Activity index calculated from all significance maps for all cells recorded in a single animal. Cells are clustered into six groups. Columns to the right indicate cell type (red indicates VIP-IN, black indicates pyramidal cell) and whether cells are correlated with whisking (colors as in d). f, Averages of the six clusters in (e) with parcels colored by their activity index. g, Fractional distribution of cells into each cluster, separated by type or modulation by whisking.
Of the VIP-INs analyzed, most were positively modulated by whisking (31/50), while pyramidal neurons were more diverse with cells both positively (69/342) and negatively (45/342) modulated by whisking (Fig. 5d). We calculated CCNs for both VIP-INs and pyramidal cells and applied the same parcellation and clustering approach as described above (6 clusters, Fig. 5e–f; Supplementary Fig. 9). Across animals, most VIP-INs clustered into one or two groups with their CCNs demonstrating enhanced postero-medial activity and reduced fronto-lateral activity (see Fig. 5f–g, clusters 1 and 2). Many pyramidal neuron CCNs, particularly for the whisking-positive cells, exhibited a similar pattern. In contrast, other pyramidal neurons, including most whisking-negative cells, exhibited complementary CCNs with enhanced fronto-lateral and reduced postero-medial activity (Fig. 5f–g, clusters 5 and 6). Neurons not modulated by whisking were broadly distributed across all clusters. Together, these results suggest the existence of two general categories of large-scale networks that reflect opposing engagement of distinct cortical areas (Supplementary Fig. 10).
We finally examined whether functional connectivity is stable across time and behavioral state. Overall, CCNs were highly correlated when the same neurons were imaged over two consecutive days (pyramidal r=0.85±0.03, n=19; VIP r=0.94±0.01, n=2; Supplementary Fig. 11). However, within a single session there was considerable variability in CCN organization depending on behavioral state. We independently generated CCNs for the same cell, dividing the session into periods of whisking and quiescence (non-whisking). This analysis revealed substantial heterogeneity between cells in the extent of state-dependent CCN re-mapping. Indeed, whisking-positive, whisking-negative, and non-modulated populations included examples of weak and strong re-mapping (Fig. 6). As a population, the whisking-positive cells exhibited significantly less remapping than both the whisking-negative or non-modulated neurons (p<0.001 for each, Kolmogorov-Smirnov test).
Fig. 6. Behavioral state is linked to CCN reorganization for a subset of neurons.
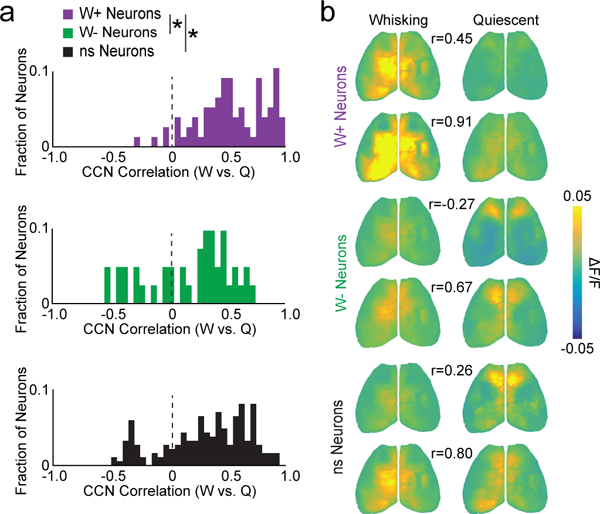
a, Distribution of Pearson’s correlation coefficients for CCNs derived during whisking versus quiescence, for whisking-positive, whisking-negative, and non-modulated neurons. P < 0.001 for indicated comparisons, Kolmogorov-Smirnov test, n = 97, 48, and 247 neurons for each group, respectively. b, Example CCNs for two neurons from each group showing either weak (upper images) or strong (lower images) correlation across whisking versus quiescent states. Pearson’s correlation coefficients are indicated.
Discussion
In the neocortex, the local and long-range synaptic connectivity of single neurons is thought to underlie spatially distributed networks dedicated to a range of cognitive, emotional, and motor functions. However, simultaneous monitoring of neuronal activity across spatial scales spanning several orders of magnitude remains an experimental challenge. We have presented an approach designed for this purpose, centered on a novel system for simultaneous two-photon cellular-resolution and mesoscopic whole-cortex calcium imaging. We provide novel evidence for diversity in the large-scale functional connectivity of individual cortical neurons. Consistent with anatomical studies, cells in S1 may participate in distinct networks based on their axonal projections9, 30, 44, 45. We find that CCNs derived from correlated two-photon and mesoscopic imaging signals suggest two general categories of connectivity reflecting opposing activity in fronto-lateral and postero-medial regions (see Supplementary Fig. 10). Membership in these groups is strongly influenced by cell type (pyramidal neuron versus VIP-IN) and sensitivity to behavioral state (i.e., whisking). As in previous studies28, 41, 46, VIP-INs are largely activated during arousal-associated behavioral states. Thus, the large-scale connectivity of these cells, as well as similarly modulated pyramidal cells, with a broad network of posterior and medial regions may define an “arousal network”. Moreover, the ability to image sparse populations of cells, such as VIP-INs that comprise less than 2% of cortical neurons, is a central benefit of our approach versus similar methods based on electrophysiology15, 16.
We expect that combining cellular and mesoscopic imaging will open up new avenues into the exploration of neuronal and behavioral variability. For example, layer 2/3 neurons in S1 respond sparsely and unreliably to whisker stimulation despite their necessity for whisker-guided behavior 47, and similar results have been reported for primary visual cortex 48. We hypothesize that such variability at the single neuron level may correspond to fluctuations in cortical network dynamics only discernible with approaches such as mesoscopic imaging. Thus, applying this system to the investigation of cortical activity during task performance will likely provide critical insights into links between cells, circuits, and behavior.
These imaging methods have been facilitated by the development of transgenic animals expressing bright, genetically-encoded indicators of activity and structure19, 34. While fluorescent calcium indicators have achieved prominence due to high signal to noise characteristics, recent advances in reporters of voltage49, 50 suggest the possibility of parallel mapping of cortical networks based on a range of markers. Indeed, we expect our transverse sinus injection technique for whole-brain gene delivery, along with other established methods for use in adult mice38, to accelerate the development of novel molecular imaging technologies without the need to generate costly transgenic animals.
Finally, these studies have been carried out in the context of a larger collaboration designed to relate neural activity across a broad range of spatiotemporal scales. Thus, we have also established an approach for carrying out mesoscopic calcium imaging simultaneously with functional magnetic resonance imaging (fMRI)17, linking the activity of genetically targeted cells to brain-wide activity measured by blood oxygenation level-dependent (BOLD) signaling. Overall, we believe that the technical and conceptual union of these varied techniques provides a powerful opportunity to drive novel investigation into the dynamic, functional architecture of the mammalian nervous system.
Online Methods
Dual-imaging microscope design
Our dual-imaging microscope is composed largely of commercially-available components or items that can be fabricated in a basic metalworking shop. The mesoscope is a Zeiss Axiozoom V.16 coupled to a PlanNeoFluar Z 1x, 0.25 NA objective with a 56 mm working distance. The mesoscope is mounted on a motorized Z-axis (Fluar Illuminator Z mot, Zeiss) with a manual X-axis dovetail slider (DTS50, Thorlabs) for precise positioning along two axes. Both the mesoscope and Z-axis motor are controlled remotely (EMS3 and Sycop3, Zeiss). Epifluorescence excitation is performed using a 7-channel LED driver (SpectraX, Lumencor) mated to the mesoscope by a 3 meter liquid light guide (Lumencor). The blue LED channel is filtered using a ET470/20x filter (Chroma) and the violet LED channel is filtered using a ET395/25x filter (Chroma). LED illumination is reflected onto the imaging plane using a FT495 (HE) dichroic mirror and epifluorescence emissions are filtered with a BP525/50 (HE) filter (38 HE, Zeiss) and recorded using a sCMOS camera (pco.edge 4.2) with 512×500 resolution after 4×4 pixel binning. Images are acquired by a computer running Camware software (pco). The intensity of the LED excitation at the imaging plane is between 0.027 mW/mm2 and 0.106 mW/mm2 calibrated for each experiment depending on the brightness of the indicator.
The two-photon microscope is a Movable Objective Microscope (MOM) with the Janelia wide-path design and galvo-resonant scanner (Sutter Instruments) that has been customized for optimal imaging in a horizontal configuration. Specifically, one of the PMTs was re-positioned 180 degrees from its original position and springs were added to reduce strain on the micromanipulator. Two-photon excitation is performed using a Ti:Sapphire laser (MaiTai eHP DeepSee, Spectra-Physics) with built-in dispersion compensation. Laser intensity into the microscope is controlled using a Pockels cell (Conoptics) for rapid modulation and the laser is expanded and collimated with a 1.25x Galilean beam expander (ACN254-100-B and AC254-125-B, Thorlabs). The laser is focused on the brain using an ultra-long-working distance objective with a 20mm WD and 0.40NA (M Plan Apo NIR 20x, Mitutoyo) that was selected for high transmission of visible and near-IR light. We also tested other objectives (see Supplementary Table 1) and achieved similar results. Fluorescent emitted light is reflected into the collection path by a FF735Di-02 dichroic mirror (Semrock), filtered with a ET500lp long pass filter (Chroma) and then split by a T565lpxr dichroic mirror (Chroma) into two GaAsP PMTs (H10770PA-40, Hamamatsu) with ET525/50m-2p (Chroma) and ET605/70m-2p (Chroma) filters for detection of green and red photons, respectively. The combination of excitation, dichroic, and emission filters described here results in a net OD of >15 in between the blue excitation illumination from the LED and the green emissions detected by the PMTs, which is sufficient to prevent contamination of the images formed by the two-photon microscope. The two-photon microscope is controlled using ScanImage 2017 (Vidrio Technologies) and images are acquired at 512×512 resolution with or without bi-directional scanning (see below).
Synchronization of imaging modalities
For simultaneous mesoscopic and two-photon imaging where the same emitted photons are being collected by the two modalities, we interleave frame acquisitions using a Master-8 (AMPI) stimulator to coordinate the timing and a Power3 DAQ and Spike2 software (Cambridge Electronic Design) to record all timing signals. Each “simultaneous” acquisition begins with a 33 – 66 millisecond two-photon acquisition (depending on whether bi-directional scanning is employed), followed by the simultaneous triggering of blue LED excitation for 30 milliseconds and sCMOS camera frame acquisition for 20 milliseconds (the difference is due to the 10 milliseconds necessary for the rolling shutter of the camera to open) followed, in some experiments, by the simultaneous triggering of violet LED excitation for 30 milliseconds and a second sCMOS camera frame acquisition for 20 milliseconds. The sequence ends with a 10 millisecond pause without any excitation or image acquisition, which is necessary to allow the PMTs to recover from the epifluorescence emissions excited by the LED. Data reported in Figures 2 and 3 were acquired without violet illuminated frames and bi-directional scanning and data reported in Figures 5 and 6 were acquired with violet illuminated frames and bi-directional scanning.
Surgical preparation and imaging set up
All surgeries were performed in accordance with the regulations set by the Yale University Institutional Animal Care and Use Committee and in accordance with NIH guidelines. The skin and fascia layers above the skull were removed to expose the entire dorsal surface of the skull from the posterior edge of the nasal bone to the middle of the interparietal bone, and laterally to the temporal muscles. The skull was thoroughly cleaned with saline and care was taken to not let the skull dry out. The edges of the skin incision were secured using cyanoacrylate (Vetbond, 3M). A custom headpost (see Fig. 1a, inset) was secured to the interparietal bone and along the lateral edge of the right parietal bone, first with Vetbond, and then with transparent dental cement (Metabond, Parkell), and a thin layer of dental cement was applied to the entire exposed skull. In some animals, a metal “visor” was also secured to the nasal bone to prevent light from the mesoscope from getting in the animal’s eyes. Once the dental cement dried, it was covered with a thin layer of clear nail polish or cyanoacrylate (Maxi-Cure, Bob Smith Industries). The combination of the dental cement and cyanoacrylate substantially increases the transparency of the skull.
For all imaging experiments described here, the mice were then allowed to recover for at least 3 hours in a heated recovery chamber and mesoscopic imaging was performed to record spontaneous activity. We also measured activity evoked by deflection of the left whiskers (10 Hz stimulation for 1 second every 40 seconds or a single 100 millisecond deflection every 10 seconds) using a piezo bender (PL112, Physik Instrumente) and activity evoked by the sound of the piezo bender when positioned away from the whiskers. These stimuli were used to map the location of the right barrel cortex and bilateral auditory cortex, respectively.
On the day following mesoscopic imaging, the mice were re-anesthetized and meloxicam (0.3 mg/kg) was administered SQ, a 2 mm square craniotomy was performed over the mapped location of the right barrel cortex, and a 2 mm square BK7 glass microprism (Tower Optical) was lowered directly onto the surface of the dura and the edges were secured to the skull using a viscous cyanoacrylate (Gel Control, Loctite). In one mouse, a 1.5mm square craniotomy and glass microprism was used, and in two other mice, a circular glass coverslip was placed over the surface of the dura and the microprism was glued to the coverslip. Mice were then allowed to recover for at least 3 hours and either imaged on the same day as surgery or returned to their home cages for imaging on subsequent days.
For optimal two-photon imaging, we attempted to minimize aberrations and loss of excitation power through reflection by adjusting the horizontal angle of the prism face by rotating the stage to which the animal is head-fixed and the vertical angle of the objective by rotating the microscope head, minimizing autofluorescence of the prism face as it moves through the imaging plane. Using these procedures, we could typically image GCaMP6 up to 400 μm deep using laser power emerging from the prism of <100 mW while scanning and flyback blanking during acquisition of mesoscopic frames. This value corresponded to 280 mW when the beam was parked at the center of the field of view.
This imaging preparation is stable over days to weeks if care is taken to clean and protect the implanted prism from debris in the animal’s home cage (or damage due to grooming behaviors). At the termination of an experiment, the microprisms could be recovered and cleaned with acetone, followed by 2M HCl, followed by 100% methanol, in which they could also be stored until a subsequent implantation.
Animal subjects
For dual-imaging experiments, we used either Slc17a7-cre/Camk2α-tTA/TITL-GCaMP6f 34, 51(The Jackson Laboratory strains 023527, 024108), Slc17a7-cre/TITL2-GCaMP6s 33(The Jackson Laboratory strains 023527, 031562), or VIP-cre/LSL-tdTomato 35, 52(The Jackson Laboratory strains 010908, 007909) mice. Mice were housed on a 12-hour light/dark cycle with food and water available ad libitum. For histological validation of sinus injections, we used C57BL/6J mice.
Transverse sinus injections
Postnatal-day-1 pups were taken out of their home cage with their entire litter and rested on a warm pad. Pups were anesthetized using hypothermia which was induced by laying them on ice for 2–3 minutes. They were then maintained on a cold metal plate for the duration of the procedure. A dissecting microscope was used to visualize the transverse sinuses (located on the dorsal surface of the mouse head between the parietal and interparietal bones). Fine scissors were used to make two small cuts (~2 mm) in the skin above each transverse sinus. To inject the virus, we used pulled capillary glass tubes. The sharp pipettes were filled with mineral oil and attached to a Nanoject III. Next, most of the mineral oil was pushed out of the pipette using the Nanoject, and vector solution was drawn into the pipette. For accurate movement of the Nanoject, we used a MP-285 micromanipulator (Sutter Instruments). The pipette was gently lowered into the sinus until the tip of the pipette broke through the sinus. The pipette tip was then raised up until it was 300–400 μm below the surface of the sinus. We next injected 4 μL of AAV9-Syn-GCaMP6s (Addgene) with a titer of ~3×10¹³ vg/mL. Injections were performed at a rate of 20 nL/second. An effective injection was verified by blanching of the sinus. After the injection, the skin was folded back, and a small amount of Vetbond glue was applied to the cut. The pup was then returned to the warm pad. After the entire litter was injected, the pups were returned to their home cage and gently rubbed with bedding to prevent rejection by the mother. At 13 or 20 days post-injection, juvenile mice were perfused with PBS and 4% paraformaldehyde (PFA) solution and brains were extracted, immersion fixed in PFA overnight, and rinsed with PBS.
Electrophysiological recordings
All extracellular single-unit and LFP recordings were made with an array of independently moveable tetrodes mounted in an Eckhorn Microdrive (Thomas Recording). Signals were digitized and recorded by a Digital Lynx system (Neuralynx). All data were sampled at 40kHz. All LFP recordings were referenced to the surface of the cortex and recorded with open filters. Single unit data was filtered from 600–9000Hz. Awake recordings were made from mice that had received handling and were habituated to head fixation. On the recording day, a small craniotomy was made over the recording area under light isoflurane anesthesia. The craniotomy was then covered with Kwik-Cast (World Precision Instruments) after which the mouse was allowed to recover for 2 hours. Mice were then fitted with a headpost and secured in before electrodes were lowered into either V1 or the dorsal hippocampus. Spikes were clustered semi-automatically, initially using KlustaKwik 2.0 software to identify a maximum of 30 clusters using the waveform Energy and Energy of the waveform’s first derivative as clustering features. We then used a modified version of the M-Clust environment to manually separate units and we selected well-isolated units. We further ensured that maximum contamination of the ISI (Inter-spike-interval) histogram <1.5 ms was smaller than 0.1%. The firing rate was computed by dividing the total number of spikes a cell fired in a given period by the total duration of that period. To compute LFP power spectra, we divided the data in 1s periods and calculated a multi-taper power spectral estimate for each segment.
Histological processing and immunohistochemistry
For assessment of sinus injections, juvenile brains were cut into 150 μm coronal or sagittal slices using a vibratome (Leica). Slices were transferred into 0.04% Triton solution, then blocked overnight with 10% goat serum at 4°C. After blocking, primary antibodies were diluted in the blocking solution (1:500), and slices were incubated in the primary antibody solution for 5 days at 4°C. The primary antibodies used were rabbit anti-GFP conjugated to AF488 (Millipore) and mouse anti-NeuN (Millipore). Slices were then washed three times with PBS, and incubated in secondary antibody diluted in blocking solution (1:500) overnight at 4°C. The secondary antibody used was goat anti-mouse AF555 (Millipore). Slices were washed three times with PBS, incubated in DAPI diluted in PBS (1:1000) for 15 min, washed three times with PBS and mounted on glass slides using Fluoromount G. Sagittal slice images were captured using a Zeiss Apotome microscope, and coronal slices used for quantification were imaged using a laser scanning confocal microscope (LSM 800, Zeiss) to determine co-localization between anti-GFP and anti-NeuN signals. Signal quantification was done using ImageJ software. Briefly, regions of interest (ROIs, i.e., cortex and thalamus) were selected, images were binarized, and the number of GCaMP6s+ and NeuN+ cells were counted manually. For each mouse, 2 to 6 separate fields-of-view were analyzed.
For assessment of Hsp70/72 levels, 40 μm coronal slices were cut from brains of mice that had undergone at least one hour of imaging through an implanted microprism. Blocking was performed overnight in a solution composed of 10% normal goat serum, 2% bovine serum albumin, and 0.5% Triton X-100, followed by incubation with 1:400 rabbit anti-Hsp70/72 (Enzo, ADI-SPA-812) and then 1:500 goat anti-rabbit Alexa Fluor 647 (Invitrogen, A-21245). Washes between incubations were performed with blocking solution and 0.1% Triton X-100. Images were acquired using an upright fluorescence microscope (Olympus), and the intensity of Hsp70/72 staining was quantified as the ratio of fluorescence intensity in a 900 μm diameter region under the center of the prism to the matched region in the contralateral hemisphere.
Injections for VIP experiments
For experiments in which the activity of individual VIP cells was measured simultaneously with mesoscopic pyramidal cell activity across the cortical mantle, we performed transverse sinus injections at P1, as described above. Sinus injection of AAV9-Syn-GCaMP6s preferentially labels pyramidal cells (data not shown). Therefore, to enhance the expression of GCaMP6s in VIP cells in S1, we also performed cortical injections of AAV5-CAG-Flex-GCaMP6s (Penn Vector Core) at P6. Between 400 – 600 nL of virus was injected using a Nanoject III. To perform these injections, a sharp glass pipette was cut to a 10 μm tip diameter and beveled at a 45° angle. Mice were anesthetized using 1–2% isoflurane and maintained at 37° on a water-recirculating heating pad. Meloxicam (0.3 mg/kg) was administered IP and lidocaine (0.5%) was administered locally SQ for analgesia. An incision was made to expose lambda and the pipette tip was moved with the micromanipulator to +1.8 mm anterior, +2.0 mm lateral from lambda, just above the surface of the skull. The skull was scraped with a scalpel blade at that location to thin it and then the pipette tip was slowly lowered until it pierced through, typically within 800 μm from the skull surface. The tip was then slowly withdrawn to a depth of 400 μm below the surface of the skull and the brain was allowed to settle for 5 minutes prior to injecting the virus at a rate of 2 nL/second. Five minutes after completion of the injection, the pipette was withdrawn and the incision was closed with Vetbond. The pup was allowed to recover on a warm heating pad. Prior to returning injected mice to their home cage, they were mixed with all of their littermates (injected and uninjected) and rubbed with bedding to prevent rejection by the dam.
Behavioral monitoring
To perform simultaneous mesoscopic and two-photon imaging in awake, behaving mice, we head-fixed the mice such that they could run freely on a cylindrical running wheel as described previously29. To assess the behavioral state of the mice, we performed videography of the face, including the whiskers and pupil, using a miniature CMOS camera (Flea3, FLIR) with a variable zoom lens (13VM20100AS, Tamron). The face was illuminated with an 850 nm NIR LED array. Face image acquisition was time-locked to the onset of the two-photon acquisition to ensure constant luminance across frames.
Quantification of imaging resolution
To calculate point spread functions (PSFs) for different methods of two-photon imaging, we embedded 0.2 μm yellow-green fluorescent microspheres (Invitrogen, F8848) in 1.5% agarose and took 45μm × 45μm × 50 μm z-stacks (11.4 × 11.4 × 2 pixels per μm) through either a double coverslip or a 2 mm square microprism. To compare with conventional upright two-photon imaging, we also performed measurements using a Zeiss W Plan Apochromat 20× 1.0 NA objective. We estimated PSFs by the lateral and axial full-width-at-half max of 20–25 well-separated bead images for each modality.
We also performed in vivo two-photon calcium imaging in approximately matched fields-of-view through a double coverslip and through a 2 mm microprism. In two Slc17a7/TITL2-GCaMP6s mice33, we implanted a double coverslip above left visual cortex and imaged layer 2/3 in awake mice during passive viewing of full-field drifting gratings (spatial frequency 0.04 cycles/degree, temporal frequency 0.5 cycles/second, 10 presentations of 12 orientations, 2 second stimulus, 5 second inter-stimulus interval) presented to the right eye. Using the surface vasculature, we approximately matched the locations of imaging using the Zeiss water-immersion and Mitutoyo air objectives through the double coverslip. We then glued the microprism over the double coverslip and imaged the same region through the microprism using the Mitutoyo air objective. Signal-to-noise ratio was calculated as the mean amplitude of the response of each cell during stimulus presentation divided by the standard deviation of its fluorescence. Orientation selectivity index was calculated for visually responsive cells as 1 – circular variance53, with the response to each presentation of a drifting grating calculated as (F – F0) / F0, where F is the mean fluorescence during the two second grating presentation and F0 is the mean fluorescence during the two seconds preceding grating presentation. A cell was classified as visually responsive if its mean response to one or more drifting grating directions was greater than one standard deviation above its mean normalized fluorescence (ΔF/F).
Analysis methods
Two-photon data pre-processing
Two-photon data was motion corrected for x-y displacements by rigid body transformation using the moco toolbox24 in ImageJ (NIH). For data acquired from VIP-cre/LSL-tdTomato mice, motion correction was performed on the tdTomato frames and the calculated offsets were applied to the GCaMP frames. Motion-corrected frames were then top-hat filtered across time to compensate for whole frame changes in brightness and ROIs were manually selected and neuropil signal was removed from each ROI’s fluorescence signal as described elsewhere8, 19. ΔF/F was calculated for each cell using the 10th percentile as the baseline. In some cases of cells expressing both GCaMP6 and tdTomato, we observed bleaching in the green fluorescence intensity over a 20-minute dual-imaging session. To compensate, we fit the baseline of each cell’s ΔF/F trace with a second-order exponential and removed the decay component. We use skewness as a proxy measure for cell activity, calculating skewness for each cell’s ΔF/F trace and excluding all cells with a value less than 0.5. For all experiments, we confirmed by visual inspection that this threshold results in a very low false positive rate for both pyramidal and VIP cells. To compare with alternative cellular data extraction methods, we used Suite2p25 set to default parameters for non-rigid correction of motion artifacts and automatic extraction of ROIs. This approach yielded similar results (see Supplementary Fig. 2).
Mesoscopic data pre-processing
Mesoscopic data was rotated to align the anterior posterior axis with vertical and then a mask was super-imposed to remove pixels outside of cortex as well as over the superior sagittal sinus. Slow drifts in the baseline fluorescence of each pixel were removed using top-hat filtering across time (300 frame filter object). For data acquired without interleaved violet illuminated frames, ΔF/F for each pixel was calculated using the top-hat filtered traces and setting the baseline to the 10th percentile value for each pixel across time. To remove changes presumably attributable to motion or hemodynamic artifacts, we performed global signal regression, which zero-centers the data, and then spatially smoothed the data using a Gaussian filter (σ = 2). For data acquired with interleaved violet illuminated frames, we performed pixel-wise regression of the (top-hat filtered) violet illuminated fluorescence values from the blue illuminated fluorescence values. GCaMP fluorescence emissions under violet illumination are largely calcium-independent 19. Therefore, fluctuations in fluorescence values should be largely attributable to (sub-pixel or z-axis) brain motion or hemodynamic artifacts. ΔF/F for each pixel was then calculated using the mean fluorescence value for each pixel across time and each frame was spatially smoothed using a Gaussian filter (σ = 2).
Behavioral state measures pre-processing
To calculate running speed, the angular position of the wheel (recorded at 5000 Hz) was down-sampled by a factor of 100 and converted to real displacement. To quantify whisking, we cropped the facial videos to only include the area corresponding to the whiskers and calculated motion energy as the frame-to-frame change in intensity of each pixel. In addition to the displacement of the whiskers, this measure also reflects movements of the mouse’s nose.
Cell-centered network calculation
Cell-centered networks (CCNs) were calculated by taking the dot product of the matrix of ΔF/F values for all mesoscopic pixels over time and each cell’s normalized spike probability vector. The single cell spike probability vectors were calculated using constrained-foopsi31 normalized by the integral of each cell’s spike probability over time. This method has two advantages – the first is to increase the weighting of the onset of calcium transients to more accurately approximate the timing of cell spiking and the second is to center all of the derived network map pixel values to the mean of their activity over time. This facilitates easy comparison of CCNs within animals. To determine which cortical areas are significantly activated or deactivated coincident with the activity of individual cells, we generated a null distribution of CCNs for each cell by randomly circularly shifting the timing of cell spike probability relative to pixel ΔF/F. This method is necessary due to the statistical dependence of successive timepoints in a cell’s spike probability vector. All pixels below the 5th percentile or above the 95th percentile of the distribution were classified as significantly deactivated or activated, respectively. For all significance maps shown, blue pixels are referred to as “deactivated” and yellow pixels are referred to as “activated.”
We compared our method to similar methods from other groups (calculating the correlation of cell activity and pixel activity15 or averaging the activity of time points when the cell is estimated to have fired an action potential16) and found that results were consistent across methods.
Parcellation of mesoscopic imaging data
For the anatomical parcellation, we used a parcellation based on the Allen Common Coordinate Framework version 3 (CCFv3). We combined some small parcels, such as the higher-order visual areas (8 defined areas combined into 2 parcels), to create a 16-node-per-hemisphere parcellation, which we aligned to each mouse using the superior sagittal sinus, transverse sinuses, inferior cerebral veins, and the stimulation evoked positions of barrel and auditory cortex. To compensate for differences in the angle of the skull between mice, we scaled the two hemispheres independently.
For the individualized functional parcellation, we applied a multi-graph k-way spectral clustering algorithm, as is described in greater detail elsewhere17. For each mouse, the parcellation was determined using mesoscopic-only imaging data collected prior to microprism implantation. In this way, we avoid overfitting of the activity within each session. To apply the parcellation to the data collected during subsequent dual-imaging trials, we calculated the transformation to register the dual-imaging acquisitions to the mesoscopic acquisition using an automated intensity-based registration and then applied the same transformation to the functional parcellation. For all animals, the transformation was rigid, except for one animal for which the parcellation was also linearly scaled. We set the number of parcels to 16 per hemisphere in order to match the anatomical parcellation. The functional parcellations of the two hemispheres were obtained separately, thus there is no guarantee that the parcels from the two hemispheres are symmetric. Moreover, differences in surface vasculature between mice had a notable impact on the parcellation results. In spite of this, the functional parcellation shows a large degree of symmetry across a range of number of parcels from N=2 to N = 20 per hemisphere.
We quantified the alignment between the significance maps and the parcellations using an information theory measure called conditional entropy H(Y/X). Y represents the significance map and X represents the parcellation (anatomical or functional). If the significance map aligns with the parcellation, the information contained in X and Y are similar, thus the conditional entropy will be low. If Y is completely determined by X, then H(Y/X) = 0. On the contrary, if Y is independent of X, H(Y/X) will be high. Two conditional entropy values were calculated for each neuron (same significance map), one based on the functional parcellation and the other based on the anatomical parcellation.
Clustering of cell-centered networks
Using the significance map for each selected neuron, we calculated the fraction of pixels within each parcel that are significantly activated or deactivated, resulting in an activation index and a deactivation index for every parcel. We combined all of these activation and deactivation indices into a single feature vector for each neuron, summarizing the pattern of whole-cortex activation (and deactivation) coincident with its activity. To find the representative mesoscopic patterns of activation for all neurons, we clustered the feature vectors for all recorded neurons within an animal using the spectral clustering algorithm (same algorithm used to generate the functional parcellation). In this way, we divided the neurons into three groups (data in Fig. 3) or six groups (data in Fig. 5) based on their feature vectors. For visualization purposes, we combined the positive and negative feature vectors into a single vector for each neuron with values from −1 (all pixels significantly deactivated) to 1 (all pixels significantly activated), which we label the “activity index.”
Analysis of cellular response to whisking
We calculated the Pearson’s correlation of each cell’s ΔF/F trace with simultaneously acquired whisker motion energy traces. We determined the significance of this correlation by performing 1000 random circular shifts of the timing of whisking relative to cell activity and setting significance as less than the 1st percentile or greater than the 99th percentile.
Statistical tests
Statistical analyses were performed using Matlab (v2016b) and Prism (v7). Data are presented as mean with standard error of the mean, unless otherwise specified. All values of n are provided; no data were excluded. Comparisons between datasets were performed using two-sided Student’s t-tests, unless otherwise specified. P values are specified whenever possible but values less than 0.001 are reported as p < 0.001.
Supplementary Material
Acknowledgements
The authors thank all members of the Multiscale Imaging of Spontaneous Activity in Cortex (MISAC) collaboration at Yale University for input during all stages of this project. We thank X. Ge, L. Tang, D. Scheinost, and E. Mohns for input on data analysis, K. Zhang for assistance with data pre-processing, Y. Zhang for assistance with animal husbandry and maintenance, and members of the Cardin, Constable, Crair, and Higley laboratories for helpful comments during the preparation of this manuscript. We thank D. Kim and the GENIE Project (Janelia Farms) for GCaMP6 plasmids. We thank H. Zeng (Allen Institute) for the TIGRE2 transgenic mice. This work was supported by funding from the NIH (MH099045 to MJH, EY022951 to JAC, NS094358 to MCC and RTC, EY026878 to MCC, MH111424 to RTC and MCC, EY029581 to DB, GM007205 to DB, NS007224 to DB, EY028869 to ASH, P30EY026878 to MCC, MJH, and JAC. MCC was supported by the William Ziegler III family.
Footnotes
Data availability
The data that support the findings of this study are available from the corresponding authors upon request.
Code availability
All code used for analyses is available at Code Ocean (doi: ).
Conflicts of Interest
The authors declare no conflicts of interest exist.
References
- 1.Jiang X., et al. Principles of connectivity among morphologically defined cell types in adult neocortex. Science 350, aac9462 (2015). [DOI] [PMC free article] [PubMed] [Google Scholar]
- 2.Wall NR, et al. Brain-Wide Maps of Synaptic Input to Cortical Interneurons. J Neurosci 36, 4000–4009 (2016). [DOI] [PMC free article] [PubMed] [Google Scholar]
- 3.Wertz A., et al. PRESYNAPTIC NETWORKS. Single-cell-initiated monosynaptic tracing reveals layer-specific cortical network modules. Science 349, 70–74 (2015). [DOI] [PubMed] [Google Scholar]
- 4.Crochet S., Lee SH & Petersen CCH Neural Circuits for Goal-Directed Sensorimotor Transformations. Trends Neurosci (2018). [DOI] [PubMed] [Google Scholar]
- 5.Kim EJ, Juavinett AL, Kyubwa EM, Jacobs MW & Callaway EM Three Types of Cortical Layer 5 Neurons That Differ in Brain-wide Connectivity and Function. Neuron 88, 1253–1267 (2015). [DOI] [PMC free article] [PubMed] [Google Scholar]
- 6.Chen JL, Carta S., Soldado-Magraner J., Schneider BL & Helmchen F. Behaviour-dependent recruitment of long-range projection neurons in somatosensory cortex. Nature 499, 336–340 (2013). [DOI] [PubMed] [Google Scholar]
- 7.Han Y., et al. The logic of single-cell projections from visual cortex. Nature 556, 51–56 (2018). [DOI] [PMC free article] [PubMed] [Google Scholar]
- 8.Lur G., Vinck MA, Tang L., Cardin JA & Higley MJ Projection-Specific Visual Feature Encoding by Layer 5 Cortical Subnetworks. Cell reports 14, 2538–2545 (2016). [DOI] [PMC free article] [PubMed] [Google Scholar]
- 9.Oh SW, et al. A mesoscale connectome of the mouse brain. Nature 508, 207–214 (2014). [DOI] [PMC free article] [PubMed] [Google Scholar]
- 10.Yang H., Kwon SE, Severson KS & O’Connor DH Origins of choice-related activity in mouse somatosensory cortex. Nat Neurosci 19, 127–134 (2016). [DOI] [PMC free article] [PubMed] [Google Scholar]
- 11.Jun JJ, et al. Fully integrated silicon probes for high-density recording of neural activity. Nature 551, 232–236 (2017). [DOI] [PMC free article] [PubMed] [Google Scholar]
- 12.Kim CK, et al. Simultaneous fast measurement of circuit dynamics at multiple sites across the mammalian brain. Nature methods 13, 325–328 (2016). [DOI] [PMC free article] [PubMed] [Google Scholar]
- 13.Sofroniew NJ, Flickinger D., King J. & Svoboda K. A large field of view two-photon mesoscope with subcellular resolution for in vivo imaging. eLife 5, 10.7554/eLife.14472 (2016). [DOI] [PMC free article] [PubMed] [Google Scholar]
- 14.Stirman JN, Smith IT, Kudenov MW & Smith SL Wide field-of-view, multi-region, two-photon imaging of neuronal activity in the mammalian brain. Nat Biotechnol 34, 857–862 (2016). [DOI] [PMC free article] [PubMed] [Google Scholar]
- 15.Clancy K., Orsolic I. & Mrsic-Flogel TD Locomotion-dependent remapping of distributed cortial networks. Nat Neurosci 22, 778–786 (2019). [DOI] [PMC free article] [PubMed] [Google Scholar]
- 16.Xiao D., et al. Mapping cortical mesoscopic networks of single spiking cortical or sub-cortical neurons. eLife 6, 10.7554/eLife.19976 (2017). [DOI] [PMC free article] [PubMed] [Google Scholar]
- 17.Lake EM, et al. Spanning spatiotemporal scales with simultaneous mesoscopic Ca2+imaging and functional MRI. bioRxiv (2018). [Google Scholar]
- 18.Lecoq J., et al. Visualizing mammalian brain area interactions by dual-axis two-photon calcium imaging. Nature neuroscience 17, 1825–1829 (2014). [DOI] [PMC free article] [PubMed] [Google Scholar]
- 19.Chen TW, et al. Ultrasensitive fluorescent proteins for imaging neuronal activity. Nature 499, 295–300 (2013). [DOI] [PMC free article] [PubMed] [Google Scholar]
- 20.Ma Y., et al. Wide-field optical mapping of neural activity and brain haemodynamics: considerations and novel approaches. Philosophical transactions of the Royal Society of London.Series B, Biological sciences 371, 10.1098/rstb.2015.0360 (2016). [DOI] [PMC free article] [PubMed] [Google Scholar]
- 21.Allen WE, et al. Global Representations of Goal-Directed Behavior in Distinct Cell Types of Mouse Neocortex. Neuron 94, 891–907.e896 (2017). [DOI] [PMC free article] [PubMed] [Google Scholar]
- 22.Ackman JB, Burbridge TJ & Crair MC Retinal waves coordinate patterned activity throughout the developing visual system. Nature 490, 219–225 (2012). [DOI] [PMC free article] [PubMed] [Google Scholar]
- 23.Ackman JB, Zeng H. & Crair MC Structured dynamics of neural activity across developing neocortex. bioRxiv (2014). [Google Scholar]
- 24.Dubbs A., Guevara J. & Yuste R. moco: Fast Motion Correction for Calcium Imaging. Frontiers in neuroinformatics 10, 6 (2016). [DOI] [PMC free article] [PubMed] [Google Scholar]
- 25.Pachitariu M., et al. Suite2p: beyond 10,000 neurons with standard two-photon microscopy. BioRXiv (2017). [Google Scholar]
- 26.Podgorski K. & Ranganathan G. Brain heating induced by near-infrared lasers during multiphoton microscopy. J Neurophysiol 116, 1012–1023 (2016). [DOI] [PMC free article] [PubMed] [Google Scholar]
- 27.Franklin TB, Krueger-Naug AM, Clarke DB, Arrigo AP & Currie RW The role of heat shock proteins Hsp70 and Hsp27 in cellular protection of the central nervous system. Int J Hyperthermia 21, 379–392 (2005). [DOI] [PubMed] [Google Scholar]
- 28.Batista-Brito R., et al. Developmental Dysfunction of VIP Interneurons Impairs Cortical Circuits. Neuron 95, 884–895 e889 (2017). [DOI] [PMC free article] [PubMed] [Google Scholar]
- 29.Vinck M., Batista-Brito R., Knoblich U. & Cardin JA Arousal and locomotion make distinct contributions to cortical activity patterns and visual encoding. Neuron 86, 740–754 (2015). [DOI] [PMC free article] [PubMed] [Google Scholar]
- 30.DeNardo LA, Berns DS, DeLoach K. & Luo L. Connectivity of mouse somatosensory and prefrontal cortex examined with trans-synaptic tracing. Nat Neurosci 18, 1687–1697 (2015). [DOI] [PMC free article] [PubMed] [Google Scholar]
- 31.Pnevmatikakis EA, et al. Simultaneous Denoising, Deconvolution, and Demixing of Calcium Imaging Data. Neuron 89, 285–299 (2016). [DOI] [PMC free article] [PubMed] [Google Scholar]
- 32.Shen X., Papademetris X. & Constable RT Graph-theory based parcellation of functional subunits in the brain from resting-state fMRI data. NeuroImage 50, 1027–1035 (2010). [DOI] [PMC free article] [PubMed] [Google Scholar]
- 33.Daigle TL, et al. A Suite of Transgenic Driver and Reporter Mouse Lines with Enhanced Brain-Cell-Type Targeting and Functionality. Cell 174, 465–480 e422 (2018). [DOI] [PMC free article] [PubMed] [Google Scholar]
- 34.Madisen L., et al. Transgenic mice for intersectional targeting of neural sensors and effectors with high specificity and performance. Neuron 85, 942–958 (2015). [DOI] [PMC free article] [PubMed] [Google Scholar]
- 35.Taniguchi H., et al. A resource of Cre driver lines for genetic targeting of GABAergic neurons in cerebral cortex. Neuron 71, 995–1013 (2011). [DOI] [PMC free article] [PubMed] [Google Scholar]
- 36.Steinmetz NA, et al. Aberrant Cortical Activity in Multiple GCaMP6-Expressing Transgenic Mouse Lines. eNeuro 4 (2017). [DOI] [PMC free article] [PubMed] [Google Scholar]
- 37.Foust KD, et al. Intravascular AAV9 preferentially targets neonatal neurons and adult astrocytes. Nature biotechnology 27, 59–65 (2009). [DOI] [PMC free article] [PubMed] [Google Scholar]
- 38.Chan KY, et al. Engineered AAVs for efficient noninvasive gene delivery to the central and peripheral nervous systems. Nature neuroscience 20, 1172–1179 (2017). [DOI] [PMC free article] [PubMed] [Google Scholar]
- 39.Hamodi AS, Sabino AM, Fitzgerald ND & Crair MC Transverse sinus injections: A novel method for whole-brain vector-driven gene delivery. BioRXiv (2019). [Google Scholar]
- 40.Tremblay R., Lee S. & Rudy B. GABAergic Interneurons in the Neocortex: From Cellular Properties to Circuits. Neuron 91, 260–292 (2016). [DOI] [PMC free article] [PubMed] [Google Scholar]
- 41.Fu Y., et al. A cortical circuit for gain control by behavioral state. Cell 156, 1139–1152 (2014). [DOI] [PMC free article] [PubMed] [Google Scholar]
- 42.Pfeffer CK, Xue M., He M., Huang ZJ & Scanziani M. Inhibition of inhibition in visual cortex: the logic of connections between molecularly distinct interneurons. Nat Neurosci 16, 1068–1076 (2013). [DOI] [PMC free article] [PubMed] [Google Scholar]
- 43.Lenschow C. & Brecht M. Barrel cortex membrane potential dynamics in social touch. Neuron 85, 718–725 (2015). [DOI] [PubMed] [Google Scholar]
- 44.Klingler E., et al. Single-cell molecular connectomics of intracortically-projecting neurons. bioRxiv (2018). [Google Scholar]
- 45.Tang L. & Higley MJ Layer 5 circuits in V1 differentially control visuomotor behavior. bioRxiv (2019). [DOI] [PMC free article] [PubMed] [Google Scholar]
- 46.Lee S., Kruglikov I., Huang ZJ, Fishell G. & Rudy B. A disinhibitory circuit mediates motor integration in the somatosensory cortex. Nat Neurosci 16, 1662–1670 (2013). [DOI] [PMC free article] [PubMed] [Google Scholar]
- 47.O’Connor DH, Peron SP, Huber D. & Svoboda K. Neural activity in barrel cortex underlying vibrissa-based object localization in mice. Neuron 67, 1048–1061 (2010). [DOI] [PubMed] [Google Scholar]
- 48.Sriram B., Li L.,Cruz-Martin A., & Ghosh A. A sparse probabilistic code underlies the limits of behavioral discrimination. Cell reports, (2019). [Epub ahead of print] [DOI] [PMC free article] [PubMed] [Google Scholar]
- 49.Chavarha M., et al. Fast two-photon volumetric imaging of an improved voltage indicator reveals electrical activity in deeply located neurons in the awake brain. bioRxiv (2018). [Google Scholar]
- 50.Kannan M., et al. Fast, in vivo voltage imaging using a red fluorescent indicator. Nat Methods 15, 1108–1116 (2018). [DOI] [PMC free article] [PubMed] [Google Scholar]
- 51.Harris JA, et al. Anatomical characterization of Cre driver mice for neural circuit mapping and manipulation. Frontiers in neural circuits 8, 76 (2014). [DOI] [PMC free article] [PubMed] [Google Scholar]
- 52.Madisen L., et al. A robust and high-throughput Cre reporting and characterization system for the whole mouse brain. Nature neuroscience 13, 133–140 (2010). [DOI] [PMC free article] [PubMed] [Google Scholar]
- 53.Ringach DL, Shapley RM & Hawken MJ Orientation selectivity in macaque V1: diversity and laminar dependence. J Neurosci 22, 5639–5651 (2002). [DOI] [PMC free article] [PubMed] [Google Scholar]
Associated Data
This section collects any data citations, data availability statements, or supplementary materials included in this article.