

ABSTRACT
Background
Low tissue concentrations of carotenoids have been suggested to contribute to insulin resistance in obesity.
Objectives
The objectives of the study were to 1) evaluate the relations of adipose tissue and serum carotenoids with body fat, abdominal fat distribution, muscle, adipose tissue and liver insulin resistance, and dietary intake; 2) evaluate the relations and distributions of carotenoids detected in adipose tissue and serum; and 3) compare serum carotenoids and retinol concentrations in subjects with and without obesity.
Methods
Post hoc analysis of serum and adipose tissue carotenoids in individuals [n = 80; 31 men, 49 women; age (mean ± SEM): 51.4 ± 1.1 y] who participated in 2 separate studies conducted at the Clinical Research Facility at the Garvan Institute of Medical Research (Sydney) between 2008 and 2013. Retinol, α-carotene, β-carotene, ζ-carotene, lutein, lycopene, phytoene, and phytofluene were measured using HPLC. Body composition was measured by dual-energy X-ray absorptiometry. Insulin resistance was measured by 2-step hyperinsulinemic-euglycemic clamps with deuterated glucose (n = 64), and subcutaneous and visceral abdominal volume and liver and pancreatic fat by MRI (n = 60). Periumbilical subcutaneous fat biopsy was performed and carotenoids and retinol measured in the tissue (n = 16).
Results
We found that ζ-carotene, phytoene, and phytofluene were stored in considerable amounts in adipose tissue (25% of adipose tissue carotenoids). Carotenoid concentrations in adipose tissue and serum correlated significantly, but they followed different distributions: ζ-carotene was 3-fold higher in adipose tissue compared with serum, while lutein and lycopene made up 20% and 21% of serum carotenoids compared with 2% and 12% of adipose tissue carotenoids, respectively. Liver (P ≤ 0.028) and adipose tissue (P = 0.023), but not muscle (P ≥ 0.16), insulin resistance correlated inversely with many of the serum carotenoids.
Conclusions
Multiple serum and adipose tissue carotenoids are associated with favorable metabolic traits, including insulin sensitivity in liver and adipose tissue in humans.
Keywords: carotenoids, retinol, obesity, insulin resistance, dietary carotene, adipose tissue carotenoids, serum carotenoids
Introduction
Carotenoids are natural pigments, mainly absorbed from vegetables and fruit in the diet and cannot be synthesized in the human body (1). Liver and adipose tissue are main sites of carotenoid accumulation (2, 3), and it has been suggested that carotenoids and their metabolites play a role in metabolic processes within these tissues (4). Nutritional deficiencies in carotenoids and low serum concentrations of carotenoids were documented in obesity (5, 6), but it remains unclear whether lower concentrations of carotenoids in tissues in obesity are associated with glucose dysregulation in adipose tissue, liver, and muscle.
Lower serum carotenoids were reported in children, adolescents, and adults with overweight and obesity (6–9) and in type 2 diabetes (10, 11); and plasma carotenoids concentrations were associated inversely with fasting insulin, glycated hemoglobin (HbA1c), and the insulin resistance surrogate HOMA-IR (12, 13). Retinol may originate in the diet or generated de novo from α-carotene, β-carotene, and β-cryptoxanthin. Retinol can be metabolized to retinoic acid, ligand for nuclear receptors involved in transcription of genes implicated in metabolic pathways (14). Findings regarding the relation between serum retinol, obesity, and type 2 diabetes in humans are inconsistent. Some studies suggested reduced (15, 16), others indicated elevated (12, 17), and some did not find significant changes (10, 18) in retinol status in obesity and type 2 diabetes.
Studies in cell cultures and rodents highlighted the role of carotenoids and their metabolites in adipose tissue secretion of adipokines, adipogenesis, and inflammation (14, 19, 20). BMI and waist circumference were inversely associated with adipose tissue content of α- and β-carotene and lycopene (21), and carotenoids in fat tissue sampled from the abdomen, buttock, and thigh were inversely related to body fat mass (22). Furthermore, β-carotene content in subcutaneous adipocytes collected in subjects with obesity were half that measured in adipocytes collected in individuals who were of normal weight (23). In most previous studies, limited number of carotenoids have been analyzed and many not reported.
In the present study, we measured 7 carotenoids and their isomers in subcutaneous abdominal adipose tissue and serum in men and women with a wide range of BMI. Our aims were to 1) study the associations between adipose tissue and serum carotenoids and retinol status with body fat composition, abdominal fat distribution, circulating metabolic markers, glucose regulation, and dietary intake; 2) evaluate the relations and distributions of carotenoids detected in adipose tissue and serum; and 3) compare serum carotenoids and retinol concentrations between individuals with or without obesity.
Methods
This study consisted of 2 separate cohorts studied at the Garvan Institute of Medical Research Clinical Research Facility (Sydney, Australia) between 2008 and 2013 (Figure 1). The protocols were approved by the St Vincent's Hospital Human Research Ethics Committee (Sydney, Australia), and written consent was obtained prior to study commencement.
FIGURE 1.
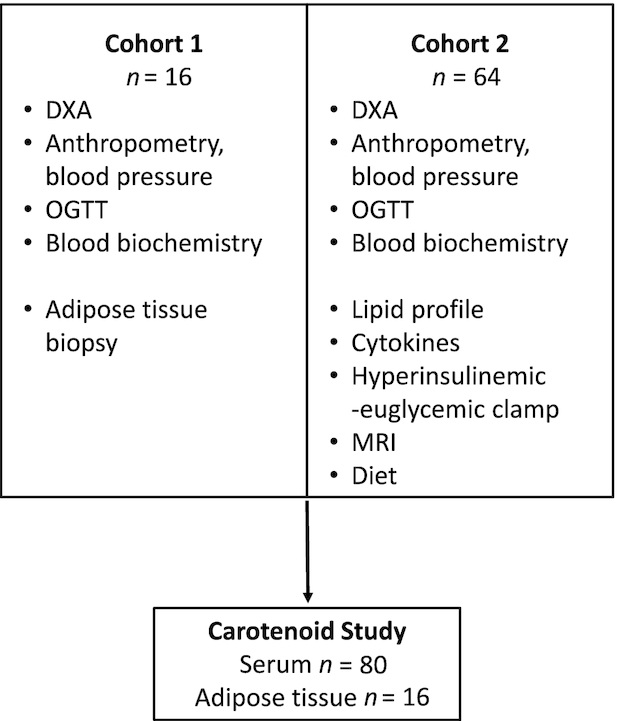
Participant flowchart. Serum and adipose tissue carotenoids and retinol were analyzed in samples collected in 2 separate cohorts recruited at the Clinical Research Facility at the Garvan Institute of Medical Research between 2008 and 2013. Protocols performed and number of participants are listed in the boxes. OGTT, oral-glucose-tolerance test.
Subjects
Adult men and women were recruited through advertisements in local newspapers and at the Garvan Institute of Medical Research/St Vincent's Hospital precinct (Sydney). Inclusion criteria for the 2 studies were similar and included age 18–70 y and individuals had to maintain a relatively sedentary lifestyle (moderate/high-intensity exercise under 150 min per week). Exclusion criteria were treatment with medications known to affect glucose metabolism (glucose lowering, glucocorticoids); excessive alcohol intake; weight change >5% in the 3 mo leading up to the study; renal, cardiac, or liver disease; diabetes; and cancer. Subjects underwent a 75-g oral-glucose-tolerance test, and participants with diabetes were excluded using the American Diabetes Association criteria. Cohort 1 (n = 16) consisted of individuals with BMI ranging from 18.5 to 35.6 kg/m2 and cohort 2 (n = 64) consisted of individuals with obesity (BMI ranging from 30.1 to 48.5 kg/m2) (24). All participants were Caucasian.
Study protocols
In both studies, participants arrived at the Clinical Research Facility early in the morning after overnight fasting, and measurements of blood pressure and anthropometry were undertaken.
Muscle, liver, and adipose tissue insulin resistance
The 2-step hyperinsulinemic-euglycemic clamp with deuterated glucose (D-glucose; Cambridge Isotope Laboratories) was performed in cohort 2, as previously described (24). Endogenous glucose production (EGP) was calculated as described (24) and reflects hepatic insulin resistance. Glucose infusion rate was calculated at 90–120 min of the high-dose insulin clamp, and M-value was calculated by dividing the glucose infusion rate by body fat-free mass. Since EGP was fully suppressed during the high-dose insulin infusion, M-value reflects peripheral (mainly muscle) insulin resistance (24). Adipose tissue insulin resistance was calculated by the suppression of nonesterified fatty acid (NEFA) from baseline to the low-dose insulin clamp steady state (NEFA suppression) (24). A surrogate of adipose tissue insulin resistance was calculated as the product of fasting circulating NEFA and insulin (25). For 2 subjects, liver insulin resistance could not be calculated due to plasma tracer sampling or analysis errors; therefore, basal EGP data are available for n = 62.
Body fat composition and abdominal fat distribution
Body fat and fat-free mass were measured by dual-energy X-ray absorptiometry (DXA) (Lunar Prodigy; GE-Lunar) in both cohorts. Cohort 2 had further quantification of abdominal fat depots by MRI (3.0 T Philips Achieva) to evaluate visceral, subcutaneous, liver, and pancreas fat, as previously described (24). DXA and MRI data are available on n = 79 and n = 61, respectively.
Adipose tissue biopsy
A needle biopsy of periumbilical subcutaneous fat was performed in cohort 1, as previously described (26), and ∼150 mg of tissue obtained, snap-frozen in liquid nitrogen, and stored at –80°C until analyzed.
Biochemical measurements in blood
Whole-blood glucose was measured using the YSI 2300 STAT analyzer. Serum insulin was measured by radioimmunoassay (Millipore). Serum lipid profile was analyzed by an automated analyzer (Advia 2400 Chemistry System; Siemens Medical Solutions Diagnostics), with LDL cholesterol calculated using the Friedewald equation. NEFAs were measured by an enzymatic colorimetric assay (Wako), and high-sensitivity C-reactive protein (CRP), fibroblast growth factors 19 and 21, total adiponectin, fatty acid binding protein 4, lipocalin 2, and retinol binding protein (RBP) 4 were measured by ELISA (Antibody and Immunoassay Service, University of Hong Kong, available in cohort 2, n = 64), as previously described (24). Fasting plasma glucose, serum insulin, and serum lipid profile data are available on n = 76, n = 80, and n = 79, respectively.
Dietary intake analysis
Dietary intake was evaluated using diet diaries (2 d) analyzed using the Australian-based food composition software FoodWorks 7 (Xyris), available in cohort 2 (n = 64).
Carotenoid and retinol measurements
All tissues were stored at –80°C and analyzed together. Serum (0.5 mL) and adipose tissue (∼150 mg) samples were extracted with 2 mL ethanol containing 10 µM butylated hydroxytoluene. After the addition of 2 mL hexane and 1 mL double distilled water (DDW), the samples were mixed and centrifuged for 5 min at 1000 × gat 4°C. The hexane layer of serum samples was divided into 2 aliquots, 1 for retinol and 1 for carotenoid detection. The hexane layers of the adipose tissue samples were saponified with 12% KOH in absolute ETOH for 30 min at 50°C. After washing twice with 2 mL saline, followed by centrifugation, the hexane layer was dried in N2. Dried samples were suspended in 100 µL tert-butyl methyl ether for carotenoid and 100 µL methanol for retinol detection. Retinol concentrations were determined by reverse-phase HPLC on a Vydac C18 column (201TP-54, 250 × 5 mm, 5-μm particle size; Vydac), with methanol/butanol/water + 10 mM ammonium acetate as the mobile phase at a flow rate of 0.8 mL/min. Retinyl acetate was used as an internal standard for retinol detection. Serum carotenoids were determined by reverse-phase HPLC on a YMC C30 column (CT995031546QT, 150 × 4.6, 3-μm particle size; YMC, Inc.) with a gradient, as described (27). Adipose tissue carotenoids were determined by reverse-phase HPLC on a YMC C30 column with methanol/DDW/methyl-tert-buthyl-ether, according to Colmán-Martínez et al. (28). Carotenoids were detected by monitoring absorbance and by comparison with the retention times of authentic standards (95%–98% purity; CaroteNature, Switzerland). Absorbance was detected at a wavelength of 200 to 700 nm to identify carotenoids with absorption in the UV range and the visible range of the spectrum. HPLC analyses are available on serum collected in both cohorts (n = 80) and adipose tissue biopsy specimens collected in cohort 1 (n = 16). We identified and quantified several stereoisomers of carotenoids in serum and adipose tissue and report the results of total concentrations of each carotenoid.
Statistical analysis
For the sake of the post hoc analyses of serum and adipose tissue carotenoids, the 2 cohorts comprising this study were combined for continuous analysis. Although the BMI values of the 2 cohorts had different ranges, there was overlap. All the data for those subjects with BMI in the overlapping range (i.e., high BMI cohort 2 subjects and low BMI cohort 1 subjects) were similarly distributed.
The data for each variable were tested for normality via the Anderson-Darling, Kolmogorov-Smirnov, and Lilliefors tests. If any of the tests showed nonnormality, then the logged values of the variable were used. The variables fell into several broad classes, and these were uniformly treated as all log-normal or normally distributed, based on the results for the majority of the class components. The variables that were treated as log-normal were body fat, glucose regulation, circulating metabolites, diet, and all carotenoids (both serum and adipose tissue). All statistical testing, outlined below, was performed on the original values for the normally distributed variables and on the logged values for the log-normal variables. The data for participants in cross-sectional analyses were divided into 2 groups: BMI  30 kg/m2 and BMI > 30 kg/m2. The clinical data (Table 1) were tested by t test for normally distributed data or the Mann-Whitney U test for nonnormally distributed data. The serum carotenoids data in the cross-sectional analysis for each variable and each group were analyzed to check for homoscedasticity using a Bartlett test. For equal variances, a 1-way ANOVA was determined; otherwise, a Welsh's ANOVA was calculated to determine significant differences between the groups (equivalent to a 2-tailed t test, with appropriate adjustments for homoscedasticity). In all cases, the significance cutoff was 0.05. For the correlation analyses between variables, the Pearson correlation coefficients were calculated between the different quantities.
TABLE 1.
Clinical and metabolic characteristics of the nonobese and obese subcohorts1
| Characteristic | BMI ≤30 kg/m2 | BMI >30 kg/m2 | P value |
|---|---|---|---|
| n (male/female) | 14 (2/12) | 66 (29/37) | |
| Age, y | 55.4 ± 2.4 | 50.9 ± 1.4 | 0.14 |
| Systolic blood pressure, mm Hg | 127 (116, 138) | 124 (116, 134) | 0.504 |
| Diastolic blood pressure, mm Hg | 75 ± 3 | 83 ± 1 | 0.013 |
| Total body fat, % | 37 ± 3 | 46 ± 1 | <0.001 |
| Central body fat, kg | 1.7 ± 0.2 | 3.4 ± 0.1 | <0.001 |
| Fasting blood glucose, mmol/L | 4.7 ± 0.1 | 4.8 ± 0.1 | 0.703 |
| Glucose: 1-h OGTT, mmol/L | 6.9 ± 0.3 | 7.8 ± 0.3 | 0.037 |
| Glucose: 2-h OGTT, mmol/L | 5.6 ± 0.2 | 6.3 ± 0.2 | 0.027 |
| Fasting serum insulin, mU/L | 7.8 (5.8, 10.7) | 15.3 (11.3, 23.3) | <0.001 |
| HOMA-IR | 1.6 (0.9, 2.3) | 4.1 (2.4, 5.0) | <0.001 |
| Total cholesterol, mmol/L | 4.7 ± 0.3 | 4.8 ± 0.1 | 0.753 |
| Triglycerides, mmol/L | 1.1 ± 0.2 | 1.0 ± 0.1 | 0.970 |
| HDL cholesterol, mmol/L | 1.6 ± 0.1 | 1.3 ± 0.0 | 0.033 |
| LDL cholesterol, mmol/L | 2.7 ± 0.3 | 3.0 ± 0.1 | 0.184 |
1Data are mean ± SEM or median (IQR) for variables not normally distributed. OGTT, oral-glucose-tolerance test.
Statistical analyses were implemented in MATLAB (R2018b; Mathworks, Inc.).
Results
Serum and adipose tissue carotenoids distribution and relations
All carotenoids detected in serum were also detected in adipose tissue. We measured concentrations of 5 serum carotenoids (α-carotene, β-carotene, lutein, lycopene, and ζ-carotene) and retinol. We identified 1 isomer of β- and α-carotene, 2 isomers of lutein and lycopene, and 3 isomers of ζ-carotene in serum (Supplemental Figure 1A). According to absorption spectra, additional isomers of these carotenoids were also present, but the identification is not certain or below the limit of detection. Seven carotenoids were measured in adipose tissue. β-Carotene, lutein, and phytoene had 1 isomer each; α-carotene and lycopene had 2 isomers each; and phytofluene and ζ-carotene each had 4 isomers detected (Supplemental Figure 1B).
The distribution of adipose tissue and serum carotenoids followed a different pattern (Figure 2A). In adipose tissue, phytoene and phytofluene made up 25% of adipose tissue carotenoids but were under the limit of detection in serum. The proportion of ζ-carotene in adipose tissue was ∼3-fold that in serum, while lutein and lycopene, comprising 20% and 21% of serum carotenoids, respectively, made up 2% and 12% in adipose tissue, respectively (Figure 2A).
FIGURE 2.

Distribution of carotenoids in serum and adipose tissue (A) and relations between serum and adipose tissue carotenoids (B); serum carotenoids, metabolic markers, and dietary intake (C); and between adipose tissue carotenoids and metabolic markers (D). In panels B to D, if  , then the r value of the correlation is shown using a solid color. If
  , then the r value of the correlation is shown as a hatched box in the appropriate color. The correlation coefficient is indicated using the color scale. For panels B and D, data are available for individuals who had both adipose tissue and serum collected (n = 16).
Serum and adipose tissue carotenoids mostly correlated positively with their own concentration in the other tissue or with each other, except for β-carotene and retinol, which correlated neither with their own concentrations nor with other carotenoids in the other tissue (Figure 2B).
Serum carotenoids and adiposity
Participants were stratified based on BMI as nonobese (≤30 kg/m2) or obese (>30 kg/m2). Age, systolic blood pressure, fasting glucose, total cholesterol, LDL cholesterol, and triglycerides were not significantly different between the groups (Table 1). Diastolic blood pressure, total body fat, central fat, glucose concentration 1 and 2 hours after the 75-g glucose load, fasting serum insulin, and HOMA-IR were all elevated in individuals with obesity, and HDL cholesterol was higher in the nonobese group (Table 1).
All measured serum carotenoids were significantly lower in samples collected from individuals with obesity compared with individuals without obesity (Figure 3A–G). Serum retinol concentrations were not significantly different between the groups (Figure 3H), and retinol-to-β-carotene ratio was higher in the obese group (Figure 3I).
FIGURE 3.

(A–I) Cross-sectional analysis of serum carotenoid concentrations in obese compared with nonobese individuals. All the data points are shown. The boxes indicate the retransformed (nonlogged) values of  ,
,  and
and  . The whiskers indicate the retransformed range of less than
  and greater than
  . P values are indicated on the panels. BMI ≤30 kg/m2, n = 14; BMI >30 kg/m2, n = 63–66.
Serum and adipose tissue carotenoids and anthropometric measures
All serum-measured carotenoids, α-carotene, β-carotene, and ζ-carotene, lutein, and lycopene, correlated inversely with some or all of the anthropometric and body composition measurements (e.g., weight, BMI, waist circumference, total body fat, body fat-free mass, and central body fat; Figure 2C). Neither the carotenoids nor retinol measured in serum correlated with fat in the liver, pancreas, or the size of the subcutaneous and visceral abdominal depots measured by MRI (P ≥ 0.07). Serum retinol did not correlate with any of the anthropometric measurements. Similar to serum carotenoids, most adipose tissue carotenoids associated inversely with anthropometric measures, including weight, BMI, waist circumference, and DXA-derived total and central body fat. Adipose tissue β-carotene was the only carotenoid that did not show any correlation with the anthropometric measurements (Figure 2D).
Serum and adipose tissue carotenoids, cardiovascular risk markers, and cytokines
Serum α-, β-, and ζ-carotene and retinol correlated inversely with diastolic blood pressure, but none of the carotenoids and retinol correlated with systolic blood pressure (Figure 2C). Similarly, adipose tissue α-carotene, ζ-carotene, phytoene, phytofluene, and total carotenoids correlated inversely with diastolic blood pressure (Figure 2D).
Serum β-carotene and the sum of α + β-carotene correlated inversely with serum triglycerides and triglyceride–to–HDL cholesterol ratio, while total serum carotenoids and serum triglycerides tended to inversely associate (r = –0.22, P = 0.051; Figure 2C). Retinol–to–β-carotene ratio correlated positively with serum triglycerides and triglycerides–to–HDL cholesterol ratio. Serum retinol and triglycerides tended to be positively associated (r = 0.22, P = 0.051; Figure 2C). Adipose tissue ζ-carotene correlated inversely with serum triglycerides and phytofluene, and total carotenoids tended to be inversely associated with serum triglycerides (r = –0.50, P = 0.058; r = –0.49, P = 0.064, respectively; Figure 2D).
Serum lycopene correlated inversely with CRP, while serum ζ-carotene tended to associate inversely with CRP (r = –0.024, P = 0.058; Figure 2C). Serum retinol to β-carotene correlated inversely with adiponectin. Serum β-carotene tended to associate positively with adiponectin (r = 0.23, P = 0.067; Figure 2C), while the ratio of dietary retinol to β-carotene correlated inversely with adiponectin (r = –0.28, P = 0.028; data not shown). RBP4, the carrier of retinol in the circulation, correlated positively with serum retinol (Figure 2C).
Serum carotenoids and glucose regulation
Total carotenoids, β-carotene, and α-carotene showed inverse associations with fasting insulin and HOMA-IR. However, HbA1c, a 3-month glycemic control marker, did not significantly correlate with most carotenoids, except for ζ-carotene, which tended to inversely associate with HbA1c (r = –0.23, P = 0.069) (Figure 2C). β-Carotene, α-carotene, and total carotenoids correlated inversely with liver insulin resistance (basal EGP, Figure 2C); however, none of the carotenoids correlated with muscle insulin resistance (P ≥ 0.16). Adipose tissue insulin resistance, measured by the product of fasting serum NEFA and insulin, correlated inversely with the total concentration of the carotenoids and tended to correlate inversely with β-carotene and with the sum of α- and β-carotene (r = –0.24, P = 0.055 and r = –0.24, P = 0.052, respectively) (Figure 2C). Similarly, NEFA suppression, an inverse measure of adipose tissue insulin resistance, tended to positively associate with serum β-carotene and with the sum of α- and β-carotene (r = 0.24, P = 0.056 and r = 0.25, P = 0.050, respectively) (Figure 2C). The ratio of retinol to β-carotene in serum correlated positively with fasting insulin, HOMA-IR, and basal EGP, while NEFA suppression tended to inversely associate with retinol to β-carotene (r = –0.24; P = 0.057) (Figure 2C). Similarly, the ratio of dietary retinol to β-carotene correlated inversely with NEFA suppression (r = –0.40, P = 0.0011; data not shown).
Serum carotenoids and dietary macro- and micronutrients
Daily energy intake and diet composition are provided in Supplemental Table 1. Serum α-carotene correlated inversely with carbohydrate intake (proportion of total daily energy), and all serum carotenoids correlated positively with dietary PUFA intake (proportion of total fat intake). Most carotenoids correlated inversely with SFA intake (proportion of total fat intake). α-Carotene, ζ-carotene, lutein, and the total carotenoids correlated positively with the dietary omega-3 PUFA intake (Figure 2C). Dietary retinol to β-carotene intake correlated positively with the ratio of retinol to β-carotene in serum and inversely with β-carotene, α + β-carotene, and total carotenoids. However, dietary intake of retinol, retinol equivalents, and β-carotene did not correlate with any of the serum retinol and carotenoids measured.
Discussion
We performed a comprehensive analysis of serum and adipose tissue carotenoids and applied gold-standard measures of abdominal fat distribution and tissue-specific insulin resistance in nondiabetic subjects with a wide range of BMI and insulin resistance. We detected several carotenoids in serum and adipose tissue, including α- and β-carotene, lutein, and lycopene. We report, for the first time, to our knowledge, the associations between adipose tissue ζ-carotene, phytoene and phytofluene, and adiposity and insulin resistance in humans. We show that these carotenoids and their stereoisomers are major components of carotenoids accumulated in adipose tissue. We find that adipose tissue and serum carotenoids correlate positively but follow different distributions in these tissues. We show that multiple serum and adipose tissue carotenoids are associated with favorable metabolic traits, including lower adiposity and insulin sensitivity in liver and adipose tissue in humans.
All serum carotenoids detected in the present study were significantly lower in individuals with obesity, and while retinol concentration was not different between the groups, the ratio of serum retinol to β-carotene was higher in obesity. Previous studies reported inverse associations between serum carotenoids, particularly α- and β-carotene, and BMI or waist circumference (6–8). Furthermore, fat mass was inversely correlated with serum α- and β-carotene in children (6), while in postmenopausal women, serum α-carotene correlated inversely with body fat mass, while β-carotene, lutein, and lycopene did not (29). No associations were found between serum lutein, zeaxanthin, and body fat (30). Chung et al. (22) reported inverse associations between some carotenoids in adipose tissue and body fat in 25 healthy subjects. Here, we report that most carotenoids detected in serum and in adipose tissue correlated inversely with total body fat content and central fat, as measured by DXA. However, unlike findings in children with obesity (31), none of the serum carotenoids measured here correlated significantly with the abdominal subcutaneous or visceral fat depots specifically (measured by MRI).
We used a gold-standard method to evaluate muscle and liver insulin resistance. We found that total carotenoids and the pro–vitamin A precursors α- and β-carotene correlated inversely with liver and adipose tissue insulin resistance. However, none of the carotenoids correlated with muscle insulin resistance. Liver and adipose tissue are main sites of carotenoid accumulation (2, 32), and our findings may suggest that carotenoids play an insulin-sensitizing role locally in these tissues, but may also serve as markers of increased insulin sensitivity. In rodent models of obesity and atherosclerosis, we have reported that supplementing the diet with β-carotene decreased lipid deposition in the liver and blunted glucose excursions after an intraperitoneal glucose load. This was associated with downregulation of adipose tissue and liver mRNA expression of proinflammatory genes (20, 33). The possible protective effect of carotenoids on insulin resistance could stem from the capacity of α- and β-carotene to serve as retinoic acid precursors. Retinoic acid, a ligand for the nuclear receptors retinoic acid receptor and retinoid X receptor that form a heterodimer with peroxisome proliferator–activated receptor γ and other nuclear receptors, may play a role in whole-body glucose regulation, either by enhancing insulin sensitivity or by potentiating insulin release (34–36). Another mechanism proposed for the protective role of carotenoids is through their antioxidative capacity (37, 38). Indeed, oxidative stress and low-grade inflammation are hallmarks of obesity (39), and carotenoids have been suggested to possess antioxidative and anti-inflammatory properties (40). The associations reported here between serum carotenoids, CRP, and adiponectin may support this notion and are consistent with previous findings reporting inverse associations between plasma concentrations of carotenoids and IL-6, CRP, TNF-α, and RBP4 (41, 42).
The exact mechanisms explaining the lower concentrations of carotenoids in obesity are unclear. Lower plasma carotenoids may be a marker of a low-quality diet, depleted in carotenoids (43). Indeed, we found that plasma carotenoids correlated positively with PUFA intake and inversely with SFA intake, and the ratio of dietary retinol/β-carotene correlated significantly with serum carotenoids and retinol concentrations. Since carotenoids are lipid soluble, it has been suggested that adipose tissue may act as a sink for circulating carotenoids (14, 44). However, our findings of lower carotenoids in adipose tissue in subjects with obesity would contradict this notion. Indeed, Osth et al. (23) have demonstrated that the concentration of β-carotene in adipocytes isolated from the subcutaneous adipose tissue of obese subjects was 50% lower than the β-carotene concentrations measured in normal-weight or nonobese subjects. Moreover, we propose that since obesity predisposes to higher concentrations of oxidative stress and inflammation, carotenoids, serving as local antioxidants and a source for retinoic acid, may consequently be depleted in obesity, which may explain the lower concentrations of carotenoids in the circulation and the adipose tissue found here.
Previous studies have reported the presence of carotenoid isomers in plasma. The biological role of the different carotenoid isomers is unclear. Our work has demonstrated that 9-cis, but not all-trans β-carotene, protects against atherogenesis in mouse models of atherosclerosis (33). Moreover, it is well established that 9-cis retinoic acid binds specifically to retinoid X receptor, while all-trans retinoic acid does not (34). Therefore, it is plausible that different isomers of carotenoids have different roles in the human body.
While serum carotenoids correlated inversely with many parameters of body fat composition, glucose regulation, and cardiometabolic risk factors, retinol did not correlate with any of these parameters, apart from diastolic blood pressure (negative) and with its plasma carrier RBP4 (positive). The lack of associations between serum retinol and metabolic parameters is consistent with some other reports (10, 18). Serum retinol concentrations are kept at a narrow range due to homeostatic regulation, and its serum concentration does not always respond to oral supplementation (45, 46). Similarly, in animal models, lower liver retinol concentration was not mirrored in the serum (2). While serum retinol per se did not correlate with glucose regulation in the present study, the ratio of retinol to β-carotene in serum correlated with adverse glucose regulation, particularly liver insulin resistance. Together with the relation between dietary retinol to β-carotene and adipose tissue insulin resistance observed here, high dietary intake of carotenoids (found in fruit and vegetables), coupled with low intake of dietary sources of retinol (found in high-fat meat and dairy products), may be advisable.
Finally, we aimed to evaluate the correlations between adipose tissue and serum carotenoids and to investigate their distribution in these tissues. It was suggested that circulating carotenoids reflect short-term carotenoid status, while adipose tissue carotenoids reflect long-term carotenoid status (47). Previous studies reported that abdominal adipose tissue carotenoids were positively related with serum carotenoids in men and women with normal weight (22, 43). We found that subcutaneous adipose tissue carotenoids, except β-carotene, correlated significantly with serum carotenoids, but the distribution of carotenoids in serum and adipose tissue followed different patterns. Using a high-throughput HPLC method, we report for the first time, to our knowledge, that ζ-carotene, phytoene, and phytofluene are carotenoids stored in considerable amounts in adipose tissue in human. ζ-Carotene, phytoene, and phytofluene are carotenoids found in vegetables and fruit, including tomato and, in lesser amounts, papaya, pink grapefruit, and apricot (48). Tomato and tomato product consumption was associated with lower cardiovascular and cancer risk in large cohort epidemiological studies, and this protective effect was attributed to lycopene, a main carotenoid in tomato (49, 50); however, the role of other carotenoids found in tomato was not investigated.
The strengths of our study are the detailed glucose regulation and body fat distribution testing, with gold-standard methods and adipose tissue biopsies. The use of the 2-step hyperinsulinemic-euglycemic clamp with glucose tracers enabled the investigation of key tissues participating in whole-body glucose regulation, muscle, liver, and adipose tissue. Furthermore, our high-throughput HPLC method enabled the detection of numerous carotenoids not previously reported in serum and adipose tissue and their isomers, providing a comprehensive overview of carotenoid status in humans.
Our study has several limitations. First, some of the data were available on a relatively small cohort, and in the cross-sectional analysis, the subcohorts were of unequal size. Furthermore, we relied on diet diaries known to be confounded by inaccuracies, particularly in cohorts with overweight and obesity (51). Finally, we identified several stereoisomers of carotenoids based on absorption spectra and proximity to the major isomer, rather than relying on standards, due to lack of commercial standards, and the concentration of adipose tissue lycopene could have been underestimated.
In conclusion, we report favorable relations between serum and adipose tissue carotenoids and metabolic health in human. The tissue-specific roles of the various carotenoids and their stereoisomers should be further investigated in preclinical models.
Supplementary Material
Acknowledgments
We thank Renee Richens, Lynne Schofield, Jenifer Evans, and Vanessa Travers, the nurses of the Clinical Research Facility, for their assistance in recruiting the study participants and Dr. Daniel Chen for performing the hyperinsulinemic-euglycemic clamps, all from the Garvan Institute of Medical Research (Sydney, Australia). The authors’ contributions were as follows—AH, AS, and DS-B: conceived and designed the research; AH: analyzed the concentrations of carotenoids in serum and adipose tissue; ACFC: performed the statistical analyses; AJ: computed the data derived from the hyperinsulinemic-euglycemic clamp and contributed to the discussion; AX: analyzed the plasma adipokines and contributed to the discussion; JRG and DH: contributed to the discussion; AH: wrote the paper; AS and DS-B: had primary responsibility for final content and all authors read and approved the final manuscript.
Notes
The clinical studies were funded by grants from the Diabetes Australia Research Program and the Garvan Research Foundation.
Author disclosures: AH, ACFC, AJ, AX, JRG, DH, AS, and DS-B, no conflicts of interest.
Supplemental Figure 1 and Supplemental Table 1 are available from the “Supplementary data” link in the online posting of the article and from the same link in the online table of contents at https://academic.oup.com/jn.
AS and DS-B contributed equally to this work.
Abbreviations used: CRP, C-reactive protein; DDW, double distilled water; DXA, dual-energy X-ray absorptiometry; EGP, endogenous glucose production; HbA1c, glycated hemoglobin; NEFA, nonesterified fatty acid; RBP, retinol binding protein.
References
- 1. Rao AV, Rao LG. Carotenoids and human health. Pharmacol Res. 2007;55:207–16. [DOI] [PubMed] [Google Scholar]
- 2. Relevy NZ, Harats D, Harari A, Ben-Amotz A, Bitzur R, Ruhl R, Shaish A. Vitamin A–deficient diet accelerated atherogenesis in apolipoprotein E(–/–) mice and dietary β-carotene prevents this consequence. Biomed Res Int. 2015;2015:758723. [DOI] [PMC free article] [PubMed] [Google Scholar]
- 3. Rodriguez-Concepcion M, Avalos J, Bonet ML, Boronat A, Gomez-Gomez L, Hornero-Mendez D, Limon MC, Melendez-Martinez AJ, Olmedilla-Alonso B, Palou A et al.. A global perspective on carotenoids: metabolism, biotechnology, and benefits for nutrition and health. Prog Lipid Res. 2018;70:62–93. [DOI] [PubMed] [Google Scholar]
- 4. Eggersdorfer M, Wyss A.. Carotenoids in human nutrition and health. Arch Biochem Biophys. 2018;652:18–26. [DOI] [PubMed] [Google Scholar]
- 5. Roust LR, DiBaise JK. Nutrient deficiencies prior to bariatric surgery. Curr Opin Clin Nutr Metab Care. 2017;20:138–44. [DOI] [PubMed] [Google Scholar]
- 6. Gunanti IR, Marks GC, Al-Mamun A, Long KZ. Low serum concentrations of carotenoids and vitamin E are associated with high adiposity in Mexican-American children. J Nutr. 2014;144:489–95. [DOI] [PubMed] [Google Scholar]
- 7. Strauss RS. Comparison of serum concentrations of alpha-tocopherol and beta-carotene in a cross-sectional sample of obese and nonobese children (NHANES III). National Health and Nutrition Examination Survey. J Pediatr. 1999;134:160–5. [DOI] [PubMed] [Google Scholar]
- 8. Wang L, Gaziano JM, Norkus EP, Buring JE, Sesso HD. Associations of plasma carotenoids with risk factors and biomarkers related to cardiovascular disease in middle-aged and older women. Am J Clin Nutr. 2008;88:747–54. [DOI] [PMC free article] [PubMed] [Google Scholar]
- 9. Kabat GC, Heo M, Ochs-Balcom HM, LeBoff MS, Mossavar-Rahmani Y, Adams-Campbell LL, Nassir R, Ard J, Zaslavsky O, Rohan TE. Longitudinal association of measures of adiposity with serum antioxidant concentrations in postmenopausal women. Eur J Clin Nutr. 2016;70:47–53. [DOI] [PubMed] [Google Scholar]
- 10. Reunanen A, Knekt P, Aaran RK, Aromaa A. Serum antioxidants and risk of non-insulin dependent diabetes mellitus. Eur J Clin Nutr. 1998;52:89–93. [DOI] [PubMed] [Google Scholar]
- 11. Hozawa A, Jacobs DR Jr, Steffes MW, Gross MD, Steffen LM, Lee DH. Associations of serum carotenoid concentrations with the development of diabetes and with insulin concentration: interaction with smoking: the Coronary Artery Risk Development in Young Adults (CARDIA) Study. Am J Epidemiol. 2006;163:929–37. [DOI] [PubMed] [Google Scholar]
- 12. Beydoun MA, Shroff MR, Chen X, Beydoun HA, Wang Y, Zonderman AB. Serum antioxidant status is associated with metabolic syndrome among U.S. adults in recent national surveys. J Nutr. 2011;141:903–13. [DOI] [PMC free article] [PubMed] [Google Scholar]
- 13. Suzuki K, Ito Y, Nakamura S, Ochiai J, Aoki K. Relationship between serum carotenoids and hyperglycemia: a population-based cross-sectional study. J Epidemiol. 2002;12:357–66. [DOI] [PMC free article] [PubMed] [Google Scholar]
- 14. Bonet ML, Canas JA, Ribot J, Palou A. Carotenoids and their conversion products in the control of adipocyte function, adiposity and obesity. Arch Biochem Biophys. 2015;572:112–25. [DOI] [PubMed] [Google Scholar]
- 15. Godala M, Materek-Kusmierkiewicz I, Moczulski D, Rutkowski M, Szatko F, Gaszynska E, Tokarski S, Kowalski J. The risk of plasma vitamin A, C, E and D deficiency in patients with metabolic syndrome: a case-control study. Adv Clin Exp Med. 2017;26:581–6. [DOI] [PubMed] [Google Scholar]
- 16. Via M. The malnutrition of obesity: micronutrient deficiencies that promote diabetes. ISRN Endocrinol. 2012;2012:103472. [DOI] [PMC free article] [PubMed] [Google Scholar]
- 17. Tavridou A, Unwin NC, Laker MF, White M, Alberti KG. Serum concentrations of vitamins A and E in impaired glucose tolerance. Clin Chim Acta. 1997;266:129–40. [DOI] [PubMed] [Google Scholar]
- 18. Abahusain MA, Wright J, Dickerson JW, de Vol EB. Retinol, alpha-tocopherol and carotenoids in diabetes. Eur J Clin Nutr. 1999;53:630–5. [DOI] [PubMed] [Google Scholar]
- 19. Frey SK, Vogel S. Vitamin A metabolism and adipose tissue biology. Nutrients. 2011;3:27–39. [DOI] [PMC free article] [PubMed] [Google Scholar]
- 20. Harari A, Harats D, Marko D, Cohen H, Barshack I, Gonen A, Ben-Shushan D, Kamari Y, Ben-Amotz A, Shaish A. Supplementation with 9-cis β-carotene-rich alga Dunaliella improves hyperglycemia and adipose tissue inflammation in diabetic mice. J Appl Phycol. 2013;25:687–93. [Google Scholar]
- 21. Virtanen SM, van't Veer P, Kok F, Kardinaal AF, Aro A. Predictors of adipose tissue carotenoid and retinol levels in nine countries. The EURAMIC Study. Am J Epidemiol. 1996;144:968–79. [DOI] [PubMed] [Google Scholar]
- 22. Chung HY, Ferreira AL, Epstein S, Paiva SA, Castaneda-Sceppa C, Johnson EJ. Site-specific concentrations of carotenoids in adipose tissue: relations with dietary and serum carotenoid concentrations in healthy adults. Am J Clin Nutr. 2009;90:533–9. [DOI] [PubMed] [Google Scholar]
- 23. Osth M, Ost A, Kjolhede P, Stralfors P. The concentration of beta-carotene in human adipocytes, but not the whole-body adipocyte stores, is reduced in obesity. PLoS One. 2014;9:e85610. [DOI] [PMC free article] [PubMed] [Google Scholar]
- 24. Chen DL, Liess C, Poljak A, Xu A, Zhang J, Thoma C, Trenell M, Milner B, Jenkins AB, Chisholm DJ et al.. Phenotypic characterization of insulin-resistant and insulin-sensitive obesity. J Clin Endocrinol Metab. 2015;100:4082–91. [DOI] [PubMed] [Google Scholar]
- 25. Ter Horst KW, van Galen KA, Gilijamse PW, Hartstra AV, de Groot PF, van der Valk FM, Ackermans MT, Nieuwdorp M, Romijn JA, Serlie MJ. Methods for quantifying adipose tissue insulin resistance in overweight/obese humans. Int J Obes (Lond). 2017;41:1288–94. [DOI] [PubMed] [Google Scholar]
- 26. Azuma K, Heilbronn LK, Albu JB, Smith SR, Ravussin E, Kelley DE; Look AHEAD Adipose Research Group . Adipose tissue distribution in relation to insulin resistance in type 2 diabetes mellitus. Am J Physiol Endocrinol Metab. 2007;293:E435–42. [DOI] [PMC free article] [PubMed] [Google Scholar]
- 27. Yeum KJ, Booth SL, Sadowski JA, Liu C, Tang G, Krinsky NI, Russell RM. Human plasma carotenoid response to the ingestion of controlled diets high in fruits and vegetables. Am J Clin Nutr. 1996;64:594–602. [DOI] [PubMed] [Google Scholar]
- 28. Colmán-Martinez M, Martinez-Huelamo M, Miralles E, Estruch R, Lamuela-Raventos RM. A new method to simultaneously quantify the antioxidants: carotenes, xanthophylls, and vitamin A in human plasma. Oxid Med Cell Longev. 2015;2015:9268531. [DOI] [PMC free article] [PubMed] [Google Scholar]
- 29. Nuss ET, Valentine AR, Zhang Z, Lai HJ, Tanumihardjo SA. Serum carotenoid interactions in premenopausal women reveal α-carotene is negatively impacted by body fat. Exp Biol Med (Maywood). 2017;242:1262–70. [DOI] [PMC free article] [PubMed] [Google Scholar]
- 30. Bovier ER, Lewis RD, Hammond BR Jr.. The relationship between lutein and zeaxanthin status and body fat. Nutrients. 2013;5:750–7. [DOI] [PMC free article] [PubMed] [Google Scholar]
- 31. Canas JA, Lochrie A, McGowan AG, Hossain J, Schettino C, Balagopal PB. Effects of mixed carotenoids on adipokines and abdominal adiposity in children: a pilot study. J Clin Endocrinol Metab. 2017;102:1983–90. [DOI] [PMC free article] [PubMed] [Google Scholar]
- 32. Kaplan LA, Lau JM, Stein EA. Carotenoid composition, concentrations, and relationships in various human organs. Clin Physiol Biochem. 1990;8:1–10. [PubMed] [Google Scholar]
- 33. Harari A, Harats D, Marko D, Cohen H, Barshack I, Kamari Y, Gonen A, Gerber Y, Ben-Amotz A, Shaish A. A 9-cis beta-carotene-enriched diet inhibits atherogenesis and fatty liver formation in LDL receptor knockout mice. J Nutr. 2008;138:1923–30. [DOI] [PubMed] [Google Scholar]
- 34. Brun PJ, Grijalva A, Rausch R, Watson E, Yuen JJ, Das BC, Shudo K, Kagechika H, Leibel RL, Blaner WS. Retinoic acid receptor signaling is required to maintain glucose-stimulated insulin secretion and β-cell mass. FASEB J. 2015;29:671–83. [DOI] [PMC free article] [PubMed] [Google Scholar]
- 35. Wolf G. Retinoic acid activation of peroxisome proliferation-activated receptor delta represses obesity and insulin resistance. Nutr Rev. 2010;68:67–70. [DOI] [PubMed] [Google Scholar]
- 36. Berry DC, Noy N. All-trans-retinoic acid represses obesity and insulin resistance by activating both peroxisome proliferation-activated receptor beta/delta and retinoic acid receptor. Mol Cell Biol. 2009;29:3286–96. [DOI] [PMC free article] [PubMed] [Google Scholar]
- 37. Ali MM, Agha FG. Amelioration of streptozotocin-induced diabetes mellitus, oxidative stress and dyslipidemia in rats by tomato extract lycopene. Scand J Clin Lab Invest. 2009;69:371–9. [DOI] [PubMed] [Google Scholar]
- 38. Franceschelli S, Pesce M, Ferrone A, De Lutiis MA, Patruno A, Grilli A, Felaco M, Speranza L. Astaxanthin treatment confers protection against oxidative stress in U937 cells stimulated with lipopolysaccharide reducing O2– production. PLoS One. 2014;9:e88359. [DOI] [PMC free article] [PubMed] [Google Scholar]
- 39. Santilli F, Guagnano MT, Vazzana N, La Barba S, Davi G. Oxidative stress drivers and modulators in obesity and cardiovascular disease: from biomarkers to therapeutic approach. Curr Med Chem. 2015;22:582–95. [DOI] [PubMed] [Google Scholar]
- 40. Roohbakhsh A, Karimi G, Iranshahi M. Carotenoids in the treatment of diabetes mellitus and its complications: a mechanistic review. Biomed Pharmacother. 2017;91:31–42. [DOI] [PubMed] [Google Scholar]
- 41. Jing L, Xiao M, Dong H, Lin J, Chen G, Ling W, Chen Y. Serum carotenoids are inversely associated with RBP4 and other inflammatory markers in middle-aged and elderly adults. Nutrients. 2018;10:E260. [DOI] [PMC free article] [PubMed] [Google Scholar]
- 42. Rodriguez-Rodriguez E, Lopez-Sobaler AM, Navia B, Andres P, Jimenez-Ortega AI, Ortega RM.β-Carotene concentration and its association with inflammatory biomarkers in Spanish schoolchildren. Ann Nutr Metab. 2017;71:80–7. [DOI] [PubMed] [Google Scholar]
- 43. El-Sohemy A, Baylin A, Kabagambe E, Ascherio A, Spiegelman D, Campos H. Individual carotenoid concentrations in adipose tissue and plasma as biomarkers of dietary intake. Am J Clin Nutr. 2002;76:172–9. [DOI] [PubMed] [Google Scholar]
- 44. Moran NE, Mohn ES, Hason N, Erdman JW Jr, Johnson EJ. Intrinsic and extrinsic factors impacting absorption, metabolism, and health effects of dietary carotenoids. Adv Nutr. 2018;9:465–92. [DOI] [PMC free article] [PubMed] [Google Scholar]
- 45. Tchum SK, Tanumihardjo SA, Newton S, de Benoist B, Owusu-Agyei S, Arthur FK, Tetteh A. Evaluation of vitamin A supplementation regimens in Ghanaian postpartum mothers with the use of the modified-relative-dose-response test. Am J Clin Nutr. 2006;84:1344–9. [DOI] [PubMed] [Google Scholar]
- 46. Mason JB, Ramirez MA, Fernandez CM, Pedro R, Lloren T, Saldanha L, Deitchler M, Eisele T. Effects on vitamin A deficiency in children of periodic high-dose supplements and of fortified oil promotion in a deficient area of the Philippines. Int J Vitam Nutr Res. 2011;81:295–305. [DOI] [PubMed] [Google Scholar]
- 47. Kohlmeier L, Kohlmeier M.. Adipose tissue as a medium for epidemiologic exposure assessment. Environ Health Perspect. 1995;103(Suppl 3):99–106. [DOI] [PMC free article] [PubMed] [Google Scholar]
- 48. Khachik F, Carvalho L, Bernstein PS, Muir GJ, Zhao DY, Katz NB. Chemistry, distribution, and metabolism of tomato carotenoids and their impact on human health. Exp Biol Med (Maywood). 2002;227:845–51. [DOI] [PubMed] [Google Scholar]
- 49. Cheng HM, Koutsidis G, Lodge JK, Ashor AW, Siervo M, Lara J. Lycopene and tomato and risk of cardiovascular diseases: a systematic review and meta-analysis of epidemiological evidence. Crit Rev Food Sci Nutr. 2019;59:141–58. [DOI] [PubMed] [Google Scholar]
- 50. Mein JR, Lian F, Wang XD. Biological activity of lycopene metabolites: implications for cancer prevention. Nutr Rev. 2008;66:667–83. [DOI] [PMC free article] [PubMed] [Google Scholar]
- 51. Archer E, Hand GA, Blair SN. Correction: validity of U.S. Nutritional Surveillance: National Health and Nutrition Examination Survey caloric energy intake data, 1971–2010. PLoS One. 2013;8:e76632. [DOI] [PMC free article] [PubMed] [Google Scholar]
Associated Data
This section collects any data citations, data availability statements, or supplementary materials included in this article.