Abstract
The present study aimed to explore the role of fibroblast growth factor 2 (FGF2) in the development and prognosis of gastric cancer (GC). The relationship between FGF2 mRNA expression levels and the clinical characteristics of GC was investigated using microarray data from four GC cohorts involving 726 patients obtained from the Gene Expression Omnibus. The results of the present study indicated that FGF2 expression levels were an independent factor affecting the prognosis of GC. The primary functions of FGF2 were related to cell adhesion and angiogenesis, and patients with high levels of FGF2 expression had poorer TNM staging and prognosis; these differences were statistically significant. In terms of immune infiltration, a higher extent of M2 macrophage intrusion was observed in patients with higher levels of FGF2. However, the degree of infiltration by dendritic and CD4+ T cells was lower, and this difference was statistically significant. Multivariate Cox proportional hazards model analysis revealed that age, TNM staging and FGF2 expression levels were independent prognostic factors for GC. In summary, FGF2 expression was demonstrated to be an independent prognostic factor in GC, and higher levels of FGF2 may promote the progression of this malignancy.
Keywords: fibroblast growth factor 2, gastric cancer, prognosis, clinical characteristics
Introduction
Gastric cancer (GC) is a common malignant tumor with the fourth-highest occurrence among different types of cancer, and it is the third leading cause of death worldwide (1,2). Even following diagnosis at an early stage, where endoscopic mucosal resection or endoscopic submucosal dissection are successfully performed, the recurrence rate and prognosis are unsatisfactory (3). Incomplete assessment or resection can lead to the local recurrence and worse prognosis. In addition, various factors, including angiogenesis and tumor cell adhesion, are associated with the development of GC (4,5). Therefore, it is important to identify novel diagnostic and prognostic markers for guiding or assessing the treatment of GC. In addition, transcriptome analysis using microarray and RNA sequencing has been previously shown to be an effective method to identify biomarkers (6,7).
As a member of the fibroblast growth factor (FGF) family, FGF2 has important roles in angiogenesis, the regulation of extracellular matrix, cell differentiation and inflammatory responses, thereby contributing to the development, progression and pathogenesis of tumors (8–10). FGF2 has been reported to mediate cell migration and invasion in breast cancer, pancreatic cancer, astrocytes and gliomas (11–14). however, whether FGF2 has a role in the occurrence and development of GC remains unclear. In the present study, microarray data from patients with GC from Gene Expression Omnibus (GEO) databases were analyzed in order to investigate the function of FGF2 in GC.
Materials and methods
Microarray data collection
To identify GC data sets with relevant clinical information, systematic searches of GEO datasets (https://www.ncbi.nlm.nih.gov/geo/) were conducted. The inclusion criteria for the datasets were as follows: i) Sample size >50; ii) the studies presented relevant clinical information; and iii) datasets were generated using Affymetrix Human Genome 133 plus 2.0 Gene Chips (Affymetrix; Thermo Fisher Scientific, Inc.). In total, four data sets, GSE66229 (Cristescu et al, 2015) (n=400) (15), GSE15459 (Ooi et al, 2009) (n=200) (16), GSE57303 (Qian et al, 2014) (n=70) (17) and GSE34942 (Lei et al, 2012) (n=56) (18), were selected for further analysis. The batch function of SVA package (3.32.1 version) (https://bioconductor.org/packages/release/bioc/html/sva.html) was used to consolidate the 4 data sets. Data normalization was performed by R software (3.6.0 version; http://cran.r-project.org/) and gene expression levels were computed as mean values of all annotated probe sets (19).
Analysis of correlation between FGF2 expression and clinical characteristics
The mRNA expression levels of FGF2 between tumor (n=626) and normal tissues (n=100) were compared. Both the median and the receiver operating characteristic (ROC) curve can be used as the grouping criteria. Due to the difference in the sample size between the groups, the median expression of FGF2 was selected to replace the ROC curve as the grouping standard. According to the median expression of FGF2, 612 patients, whose clinical information was available, were equally divided into two groups: An FGF2-high expression group (FGF2-H) and an FGF2-low expression group (FGF2-L). Differentially expressed genes [P<0.05, and |log fold change (FC)|≥1)] were identified between the two groups and analyzed using Gene Ontology (GO) and Kyoto Encyclopedia of Genes and Genomes (KEGG) using DAVID 6.8 (https://david.ncifcrf.gov/) (20). Clinical characteristics, including patient age, gender, tumor stage, Lauren classification (21), the extent of immune infiltration and overall survival (OS), were collected in order to identify correlations regarding FGF2 expression and clinical characteristics. The CIBERSORT (https://cibersort.stanford.edu/) method and the LM22 gene signature were used for immune infiltration analysis (22). All results were considered statistically significant at a threshold of P<0.05.
Construction of a clinical prognosis model
A Cox-prognosis model was constructed using R software (3.6.0 version). R packages including survival (version 2.44–1.1; http://github.com/therneau/survival), survminer (version 0.4.5; http://www.sthda.com/english/rpkgs/survminer/), survivalROC (contained in survcomp package; version 1.34.0; http://git.bioconductor.org/packages/survcomp) and survcomp (version 1.34.0; http://git.bioconductor.org/packages/survcomp) were used for the model and the calculation of C-index. In total, 612 patients with clinical information were randomly divided into two groups: A training group (n=306) and a validation group (n=306). The risk score for each patient was calculated based on the independent factors identified by the multivariate Cox model. The prognosis for each patient was evaluated according to risk scores. The sensitivity and specificity of the model were described using a time-dependent ROC curve (23).
Statistical analysis
Statistical analysis was performed using R software and SPSS version 23.0 (IBM Crop.). Graphical representations were generated using GraphPad Prism 7 (GraphPad Software, Inc.). χ2 and Wilcoxon rank-sum tests were used for categorical and continuous variables, respectively. Multivariate Cox proportional-hazards analysis was used for identifying independent prognostic factors.
Results
Differential gene expression
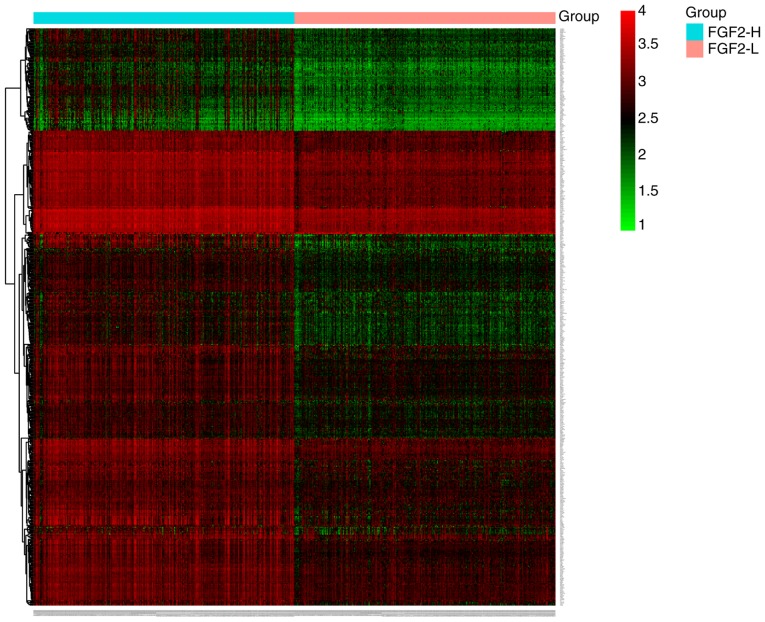
In total, four GEO datasets were extracted and normalized to analyze the expression patterns of FGF2 in GC. Compared with normal tissues, FGF2 mRNA expression levels were lower in GC (P<0.0001; Fig. 1). A total of 536 differentially expressed genes in the FGF2-H and FGF2-L cohorts were identified by R software and the results were analyzed using GO and KEGG (Fig. 2 and Table SI). GO analysis results revealed that the differentially expressed genes were predominantly involved in the regulation of ‘extracellular matrix organization’, ‘cell adhesion’ and ‘angiogenesis’ (Fig. 3A). KEGG analysis results revealed that the genes identified were predominantly involved in ‘focal adhesion’, ‘ECM-receptor interaction’ and the ‘cGMP-PKG signaling pathway’ (Fig. 3B). The biological functions and signaling pathways associated with these genes were closely related to the development of GC.
Figure 1.
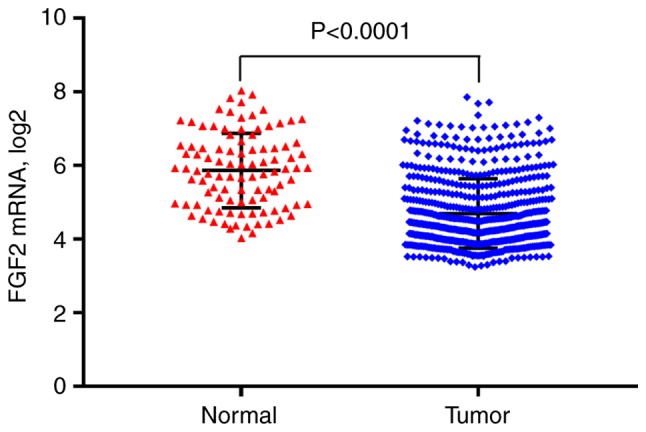
FGF2 mRNA expression levels in normal and gastric cancer tissues. FGF2, fibroblast growth factor 2.
Figure 2.
Heatmap of differentially expressed genes in the FGF-H and FGF-L groups. Expression level was converted by log2 method. FGF2, fibroblast growth factor 2; H, high; L, low.
Figure 3.
GO and KEGG terms enriched in the differentially expressed genes. (A) GO analysis of differentially expressed genes revealed that FGF2 was predominantly involved in ‘extracellular matrix organization’, ‘cell adhesion’ and ‘angiogenesis’. (B) KEGG analysis revealed that the differentially expressed genes were predominantly involved in ‘focal adhesion’, ‘ECM-receptor’ interaction and the ‘cGMP-PKG signaling pathway’. FGF2, fibroblast growth factor 2; GO, gene ontology; BP, biological process; KEGG, Kyoto Encyclopedia of Genes and Genomes.
Association of FGF2 expression with clinical characteristics
In total, 612 patients with clinical data were selected, and an association analysis of the FGF2 expression levels and clinical characteristics was performed. The patients were divided to the FGF2-H and FGF2-L groups, according to the median FGF2 expression. As listed in Table I, the patient age in the FGF2-L group was higher compared with that in the FGF2-H group. A statistical significance was found between stages II and IV (P<0.001; Table I), therefore, for further comparison, stages I and II were classified as early-stage and stages III and IV as advanced. The FGF2-H group had more patients with advanced-stage tumors compared with the FGF2-L group (P<0.001; Table I). Classifying the patient samples according to Lauren's criteria, a difference was observed in diffuse and intestinal types, but no difference was observed for the mixed types. In total, 366 patients were selected with detailed TNM staging in the four datasets for further analysis. There was a significant difference between the two FGF2-expressing groups in the T2 and T3 stages. Compared with FGF2-L, the number of patients with advanced-stage GC (T3 and T4) in the FGF2-H group was higher compared with the FGF2-L group (P<0.001; Table I). No significant difference was observed when comparing the N and M scores of the two FGF2-expressing groups (Table I).
Table I.
Clinical characteristics and association with FGF2 expression.
| FGF2-H group | FGF2-L group | P-value | |
|---|---|---|---|
| Age (n=612) | 0.0043 | ||
| ≥60 | 191 | 224 | |
| <60 | 115 | 82 | |
| Sex (n=612) | 0.1227 | ||
| Female | 111 | 93 | |
| Male | 195 | 213 | |
| TNM stage (n=612) | |||
| I | 25 | 50 | 0.0021 |
| II | 55 | 90 | 0.0009 |
| III | 125 | 102 | 0.4706 |
| IV | 101 | 64 | 0.0008 |
| I+II/III+IV | 80/226 | 140/166 | <0.0001 |
| Lauren (n=612) | |||
| Diffuse | 165 | 90 | <0.0001 |
| Intestinal | 114 | 189 | <0.0001 |
| Mixed | 27 | 27 | 1.0000 |
| T (n=366) | |||
| T1 | 0 | 0 | 1.0000 |
| T2 | 64 | 130 | <0.0001 |
| T3 | 103 | 39 | <0.0001 |
| T4 | 16 | 14 | 0.7031 |
| T1+2/T3+4 | 64/119 | 130/53 | <0.0001 |
| N (n=366) | |||
| N0 | 27 | 24 | 0.6507 |
| N1 | 70 | 86 | 0.0908 |
| N2 | 55 | 50 | 0.5634 |
| N3 | 31 | 23 | 0.2384 |
| N0+1/N2+3 | 97/86 | 110/73 | 0.1704 |
| M (n=366) | 0.1497 | ||
| M0 | 162 | 170 | |
| M1 | 21 | 13 |
FGF2, fibroblast growth factor 2; H, high; L, low.
Comparison of immune cell type fractions
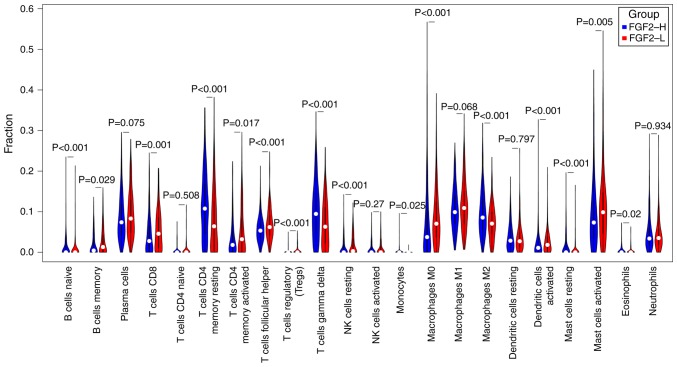
Patients with P>0.05 were removed following CIBERSORT calculations (n=584; FGF2-H=301, FGF2-L=283), and non-parametric testing was used for comparison of the immune cell fractions (Figs. 4 and 5). The results revealed significant differences among the abundance of various immune cells, including CD4+ T cells, T regulatory cells, γδ T cells, macrophages, dendritic cells and mast cells (P<0.05).
Figure 4.
Comparison of the immune cell fractions in each patient.
Figure 5.
A non-parametric test of immune cell fractions between the FGF2-H and FGF2-L groups. FGF2, fibroblast growth factor 2; H, high; L, low.
High FGF2 expression predicts poorer OS in patients with GC
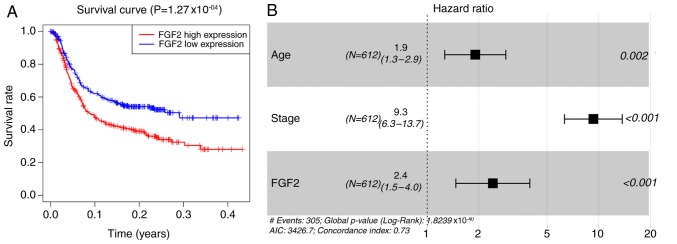
Since FGF2 has a role in cell adhesion and because significant differences were identified in the abundance of different immune cell types in the tumor tissues, the survival of patients with GC may be affected by FGF2 expression levels. As shown in Fig. 6A, there was a strong association between higher FGF2 expression and shorter OS in patients with GC. Using multivariate analysis, FGF2 levels, age and tumor staging, were demonstrated to be independent prognostic indicators (Fig. 6B).
Figure 6.
Survival analysis. (A) Kaplan-Meier survival plots of the FGF2-H and FGF2-L groups. (B) Forest plots showing that age, TNM staging and FGF2 expression were independent factors of GC prognosis. GC, gastric cancer; FGF2, fibroblast growth factor 2.
Clinical prognosis model with independent values
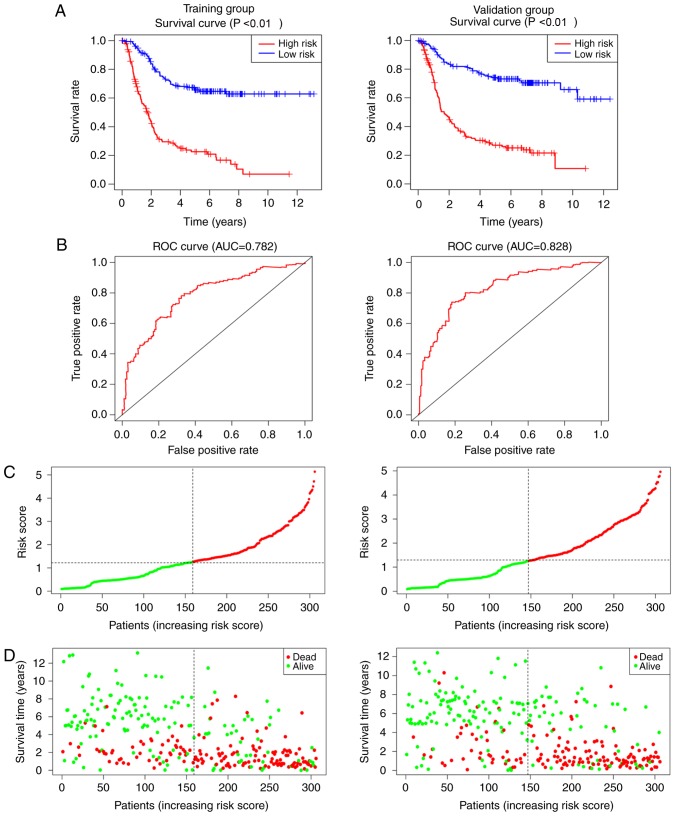
The risk score for each patient in the training group (n=306) and the validation group (n=306) was calculated based on the three independent factors, FGF2 levels, age and tumor staging, as identified by the multivariate Cox model (Fig. 6B). The survival analysis revealed that patients with low-risk scores had longer survival times in both the training and validation groups (P<0.001; Fig. 7A). ROC curves for the prognosis model were plotted, and the area under the curve was 78.2% in the training group and 82.8% in the validation group (Fig. 7B). The C-index was 0.725 in the training group [Hazard ratio (HR), 0.688–0.761; P<0.001] and 0.733 in the validation group (HR, 0.695–0.771; P<0.001). The results of the risk score and status plots (Fig. 7C and D) were consistent, and the accuracy and feasibility of the model were verified.
Figure 7.
Clinical prognosis model for gastric cancer. (A) Kaplan-Meier survival plots, (B) ROC curves, and (C) risk scores for the training and validation groups. (D) Status plot for the training and validation groups. ROC, receiver operating characteristic.
Discussion
GC is a common malignant tumor, with complex factors leading to high mortality and low 5-year survival rates. With technological developments, chromatin immunoprecipitation and sequencing technologies have improved, and increasing numbers of studies are now being conducted to understand in-depth the molecular mechanisms involved in GC (24).
FGF2 is a member of the FGF family and has important roles in various biological processes, such as angiogenesis, the regulation of the extracellular matrix, epithelial cell differentiation and inflammatory responses (8–10). In normal tissues, FGF2 promotes endothelial cell migration, smooth muscle proliferation and induces hematopoiesis (25,26). however, in tumor tissues, the roles of FGF2 in promoting angiogenesis and regulating cell adhesion may contribute to tumor progression (8–10). Previous studies have demonstrated that FGF2 activates cell proliferation and invasion through the PI3K/AKT, ERK or mitogen-activated protein kinase signaling pathways in esophageal, ovarian and breast cancers (27–29). Therefore, FGF2 serves important roles in the occurrence and development of tumors, and is closely associated with the activation of multiple signaling pathways. However, the role of FGF2 in the occurrence and prognosis of GC is not clear.
In the present study, the expression of FGF2 was higher in normal tissues compared with tumor tissues. Although the expression of FGF2 was found to be higher in normal tissues, the expression of FGF2 was identified to be associated with worse TNM staging using GEPIA; suggesting the need of further research to investigate the role of FGF2 in tumor. TNM stage is a significant prognostic factor in tumor progression (30,31). A comparison between FGF2-H and FGF2-L groups revealed more patients with advanced TNM staging, especially T stage, in the FGF2-H group. Previous studies have shown that FGF2, by promoting angiogenesis, allows gastric tumor cells to receive abundant nutrient supplies, thereby inducing a greater degree of tumor cell infiltration (8–10). In terms of N and M stages, though no significant differences were observed between the two groups in the present study, it was evident that the number of patients staged as N2 and N3 were higher in the FGF2-H group compared with the FGF2-L group. Similar results for the M stage of patients with GC were observed, indicating that FGF2 may affect to some extent the local and distant metastasis in GC. Further analysis involving a larger number of patients is required to confirm these observations.
In the present study, tumor immune infiltration was also evaluated, another important characteristic of GC. The degree of immune cell infiltration has different effects on tumor prognosis and has been studied previously (32–36). Preliminary analysis of the immune infiltration was conducted, no further analysis was performed as the main functional enrichment of genes in the FGF2-H and FGF2-L groups did not identify immune associated genes.
In the present study, there were significant differences in the proportion of CD4+ T-cells, M2 macrophages, mast cells and dendritic cells between the two groups. Specifically, the FGF2-H group had significantly higher proportions of resting CD4+ memory cells, γδ T cells, M2 macrophages and natural killer resting cells compared with the FGF2-L group, while the proportion of plasma cells, activated CD4+ memory cells, M0 macrophages and activated dendritic cells was lower than in the FGF2-L group. Previous studies have reported a negative correlation between the degree of infiltration of dendritic cells, tumor progression and metastasis (37,38). Therefore, the higher the number of dendritic cells, the more positive the prognosis for the patient. M2 macrophages are hypothesized to promote tumor growth, infiltration and metastasis, and their degree of infiltration is negatively correlated with the prognosis of patients (39,40). CD4+ T cells are important for the protection against cancer (41). In the present study, patients in the FGF2-L group had more dendritic cells, CD4+ memory activated T cells, fewer M2 cells, and a higher survival rate. These findings are consistent with the hypothesis that FGF2 may influence the prognosis of GC.
Using multivariate regression analysis, it was found that the survival time of patients in the FGF2-L group was significantly improved compared with the FGF2-H group. Age, TNM stage and FGF2 expression were independent factors for GC. With the construction of a Cox risk model, the clinical prognosis of patients was determined using their risk scores. For the training and validation groups, the ROC curves were 0.78 and 0.82, respectively, indicating the high accuracy of the current model. Additionally, patients with higher risk scores had poorer survival rates.
In summary, FGF2 levels may have an important role in the development of GC and may serve as an independent factor to evaluate the prognosis of patients with GC. Further studies, increasing the sample size and using verified clinical data, are essential to understand the molecular mechanisms involved in the prognosis of GC.
Supplementary Material
Acknowledgements
Not applicable.
Funding
The present study was supported by the National Natural Science Foundation of China (General Program; grant no. 81572355).
Availability of data and materials
The datasets used and/or analyzed during the current study are available from the GEO database.
Authors' contributions
YL and LL analyzed the data and drafted the manuscript. XG and JW evaluated and interpreted the data critically. XG, JW and HW evaluated and interpreted the data critically. LL revised and approved the final version of the manuscript. All authors critically revised the manuscript, and read and approved the final version of the manuscript.
Ethics approval and consent to participate
Not applicable.
Patient consent for publication
Not applicable.
Competing interests
The authors declare that they have no competing interests.
References
- 1.Ferlay J, Soerjomataram I, Dikshit R, Eser S, Mathers C, Rebelo M, Parkin DM, Forman D, Bray F. Cancer incidence and mortality worldwide: Sources, methods and major patterns in GLOBOCAN 2012. Int J Cancer. 2015;136:E359–E386. doi: 10.1002/ijc.29210. [DOI] [PubMed] [Google Scholar]
- 2.Jung KW, Won YJ, Kong HJ, Oh CM, Shin A, Lee JS. Survival of korean adult cancer patients by stage at diagnosis, 2006–2010: National cancer registry study. Cancer Res Treat. 2013;45:162–171. doi: 10.4143/crt.2013.45.3.162. [DOI] [PMC free article] [PubMed] [Google Scholar]
- 3.Lee JY, Cho KB, Kim ES, Park KS, Lee YJ, Lee YS, Jang BK, Chung WJ, Hwang JS. Risk factors for local recurrence after en bloc endoscopic submucosal dissection for early gastric cancer. World J Gastrointest Endosc. 2016;8:330–337. doi: 10.4253/wjge.v8.i7.330. [DOI] [PMC free article] [PubMed] [Google Scholar]
- 4.Lu Y, Xu Q, Zuo Y, Liu L, Liu S, Chen L, Wang K, Lei Y, Zhao X, Li Y. Isoprenaline/β2-AR activates plexin-A1/VEGFR2 signals via VEGF secretion in gastric cancer cells to promote tumor angiogenesis. BMC Cancer. 2017;17:875. doi: 10.1186/s12885-017-3894-0. [DOI] [PMC free article] [PubMed] [Google Scholar]
- 5.Xie M, Dart DA, Guo T, Xing XF, Cheng XJ, Du H, Jiang WG, Wen XZ, Ji JF. MicroRNA-1 acts as a tumor suppressor microRNA by inhibiting angiogenesis-related growth factors in human gastric cancer. Gastric Cancer. 2018;21:41–54. doi: 10.1007/s10120-017-0721-x. [DOI] [PMC free article] [PubMed] [Google Scholar]
- 6.D'Angelo G, Di Rienzo T, Ojetti V. Microarray analysis in gastric cancer: A review. World J Gastroenterol. 2014;20:11972–11976. doi: 10.3748/wjg.v20.i34.11972. [DOI] [PMC free article] [PubMed] [Google Scholar]
- 7.Hitzemann R, Bottomly D, Darakjian P, Walter N, Iancu O, Searles R, Wilmot B, McWeeney S. Genes, behavior and next-generation RNA sequencing. Genes Brain Behav. 2013;12:1–12. doi: 10.1111/gbb.12007. [DOI] [PMC free article] [PubMed] [Google Scholar]
- 8.Moffett J, Kratz E, Florkiewicz R, Stachowiak MK. Promoter regions involved in density-dependent regulation of basic fibroblast growth factor gene expression in human astrocytic cells. Proc Natl Acad Sci USA. 1996;93:2470–2475. doi: 10.1073/pnas.93.6.2470. [DOI] [PMC free article] [PubMed] [Google Scholar]
- 9.Coleman SJ, Chioni AM, Ghallab M, Anderson RK, Lemoine NR, Kocher HM, Grose RP. Nuclear translocation of FGFR1 and FGF2 in pancreatic stellate cells facilitates pancreatic cancer cell invasion. EMBO Mol Med. 2014;6:467–481. doi: 10.1002/emmm.201302698. [DOI] [PMC free article] [PubMed] [Google Scholar]
- 10.Ren T, Qing Y, Dai N, Li M, Qian C, Yang Y, Cheng Y, Li Z, Zhang S, Zhong Z, Wang D. Apurinic/apyrimidinic endonuclease 1 induced upregulation of fibroblast growth factor 2 and its receptor 3 induces angiogenesis in human osteosarcoma cells. Cancer Sci. 2014;105:186–194. doi: 10.1111/cas.12334. [DOI] [PMC free article] [PubMed] [Google Scholar]
- 11.Liu C, Guan H, Wang Y, Chen M, Xu B, Zhang L, Lu K, Tao T, Zhang X, Huang Y. miR-195 inhibits EMT by targeting FGF2 in prostate cancer cells. PLoS One. 2015;10:e0144073. doi: 10.1371/journal.pone.0144073. [DOI] [PMC free article] [PubMed] [Google Scholar]
- 12.Kim SK, Hebrok M. Intercellular signals regulating pancreas development and function. Genes Dev. 2001;15:111–127. doi: 10.1101/gad.859401. [DOI] [PubMed] [Google Scholar]
- 13.Turner N, Grose R. Fibroblast growth factor signalling: From development to cancer. Nat Rev Cancer. 2010;10:116–129. doi: 10.1038/nrc2780. [DOI] [PubMed] [Google Scholar]
- 14.Clarke WE, Berry M, Smith C, Kent A, Logan A. Coordination of fibroblast growth factor receptor 1 (FGFR1) and fibroblast growth factor-2 (FGF-2) trafficking to nuclei of reactive astrocytes around cerebral lesions in adult rats. Mol Cell Neurosci. 2001;17:17–30. doi: 10.1006/mcne.2000.0920. [DOI] [PubMed] [Google Scholar]
- 15.Cristescu R, Lee J, Nebozhyn M, Kim KM, Ting JC, Wong SS, Liu J, Yue YG, Wang J, Yu K, et al. Molecular analysis of gastric cancer identifies subtypes associated with distinct clinical outcomes. Nat Med. 2015;21:449–456. doi: 10.1038/nm.3850. [DOI] [PubMed] [Google Scholar]
- 16.Ooi CH, Ivanova T, Wu J, Lee M, Tan IB, Tao J, Ward L, Koo JH, Gopalakrishnan V, Zhu Y, et al. Oncogenic pathway combinations predict clinical prognosis in gastric cancer. PLoS Genet. 2009;5:e1000676. doi: 10.1371/journal.pgen.1000676. [DOI] [PMC free article] [PubMed] [Google Scholar]
- 17.Qian Z, Zhu G, Tang L, Wang M, Zhang L, Fu J, Huang C, Fan S, Sun Y, Lv J, et al. Whole genome gene copy number profiling of gastric cancer identifies PAK1 and KRAS gene amplification as therapy targets. Genes Chromosomes Cancer. 2014;53:883–894. doi: 10.1002/gcc.22196. [DOI] [PubMed] [Google Scholar]
- 18.Lei Z, Tan IB, Das K, Deng N, Zouridis H, Pattison S, Chua C, Feng Z, Guan YK, Ooi CH, et al. Identification of molecular subtypes of gastric cancer with different responses to PI3-kinase inhibitors and 5-fluorouracil. Gastroenterology. 2013;145:554–565. doi: 10.1053/j.gastro.2013.05.010. [DOI] [PubMed] [Google Scholar]
- 19.Irizarry RA, Hobbs B, Collin F, Beazer-Barclay YD, Antonellis KJ, Scherf U, Speed TP. Exploration, normalization, and summaries of high density oligonucleotide array probe level data. Biostatistics. 2003;4:249–264. doi: 10.1093/biostatistics/4.2.249. [DOI] [PubMed] [Google Scholar]
- 20.Huang da W, Sherman BT, Lempicki RA. Systematic and integrative analysis of large gene lists using DAVID bioinformatics resources. Nat Protoc. 2009;4:44–57. doi: 10.1038/nprot.2008.211. [DOI] [PubMed] [Google Scholar]
- 21.Berlth F, Bollschweiler E, Drebber U, Hoelscher AH, Moenig S. Pathohistological classification systems in gastric cancer: Diagnostic relevance and prognostic value. World J Gastroenterol. 2014;20:5679–5684. doi: 10.3748/wjg.v20.i19.5679. [DOI] [PMC free article] [PubMed] [Google Scholar]
- 22.Newman AM, Liu CL, Green MR, Gentles AJ, Feng W, Xu Y, Hoang CD, Diehn M, Alizadeh AA. Robust enumeration of cell subsets from tissue expression profiles. Nat Methods. 2015;12:453–457. doi: 10.1038/nmeth.3337. [DOI] [PMC free article] [PubMed] [Google Scholar]
- 23.Kamarudin AN, Cox T, Kolamunnage-Dona R. Time-dependent ROC curve analysis in medical research: Current methods and applications. BMC Med Res Methodol. 2017;17:53. doi: 10.1186/s12874-017-0332-6. [DOI] [PMC free article] [PubMed] [Google Scholar]
- 24.Cho JY. Molecular diagnosis for personalized target therapy in gastric cancer. J Gastric Cancer. 2013;13:129–135. doi: 10.5230/jgc.2013.13.3.129. [DOI] [PMC free article] [PubMed] [Google Scholar]
- 25.Guzy RD, Stoilov I, Elton TJ, Mecham RP, Ornitz DM. Fibroblast growth factor 2 is required for epithelial recovery, but not for pulmonary fibrosis, in response to bleomycin. Am J Respir Cell Mol Biol. 2015;52:116–128. doi: 10.1165/rcmb.2014-0184OC. [DOI] [PMC free article] [PubMed] [Google Scholar]
- 26.Ferreras C, Rushton G, Cole CL, Babur M, Telfer BA, van Kuppevelt TH, Gardiner JM, Williams KJ, Jayson GC, Avizienyte E. Endothelial heparan sulfate 6-O-sulfation levels regulate angiogenic responses of endothelial cells to fibroblast growth factor 2 and vascular endothelial growth factor. J Biol Chem. 2012;287:36132–36146. doi: 10.1074/jbc.M112.384875. [DOI] [PMC free article] [PubMed] [Google Scholar]
- 27.Maehara O, Suda G, Natsuizaka M, Ohnishi S, Komatsu Y, Sato F, Nakai M, Sho T, Morikawa K, Ogawa K, et al. Fibroblast growth factor-2-mediated FGFR/Erk signaling supports maintenance of cancer stem-like cells in esophageal squamous cell carcinoma. Carcinogenesis. 2017;38:1073–1083. doi: 10.1093/carcin/bgx095. [DOI] [PMC free article] [PubMed] [Google Scholar]
- 28.Lau MT, So WK, Leung PCK. Fibroblast growth factor 2 induces E-cadherin down-regulation via PI3K/Akt/mTOR and MAPK/ERK signaling in ovarian cancer cells. PLoS One. 2013;8:e59083. doi: 10.1371/journal.pone.0059083. [DOI] [PMC free article] [PubMed] [Google Scholar]
- 29.He Q, Ren X, Chen J, Li Y, Tang X, Wen X, Yang X, Zhang J, Wang Y, Ma J, Liu N. miR-16 targets fibroblast growth factor 2 to inhibit NPC cell proliferation and invasion via PI3K/AKT and MAPK signaling pathways. Oncotarget. 2016;7:3047–3058. doi: 10.18632/oncotarget.6504. [DOI] [PMC free article] [PubMed] [Google Scholar]
- 30.Choi YY, Jang E, Seo WJ, Son T, Kim HI, Kim H, Hyung WJ, Huh YM, Noh SH, Cheong JH. Modification of the TNM staging system for stage II/III gastric cancer based on a prognostic single patient classifier algorithm. J Gastric Cancer. 2018;18:142–151. doi: 10.5230/jgc.2018.18.e14. [DOI] [PMC free article] [PubMed] [Google Scholar]
- 31.Boeker M, França F, Bronsert P, Schulz S. TNM-O: Ontology support for staging of malignant tumours. J Biomed Semantics. 2016;7:64. doi: 10.1186/s13326-016-0106-9. [DOI] [PMC free article] [PubMed] [Google Scholar]
- 32.Hennequin A, Derangère V, Boidot R, Apetoh L, Vincent J, Orry D, Fraisse J, Causeret S, Martin F, Arnould L, et al. Tumor infiltration by Tbet+ effector T cells and CD20+ B cells is associated with survival in gastric cancer patients. OncoImmunology. 2015;5:e1054598. doi: 10.1080/2162402X.2015.1054598. [DOI] [PMC free article] [PubMed] [Google Scholar]
- 33.Lee HE, Chae SW, Lee YJ, Kim MA, Lee HS, Lee BL, Kim WH. Prognostic implications of type and density of tumour-infiltrating lymphocytes in gastric cancer. Br J Cancer. 2008;99:1704–1711. doi: 10.1038/sj.bjc.6604738. [DOI] [PMC free article] [PubMed] [Google Scholar]
- 34.Zhang WJ, Zhou ZH, Guo M, Yang LQ, Xu YY, Pang TH, Gao ST, Xu XY, Sun Q, Feng M, et al. High infiltration of polarized CD163+tumor-associated macrophages correlates with aberrant expressions of CSCs markers, and predicts prognosis in patients with recurrent gastric cancer. J Cancer. 2017;8:363–370. doi: 10.7150/jca.16730. [DOI] [PMC free article] [PubMed] [Google Scholar]
- 35.Galon J, Mlecnik B, Bindea G, Angell HK, Berger A, Lagorce C, Lugli A, Zlobec I, Hartmann A, Bifulco C, et al. Towards the introduction of the ‘Immunoscore’ in the classification of malignant tumours. J Pathol. 2014;232:199–209. doi: 10.1002/path.4287. [DOI] [PMC free article] [PubMed] [Google Scholar]
- 36.Fridman WH, Pagès F, Sautès-Fridman C, Galon J. The immune contexture in human tumours: Impact on clinical outcome. Nat Rev Cancer. 2012;12:298–306. doi: 10.1038/nrc3245. [DOI] [PubMed] [Google Scholar]
- 37.Sun HW, Tang QB, Cheng YJ, Zou SQ. Effects of dendritic cells transfected with full-length wild-type p53 and stimulated by gastric cancer lysates on immune response. World J Gastroenterol. 2004;10:2595–2597. doi: 10.3748/wjg.v10.i17.2595. [DOI] [PMC free article] [PubMed] [Google Scholar]
- 38.He S, Wang L, Wu Y, Li D, Zhang Y. CCL3 and CCL20-recruited dendritic cells modified by melanoma antigen gene-1 induce anti-tumor immunity against gastric cancer ex vivo and in vivo. J Exp Clin Cancer Res. 2010;29:37. doi: 10.1186/1756-9966-29-37. [DOI] [PMC free article] [PubMed] [Google Scholar]
- 39.Yamaguchi T, Fushida S, Yamamoto Y, Tsukada T, Kinoshita J, Oyama K, Miyashita T, Tajima H, Ninomiya I, Munesue S, et al. Low-dose paclitaxel suppresses the induction of M2 macrophages in gastric cancer. Oncol Rep. 2017;37:3341–3350. doi: 10.3892/or.2017.5586. [DOI] [PubMed] [Google Scholar]
- 40.Yamaguchi T, Fushida S, Yamamoto Y, Tsukada T, Kinoshita J, Oyama K, Miyashita T, Tajima H, Ninomiya I, Munesue S, et al. Tumor-associated macrophages of the M2 phenotype contribute to progression in gastric cancer with peritoneal dissemination. Gastric Cancer. 2016;19:1052–1065. doi: 10.1007/s10120-015-0579-8. [DOI] [PMC free article] [PubMed] [Google Scholar]
- 41.Yuan L, Xu B, Yuan P, Zhou J, Qin P, Han L, Chen G, Wang Z, Run Z, Zhao P, Gao Q. Tumor-infiltrating CD4+ T cells in patients with gastric cancer. Cancer Cell Int. 2017;17:114. doi: 10.1186/s12935-017-0489-4. [DOI] [PMC free article] [PubMed] [Google Scholar]
Associated Data
This section collects any data citations, data availability statements, or supplementary materials included in this article.
Supplementary Materials
Data Availability Statement
The datasets used and/or analyzed during the current study are available from the GEO database.


