Abstract
Objective:
To evaluate the impact of different metal artifact reduction (MAR) algorithms on Hounsfield unit (HU) and standardized uptake values (SUV) in a phantom setting and verify these results in patients with metallic implants undergoing oncological PET/CT examinations.
Methods and materials:
In this prospective study, PET-CT examinations of 28 oncological patients (14 female, 14 male, mean age 69.5 ± 15.2y) with 38 different metal implants were included. CT datasets were reconstructed using standard weighted filtered back projection (WFBP) without MAR, MAR in image space (MARIS) and iterative MAR (iMAR, hip algorithm). The three datasets were used for PET attenuation correction. SUV and HU measurements were performed at the site of the most prominent bright and dark band artifacts. Differences between HU and SUV values across the different reconstructions were compared using paired t-tests. Bonferroni correction was used to prevent alpha-error accumulation (p < 0.017).
Results:
For bright band artifacts, MARIS led to a non-significant mean decrease of 12.0% (345 ± 315 HU) in comparison with WFBP (391 ± 293 HU), whereas iMAR led to a significant decrease of 68.3% (125 ± 185 HU, p < 0.017). For SUVmean, MARIS showed no significant effect in comparison with WFBP (WFBP: 0.99 ± 0.40, MARIS: 0.96 ± 0.39), while iMAR led to a significant decrease of 11.1% (0.88 ± 0.35, p < 0.017). Similar results were observed for dark band artifacts.
Conclusion:
iMAR significantly reduces artifacts caused by metal implants in CT and thus leads to a significant change of SUV measurements in bright and dark band artifacts compared with WFBP and MARIS, thus probably improving PET quantification.
Advances in knowledge:
The present work indicates that MAR algorithms such as iMAR algorithm in integrated PET/CT scanners are useful to improve CT image quality as well as PET quantification in the evaluation of tracer uptake adjacent to large metal implants. A detailed analysis of oncological patients with various large metal implants using different MAR algorithms in PET/CT has not been conducted yet.
Introduction
In recent decades, PET/CT has become an established procedure in tumor diagnostics and tumor response assessment. Thus, it has been incorporated into several guidelines, most notably for lung cancer and lymphoma.1,2 Especially in elderly patients, implants such as total endo prosthesis of the hip or knee as well as dorsal spine instrumentations are frequent. These implants cause streak and band artifacts in PET/CT, which may limit diagnostic confidence in identifying adjacent pathology.3 Not only do these artifacts reduce diagnostic quality of the CT image, but also radiotracer uptake quantification is altered as modern PET/CT scanners rely on the CT datasets for attenuation correction of PET data.4 By feigning regions of high density, bright band artifacts lead to an overestimation of tracer uptake, while dark band artifacts imitate regions of low tissue density, leading to an underestimation of tracer uptake.5
In recent years, different techniques for CT metal artifact reduction (MAR) such as beam-hardening correction,6 segmentation with interpolation7 or dual-energy CT8 have been introduced into clinical practice. While dual-energy CT requires a dedicated hardware and CT scanning protocols, software-based algorithms solely require the CT raw data. Initial MAR algorithms such as MAR in Image Space (MARIS) apply corrections for beam hardening in the projection and image domain to reduce artifacts.9 Advanced iterative MAR (iMAR) algorithms use multiple iterations of correction and projection to eliminate metal artifacts.10,11
While using MARIS or iMAR in CT scans in patients with large metal implants is common clinical practice,12,13 only a few studies have evaluated the use of iMAR algorithms for attenuation correction in PET/CT. Initial studies using phantom scans demonstrated a possible effect of iMAR on PET quantification in patients with hip implants.14,15 However, a detailed analysis of oncological patients with various large metal implants using different MAR algorithms in PET/CT has not been conducted.
Therefore, the aim of the present study was to evaluate the impact of MAR algorithms on Hounsfield unit (HU) and standardized uptake value (SUV) measurements in a phantom with hip implant and to verify these results in oncological patients with metal implants.
Methods and materials
Phantom
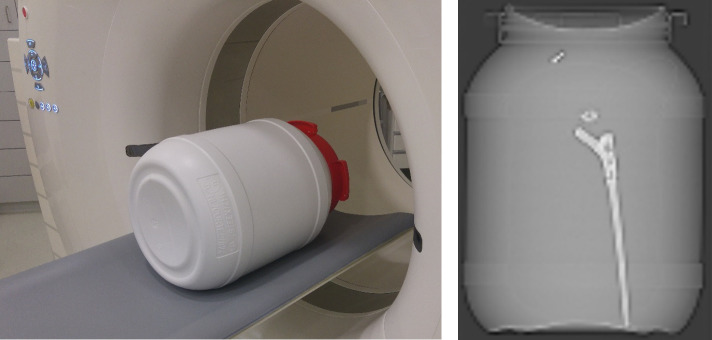
A phantom scan was performed as a proof-of-concept (Figure 1). The phantom consisted of a 25 L container with a 32 cm diameter, which is of comparable size to an adult abdomen and pelvis. Simulating a pelvis, the phantom contained a standard hip implant (Hip’n go stem, FH Ortho Inc., IL, USA). Because of a special custom-made design, the hip implant was lying freely in a solution of 18F-FDG and water. Similar to values seen in patient scans, background radiotracer concentration was diluted to approximately 6.5 kBq/mL.
Figure 1. .
Phantom construction containing standard hip implant and a solution of 18F-FDG and water. The phantom simulates a pelvis in a PET/CT scanner (left image), where the hip implant is lying freely in the phantom (CT topogram, right image).
Patients
28 oncological patients (14 female, 14 male, mean age 69.5 ± 15.2 years) with large metal implants undergoing a PET/CT examination between April and August 2017 were included in this prospective study. The institutional review board of the Medical Faculty of the University of Düsseldorf approved this prospective study and written informed consent was obtained from all patients.
Overall, the included patients had 38 different metal implants which included hip implants (n = 16), knee implants (n = 13), plate osteosynthesis (n = 4), shoulder implants (n = 3), and spine implants (n = 2). Patients fasted for 6 h prior to the examination to ensure that blood glucose levels were below 150 mg dl−1 (8.32 mmol l−1). In all patients, 18F-FDG was used as tracer. The activity of 18F-FDG was dependent on the patient’s weight, resulting in a mean activity of 220 ± 40 MBq.
Data acquisition
PET and CT data were acquired on a biograph mCT PET/CT scanner (128 slices, Siemens Healthineers, Forchheim, Germany). Image acquisition was performed 64.9 ± 5.8 min after tracer injection. As specified in our standard protocol for whole body PET/CT examinations, CT examinations were performed with automated tube current modulation (CareDose 4D, Siemens Healthineers) with a reference tube current time product of 190 mAs. Automated tube voltage selection was used (CarekV, Siemens Heathineers) with a reference value of 120 kVp. CT data were acquired with a 0.5 s rotation time, 32 × 1.2 mm collimation and a pitch of 0.8. PET data were acquired for 3 min per bed position.
The phantom was scanned with the same parameters except for the tube voltage, which was set to 120kVp.
CT image reconstruction
CT raw data were exported to a separate workstation and CT image reconstructions were performed using a dedicated software (ReconCT v. 13.8.2.0, Siemens Heathineers). Reconstructions were performed using weighted filtered back projection (WFBP) as standard method, MAR in image space (MARIS), and an iterative metal artifacts reduction (iMAR) 2D algorithm for large implants (called “hip implant”, HIP). All images were reconstructed in axial orientation with a slice thickness of 5 mm and a 2 mm increment using a medium smooth kernel (B30f) and a matrix size of 512 × 512.
PET reconstruction
Attenuation-corrected PET images were reconstructed using WFBP, MARIS, and iMAR-hip CT datasets using ordered subset expectation maximization with four iterations and eight subsets. The slice thickness was matched to the CT images. A Gaussian filter kernel with a full width at half maximum of 2.0 mm was used for postreconstruction filtering, with a transaxial matrix size of 200 × 200.
Image analysis
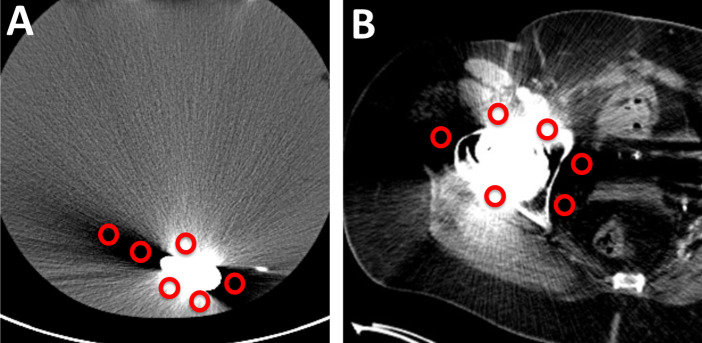
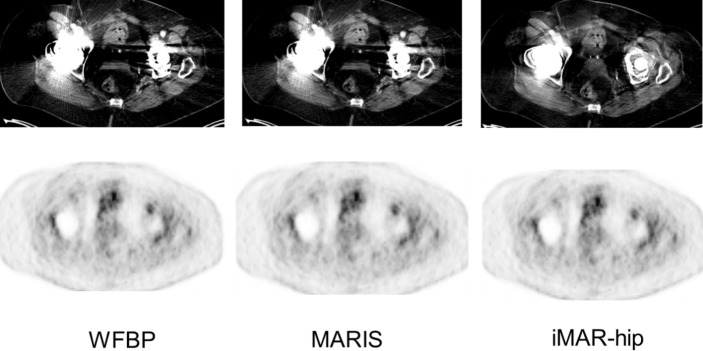
For anatomical analysis, CT Images reconstructed using WFBP without MAR, MARIS, and iMAR-hip were analyzed. For SUV analysis, PET images based on the three CT reconstructions as attenuation correction were analyzed (Figure 2). In each CT reconstruction, six circular ROIs with a diameter of 10 mm were placed: three ROIs within the most prominent bright band artifact and three ROIs within the most prominent dark band artifact. The ROIs were automatically copied to all three PET reconstructions. For each ROI, average HU values in the CT images and SUVmean and SUVmax values in PET images were measured.
Figure 2. .
Measurement of HU values in the phantom (A) and patient scan (B), both containing a hip implant. In each image, three circular regions of interest (ROIs) with 10 mm diameter were drawn at the most prominent bright band artifacts and three in the most prominent dark band artifacts.
Statistical analysis
Statistical analysis was performed using SPSS Statistics 24 (IBM Corp., Chicago, IL, USA). Mean and standard deviation was calculated for HU values in CT as well as SUVmean and SUVmax in PET reconstructions in the bright and dark band artifacts for WFBP, MARIS, and iMAR-hip. Differences between HU and SUV were compared between WFBP, MARIS, and iMAR-hip in the bright and dark band artifacts using a paired t-test. Bonferroni correction was used to prevent alpha-error accumulation (p < 0.017).
Results
Phantom scan
In the phantom scan, a significant change in HU could be observed in the iMAR images in comparison with WFBP in bright band artifacts (WFBP: 261 ± 99, iMAR-hip: 48 ± 26) and in dark band artifacts (WFBP: −242 ± 122, iMAR: −21 ± 14, both p < 0.017). MARIS showed no significant impact on HU values in dark and bright band artifacts in comparison with WFBP (Table 1).
Table 1. .
Phantom measurements: Values of HU and SUV measurement for bright and dark band artifacts in WFBP, MARIS, and iMAR. HU, SUVmax and SUVmean values of bright band artifacts significantly decreased, and of dark band artifacts significantly increased in IMAR compared to WFBP. MARIS showed no significant impact on HU and SUV measurements in comparison with WFBP
| bright band | dark band | ||
|---|---|---|---|
| HU | WFBP | 261.4 ± 98.8 | −241.6 ± 121.5 |
| MARIS | 197.5 ± 67.4 | −171.2 ± 71.9 | |
| iMAR | 48.0 ± 26.4a | −20.7 ± 13.9a | |
| SUVmean | WFBP | 1.15 ± 0.04 | 0.75 ± 0.10 |
| MARIS | 1.11 ± 0.06 | 0.81 ± 0.07 | |
| iMAR | 0.99 ± 0.08a | 1.00 ± 0.01a | |
| SUVmax | WFBP | 1.33 ± 0.11 | 0.95 ± 0.15 |
| MARIS | 1.25 ± 0.10 | 1.03 ± 0.09 | |
| iMAR | 1.14 ± 0.14a | 1.19 ± 0.02a |
HU: Hounsfield unit; MARIS: metal artifact reduction in image space; SUV: standardized uptake value; WFBP: weighted filtered back projection; iMAR: iterative metal artifact reduction.
p<0.017 between WFBP and iMAR
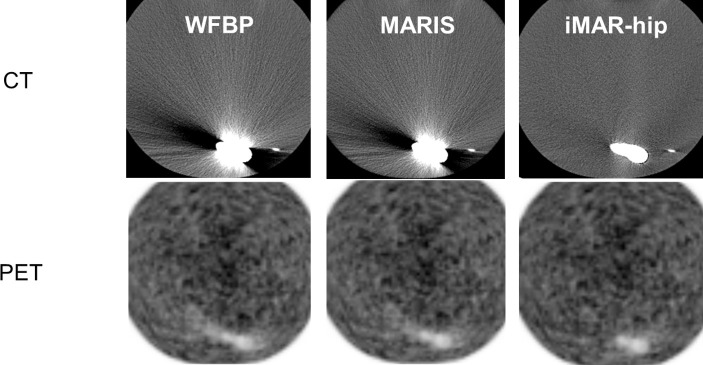
In PET quantification, iMAR led to a significant decrease in comparison with WFBP in bright band artifacts of 13.9% in SUVmean (WFBP: 1.15 ± 0.04, iMAR: 0.99 ± 0.08) and of 14.3% in SUVmax (WFBP: 1.33 ± 0.11, iMAR: 1.14 ± 0.14, both p < 0.017). In dark band artifacts, iMAR-hip led to an increase of 33.3% in SUVmean (WFBP: 0.75 ± 0.10, iMAR: 1.00 ± 0.01) and of 25.3% in SUVmax (WFBP: 0.95 ± 0.15, iMAR: 1.19 ± 0.02, both p < 0.017). There was no significant change in SUV measurement between WFBP and MARIS (Figure 3).
Figure 3. .
Comparison of WFBP, MARIS, and iMAR-hip in CT and PET in phantom scan. iMAR leads to an improved image quality adjacent to the hip implant in CT and PET images. Between WFBP and MARIS, no relevant visual differences can be observed. WFBP: weighted filtered back projection; MARIS: metal artifact reduction in image space; iMAR: iterative metal artifact reduction.
An additional measurement was performed in the phantom in regions that showed no artifacts from the hip implant. HU values were −2 ± 15 for WFBP, −4 ± 15 for iMAR-hip, and −3 ± 15 for MARIS. For SUV measurements, SUVmax in WFBP was 1.16 ± 0.15, 1.17 ± 0.13 in iMAR-hip and 1.16 ± 0.17 in MARIS. There was no significant change in both HU and SUV measurements between the three reconstructions.
Therefore, in bright band artifacts, WFBP led to an absolute increase of 263 ± 72 HU, whereas the increase of iMAR-hip was 80.2% lower (52 ± 21, p < 0.017). For dark band artifacts, the increase of HU values in iMAR-hip was 92.9% in comparison with WFBP (WFBP: −240 ± 89; iMAR-hip: −17 ± 14; p < 0.017). In PET quantification, iMAR-hip led to a decrease of 82.4% in SUVmax in bright band artifacts compared to WFBP (WFBP: 0.17 ± 0.11, iMAR-hip: −0.03 ± 0.12, p < 0.017) and an increase of 90.5% in SUVmax in dark band artifacts (WFBP: −0.21 ± 0.13, iMAR-hip: 0.02 ± 0.12, p < 0.017). There was no significant impact on HU and SUV measurement between WFBP and MARIS.
Patient scan
In bright band artifacts, MARIS led to a non-significant decrease of 12.0% (345 ± 315 HU) in comparison with WFBP (391 ± 293 HU). iMAR led to a significant decrease of 68.3% (125 ± 185 HU, p < 0.017). Similar results could be observed in dark band artifacts: MARIS led to a non-significant increase of 20.4% (WFBP: −465 ± 241 HU, MARIS: −371 ± 248 HU), whereas iMAR led to a significant increase of 84.1% (-74 ± 168 HU, p < 0.017) (Table 2).
Table 2. .
Patient examinations: Values of HU and SUV measurements in bright and dark band artifacts in WFBP, MARIS, and iMAR reconstructions. iMAR leads to a significant decrease of HU and SUVmean in bright band artifacts and to a significant increase of HU and SUVmean in dark band artifacts in comparison with WFBP. For MARIS, HU and SUV measurements do not change significantly in comparison with WFBP
| bright band | dark band | ||
|---|---|---|---|
| HU | WFBP | 391.4 ± 293.0 | −465.0 ± 241.4 |
| MARIS | 344.6 ± 314.7 | −370.9 ± 247.5 | |
| iMAR | 124.6 ± 184.5a | −74.3 ± 168.1a | |
| SUVmean | WFBP | 0.99 ± 0.40 | 0.72 ± 0.41 |
| MARIS | 0.96 ± 0.39 | 0.74 ± 0.42 | |
| iMAR | 0.88 ± 0.35a | 0.87 ± 0.46a | |
| SUVmax | WFBP | 1.09 ± 0.43 | 0.76 ± 0.43 |
| MARIS | 1.06 ± 0.42 | 0.79 ± 0.45 | |
| iMAR | 0.98 ± 0.39a | 0.92 ± 0.49a |
HU: Hounsfield Unit; MARIS: metal artifact reduction in image space; SUV: standardized uptake value; WFBP: weighted filtered back projection; iMAR: iterative metal artifact reduction.
p<0.017 between WFBP and iMAR
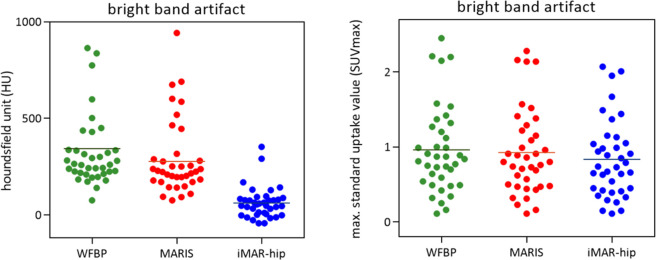
These findings translate to PET quantification: in both, bright and dark band artifacts, SUVmean and SUVmax were comparable when using WFBP and MARIS for PET attenuation correction. iMAR led to a significant SUVmean and SUVmax decrease of 11.1 and 10.1%, respectively, in comparison with WFBP (SUVmean: WFBP: 0.99 ± 0.40, iMAR: 0.88 ± 0.35, SUVmax: WFBP: 1.09 ± 0.43, iMAR: 0.98 ± 0.39, p < 0.017, respectively) (Figure 4). For dark band artifacts, SUVmean increased by 20.8% (WFBP: 0.72 ± 0.41, iMAR: 0.87 ± 0.46, p < 0.017) and SUVmax increased by 21.1% (WFBP: 0.76 ± 0.43, iMAR: 0.92 ± 0.49, p < 0.017) when using iMAR compared with WFBP for attenuation correction.
Figure 4. .
Changes of HU and SUVmax values in bright band artifacts (patient scans with WFBP, MARIS, and iMAR-hip). The reduction of the bright band artifact HU and SUVmax values by iMAR in comparison with WFBP is significant (p < 0.017). For MARIS, there are no significant changes in both HU and SUV measurements. HU: Hounsfield unit; SUV: standardised uptake value; WFBP: weighted filtered back projection; MARIS: metal artifact reduction in image space; iMAR: iterative metal artifact reduction.
Discussion
Our data demonstrate the effectiveness of the iMAR algorithm not only to reduce artifacts from large metal implants, but also to improve PET image attenuation correction and provide more reliable, quantitative SUV measurements adjacent to large metal implants.
Over the last years, various techniques have been introduced to reduce metal artifacts in CT examinations. Modern techniques such as MARIS or the iMAR algorithm solely rely on CT raw data. Thus, no additional hardware or radiation exposure are necessary. In recent studies, the iMAR algorithm improved CT image quality and reduced metal artifacts from large metal artifacts and dental implants.7,16 As PET reconstructions in integrated PET/CT scanners are based on CT data, iMAR was found to influence PET attenuation correction in phantom measurements. Preliminary data also indicate a change of SUV values of different radiotracers when using the iMAR algorithm in patients with metal implants.5,15
Our data demonstrate that iMAR leads to significant changes of HU measurements in dark and bright band artifacts from large metal implants in oncological 18F-FDG PET/CT examinations. This is in accordance to previous CT-studies demonstrating a reduction of image artifacts when using iMAR algorithms.7,12 In contrast to these results with the iMAR algorithm, MARIS had no significant impact on HU values in phantom scan and patient examinations in PET/CT.
These findings also translate to PET: In the phantom measurement, iMAR leads to more accurate quantitative SUV measurement adjacent to large metal implants. This effect can also be observed in our patient cohort. This could affect the diagnostic confidence and PET quantification not only of tissue adjacent to knee or shoulder implants, e.g. in sarcoma patients undergoing PET/CT for recurrence diagnostics, but also to suspicious lesions in pelvic organs in patients with hip implants (Figure 5).
Figure 5. .
Band artifacts caused by bilateral hip implants in a 59-year-old patient suffering from prostate cancer. The dark and bright band artifacts that can be observed in WFBP and MARIS CT images have almost disappeared using the iMAR-hip algorithm, leading to an improved diagnostic image quality in the pelvis. Despite the improved PET quantification, there is no obvious visual difference between the different PET reconstructions. WFBP: weighted filtered back projection; MARIS: metal artifact reduction in image space; iMAR: iterative metal artifact reduction.
Our study has limitations. Although we chose the iMAR algorithm for large implants, more iMAR algorithms were available. The results were not compared to other MAR algorithms (e.g., iMAR algorithms from other vendors). Besides, a comparison with dual-energy CT-based MAR techniques could not be made. In our cohort, no PET positive lesions were located adjacent to the metal implants. Therefore, impact of MARIS and iMAR on pathological tracer uptake could not be quantified.
Conclusion
iMAR reduced artifacts in CT-images and improved CT image quality in patients with large metal implants. This had a direct effect on PET image attenuation correction, leading to a more accurate SUV quantification in locations with bright and dark band artifacts. A similar effect could not be observed for the MARIS algorithm neither in the phantom scan nor in patient examinations.
Therefore, we recommend implementing the iMAR algorithm in integrated PET/CT scanners to improve CT image and improve PET quantification in the evaluation of tracer uptake adjacent to large metal implants.
Footnotes
Acknowledgment: This publication contains parts of the MD thesis of Katrin Wingendorf and is therefore in partial fulfillment of the requirements for an MD thesis at the Medical Faculty of the Heinrich-Heine University, Dusseldorf.
Conflict of interest: Benedikt M. Schaarschmidt is a stockholder for General Electric. Until September 2018, Benedikt M. Schaarschmidt was stockholder for Bayer AG, Siemens AG, Siemens Healthineers AG and TEVA Pharmaceuticals.
Contributor Information
Ole Martin, Email: Ole.Martin@med.uni-duesseldorf.de.
Joel Aissa, Email: joel.aissa@med.uni-duesseldorf.de.
Johannes Boos, Email: Johannes.Boos@med.uni-duesseldorf.de.
Katrin Wingendorf, Email: Katrin@kkkw.de.
David Latz, Email: David.Latz@med.uni-duesseldorf.de.
Susanne Gaspers, Email: Susanne.Gaspers@med.uni-duesseldorf.de.
Christina Antke, Email: Christina.Antke@med.uni-duesseldorf.de.
Martin Sedlmair, Email: martin.sedlmair@siemens.com.
Gerald Antoch, Email: Antoch@med.uni-duesseldorf.de.
Benedikt M. Schaarschmidt, Email: Benedikt.Schaarschmidt@uk-essen.de.
REFERENCES
- 1.Cheson BD, Fisher RI, Barrington SF, Cavalli F, Schwartz LH, Zucca E, et al. Recommendations for initial evaluation, staging, and response assessment of Hodgkin and non-Hodgkin lymphoma: the Lugano classification. J Clin Oncol 2014; 32: 3059–67. doi: 10.1200/JCO.2013.54.8800 [DOI] [PMC free article] [PubMed] [Google Scholar]
- 2.Planchard D, Popat S, Kerr K, Novello S, Smit EF, Faivre-Finn C, et al. Metastatic non-small cell lung cancer: ESMO clinical practice guidelines for diagnosis, treatment and follow-up. Ann Oncol 2018; 29(Suppl 4): iv192–237. doi: 10.1093/annonc/mdy275 [DOI] [PubMed] [Google Scholar]
- 3.Barrett JF, Keat N. Artifacts in CT: recognition and avoidance. Radiographics 2004; 24: 1679–91. doi: 10.1148/rg.246045065 [DOI] [PubMed] [Google Scholar]
- 4.Goerres GW, Ziegler SI, Burger C, Berthold T, Von Schulthess GK, Buck A. Artifacts at PET and PET/CT caused by metallic hip prosthetic material. Radiology 2003; 226: 577–84. doi: 10.1148/radiol.2262012141 [DOI] [PubMed] [Google Scholar]
- 5.Schabel C, Gatidis S, Bongers M, Hüttig F, Bier G, Kupferschlaeger J, et al. Improving CT-based PET attenuation correction in the vicinity of metal implants by an iterative metal artifact reduction algorithm of CT data and its comparison to Dual-Energy-Based strategies: a phantom study. Invest Radiol 2017; 52: 61–5. doi: 10.1097/RLI.0000000000000306 [DOI] [PubMed] [Google Scholar]
- 6.Verburg JM, Seco J. CT metal artifact reduction method correcting for beam hardening and missing projections. Phys Med Biol 2012; 57: 2803–18. doi: 10.1088/0031-9155/57/9/2803 [DOI] [PubMed] [Google Scholar]
- 7.Boos J, Sawicki LM, Lanzman RS, Thomas C, Aissa J, Schleich C, et al. Metal artifact reduction (MAR) based on two-compartment physical modeling: evaluation in patients with hip implants. Acta Radiol 2017; 58: 70–6. doi: 10.1177/0284185116633911 [DOI] [PubMed] [Google Scholar]
- 8.Winklhofer S, Benninger E, Spross C, Morsbach F, Rahm S, Ross S, et al. Ct metal artefact reduction for internal fixation of the proximal humerus: value of mono-energetic extrapolation from dual-energy and iterative reconstructions. Clin Radiol 2014; 69: e199–206. doi: 10.1016/j.crad.2013.12.011 [DOI] [PubMed] [Google Scholar]
- 9.Raupach R, Shukla H, Amies C, Loeffler W. Maris – metal artifact reduction in image space – technical principles. Siemens Healthcare whitepaper 2013. [Google Scholar]
- 10.Subhas N, Primak AN, Obuchowski NA, Gupta A, Polster JM, Krauss A, et al. Iterative metal artifact reduction: evaluation and optimization of technique. Skeletal Radiol 2014; 43: 1729–35. doi: 10.1007/s00256-014-1987-2 [DOI] [PubMed] [Google Scholar]
- 11.Axente M, Paidi A, Von Eyben R, Zeng C, Bani-Hashemi A, Krauss A, et al. Clinical evaluation of the iterative metal artifact reduction algorithm for CT simulation in radiotherapy. Med Phys 2015; 42: 1170–83. doi: 10.1118/1.4906245 [DOI] [PubMed] [Google Scholar]
- 12.Aissa J, Boos J, Sawicki LM, Heinzler N, Krzymyk K, Sedlmair M, et al. Iterative metal artefact reduction (MAR) in postsurgical chest CT: comparison of three iMAR-algorithms. Br J Radiol 2017; 90: 20160778. doi: 10.1259/bjr.20160778 [DOI] [PMC free article] [PubMed] [Google Scholar]
- 13.Aissa J, Boos J, Schleich C, Sedlmair M, Krzymyk K, Kröpil P, et al. Metal artifact reduction in computed tomography after deep brain stimulation electrode placement using iterative reconstructions. Invest Radiol 2017; 52: 18–22. doi: 10.1097/RLI.0000000000000296 [DOI] [PubMed] [Google Scholar]
- 14.Kennedy JA, Israel O, Frenkel A, Bar-Shalom R, Azhari H. The reduction of artifacts due to metal hip implants in CT-attenuation corrected PET images from hybrid PET/CT scanners. Med Biol Eng Comput 2007; 45: 553–62. doi: 10.1007/s11517-007-0188-8 [DOI] [PubMed] [Google Scholar]
- 15.van der Vos CS, Arens AIJ, Hamill JJ, Hofmann C, Panin VY, Meeuwis APW, et al. Metal artifact reduction of CT scans to improve PET/CT. J Nucl Med 2017; 58: 1867–72. doi: 10.2967/jnumed.117.191171 [DOI] [PubMed] [Google Scholar]
- 16.Diehn FE, Michalak GJ, DeLone DR, Kotsenas AL, Lindell EP, Campeau NG, et al. Ct dental artifact: comparison of an iterative metal artifact reduction technique with weighted filtered Back-Projection. Acta Radiol Open 2017; 6: 205846011774327. doi: 10.1177/2058460117743279 [DOI] [PMC free article] [PubMed] [Google Scholar]


