Abstract
Objective:
The aim of this phantom study was to investigate the effect of scan parameters and noise suppression techniques on the minimum radiation dose for acceptable image quality for CT emphysema densitometry.
Methods:
The COPDGene phantom was scanned on a third generation dual-source CT system with 16 scan setups (CTDIvol 0.035–10.680 mGy). Images were reconstructed at 1.0/0.7 mm slice thickness/increment, with three kernels (one soft, two hard), filtered backprojection and three grades of third-generation iterative reconstruction (IR). Additionally, deep learning-based noise suppression software was applied. Main outcomes: overlap in area of the normalized histograms of CT density for the emphysema insert and lung material, and the radiation dose required for a maximum of 4.3% overlap (defined as acceptable image quality).
Results:
In total, 384 scan reconstructions were analyzed. Decreasing radiation dose resulted in an exponential increase of the overlap in normalized histograms of CT density. The overlap was 11–91% for the lowest dose setting (CTDIvol 0.035mGy). The soft kernel reconstruction showed less histogram overlap than hard filter kernels. IR and noise suppression also reduced overlap. Using intermediate grade IR plus noise suppression software allowed for 85% radiation dose reduction while maintaining acceptable image quality.
Conclusion:
CT density histogram overlap can quantify the degree of discernibility of emphysema and healthy lung tissue. Noise suppression software, IR, and soft reconstruction kernels substantially decrease the dose required for acceptable image quality.
Advances in knowledge:
Noise suppression software, IR, and soft reconstruction kernels allow radiation dose reduction by 85% while still allowing differentiation between emphysema and normal lung tissue.
Introduction
In industrialized countries, many people suffer from cardiovascular disease (CVD), lung cancer and chronic obstructive pulmonary disease (COPD). These three diseases are collectively referred to as the "big three." CVD, lung cancer and COPD have high rates of mortality and morbidity.1–4
Early detection combined with early treatment may reduce the disease burden, which has been shown for lung cancer detected by screening with low dose CT.5 Screening for lung cancer has been introduced in the USA, and is under consideration in Europe.6 A low dose CT scan made for lung cancer screening may also allow evaluation of imaging biomarkers of emphysema.7 CT-assessed emphysema has been linked to increased mortality in the MESA and COPDGene Study.8,9
Emphysema can be quantified by analyzing the density of the lung parenchyma by measuring the Hounsfield unit (HU) of lung voxels.7 The underlying rationale is that destruction of alveolar walls and air trapping will result in an increased air content of lung tissue, lowering its density. HU density values correlate with pulmonary function test (PFT) and pathology results, the gold-standard for diagnosing COPD and quantifying emphysema.10,11
One of the main challenges in low dose CT screening is to achieve adequate image quality, while limiting radiation exposure. Standardized phantoms may help to reliably compare imaging biomarker results that were obtained with different CT scanning and reconstruction methods. A phantom simulating COPD has previously been developed (the COPDGene phantom)12 (Figure 1).
Figure 1.
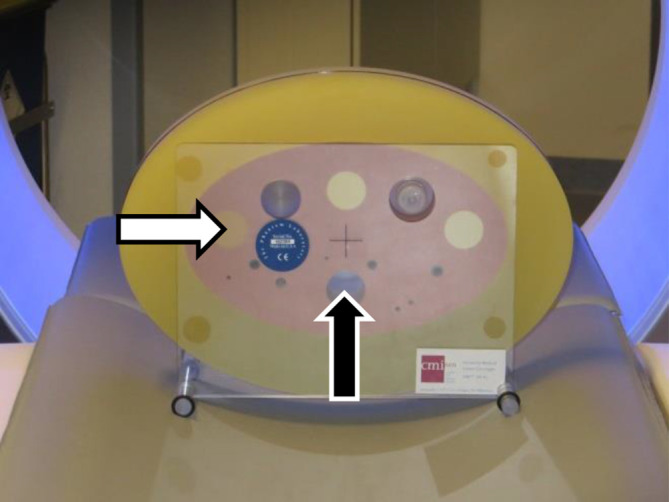
COPDGene phantom (CTP698). Materials used in this study: lung-like material (pink material surrounding the inserts), emphysema-like insert (left-most larger insert, white arrow), and air hole (hole in the lower center, black arrow)
The Quantitative Imaging Biomarker Alliance (QIBA) is developing a profile for quantifying lung density on CT. They aim to define what is sufficient "image quality," meaning suitable for quantitative densitometry analysis. The most recent proposed maximum standard deviation (SD) for the CT density of the water insert and air insert is 20 HU.13 They further propose that the deviation of the mean from the true value should be at the most 6 HU for water and air inserts. Therefore, the mean value for water and air should be between −6 and 6 HU, and between −1006 and −994 HU, respectively.
Noise reduction methods can be employed to allow dose reduction while still preserving adequate quality for visual reading and quantitative analysis, as decreasing radiation exposure will increase noise. One well-known method of reducing image noise is the use of iterative reconstruction. Another method of noise reduction is using a Non-iterative Technique Artificial Neural Network (NiTANN) deep learning algorithm, trained with pairs of normal and low dose CT scans. A NiTANN uses a complex arrangement of simple computational steps to achieve a mathematically defined goal, which in this case is to train the software to "reconstruct" a normal dose image from the low dose acquisition.
As stated in its FDA-clearance, the NiTANN used in this study can be used for “processing and enhancement of CT images.” “It is specifically indicated for assisting professional Radiologists and Specialists in arriving at their own diagnosis.”14 It can be integrated in the normal workflow by adding a separate DICOM network node running the NiTANN software.
The aim of this phantom study was to study the effect of scan parameters and noise suppression techniques on the minimum radiation dose resulting in images that are suitable for CT emphysema densitometry.
Methods
Phantom and CT acquisition protocol
The COPDGene phantom12 was used. It is approximately 35 cm wide, 25 cm high and 6 cm deep and contains inserts of different densities, one of which has a HU value low enough to simulate emphysema and has a reported density of −937 HU. The phantom also has an empty hole, simulating air trapping or bullae (Figure 1).
Scans were acquired using a third-generation dual-source CT system (SOMATOM Force, Siemens Healthineers, Forchheim, Germany) with 96*0.6 mm collimation, a pitch of 2.5, and a field of view diameter of 400 mm.
The selected kV values were 70, 100 (with and without Sn filter), and 120 kV, to cover the range of tube voltages in thoracic imaging. The effective tube current time products used were 10, 20, 30 mAs, as well as the maximum tube current setting that the system allowed for the selected kV, namely 260 mAs for 70 kV, 240 mAs for 100 kV with and without Sn filter, and 200 mAs for 120 kV. The maximum mAs scan was not made as a normal dose reference, but to determine the maximum quality for a given kV setting. The associated computer tomography dose index (volumetric) (CTDIvol) for each kV-mAs-combination is shown in Table 1.
Table 1.
CTDIvol in mGy for each combination of kVp and mAs.
| 70 kVp | 100 kVp (with Sn filter) |
100 kVp (without Sn filter) |
120 kVp | |
|---|---|---|---|---|
| 10 mAs | 0.09 | 0.03 | 0.32 | 0.53 |
| 20 mAs | 0.18 | 0.07 | 0.63 | 1.07 |
| 30 mAs | 0.27 | 0.10 | 0.95 | 1.60 |
| max mAs | 2.34 | 0.83 | 7.60 | 10.68 |
CTDIvol, Computer Tomography Dose Index (volumetric).
Max mAs is 260 mAs for 70 kVp, 240 mAs for 100 kVp (independent of tin filter), and 200 for 120 kVp.
Acquisitions were reconstructed with a slice thickness of 1 mm/increment of 0.7 mm, with standard filtered backprojection (FBP), and with third-generation iterative reconstruction (IR) settings, advanced model iterative reconstruction (ADMIRE), Grades 1, 3 and 5. Scans were reconstructed with a soft tissue kernel (Br40), a hard quantification kernel (Qr59), and a very hard kernel used for lung imaging (Bl57). Further processing was done with NiTANN. In this study, the first FDA-cleared market version of PixelShine (AlgoMedica, Palo Alto, CA) was used (version 1.2.18). PixelShine is a noise-reduction algorithm that is based on deep learning. The training of NiTANN was performed with both phantom scans and human scans, and tested with human scan images (Algomedica technical staff, oral communication, June 2019). During normal use there will be no training, so the same input will always result in the same output.15 This lack of training during use also means that the hardware requirements are much lower, resulting in a processing speed of several slices per second on a consumer-grade system.15
Although integration of this software in the clinical workflow as a DICOM network node is possible, the processing for this study was performed on a separate laptop provided by the vendor.
In total, we acquired 384 reconstructions (4 kVp settings, 4 mAs settings, 3 kernels, 4 reconstruction options, and 2 options for PixelShine). The phantom was not moved between the different scans.
Outcome metric development
Quantification of emphysema depends on distinguishing the voxels with emphysema from those with healthy parenchyma. The present study focuses on density analysis, by which emphysema can be differentiated from “normal” lung-like material if the CT density distributions do not overlap.
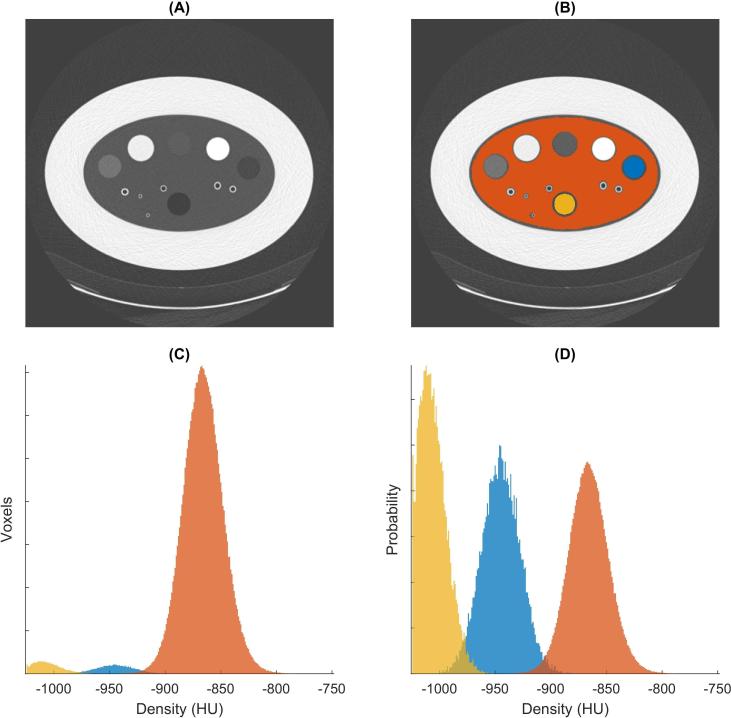
Histograms of CT density were made of all voxels labeled as emphysema and as lung material. These two histograms were then normalized (i.e. divided by the total number of voxels). This enabled comparison of lung material and emphysema material, even though they had a different number of voxels. Next, the overlap in histogram distributions was calculated. The workflow of calculating the overlap in the phantom CT density histograms is described in Figure 2.
Figure 2.
Steps of calculating overlap in density distributions. (A) Transverse CT image (120 kVp, 20 mAs, Br40, FBP, no NiTANN applied), (B) shows the same CT image with the LabelMap overlay (lung-like material in orange, air insert in yellow, emphysema-like insert in blue). (C) CT density histogram for voxels with lung, air and emphysema, same color scheme as in (B). (D) Normalized histograms (i.e. the total area of each histogram was made the same). The overlap between emphysema and lung (blue and orange) was 2.5% in this case. FBP, filtered backprojection; NiTANN, non-iterative technique artificial neural network.
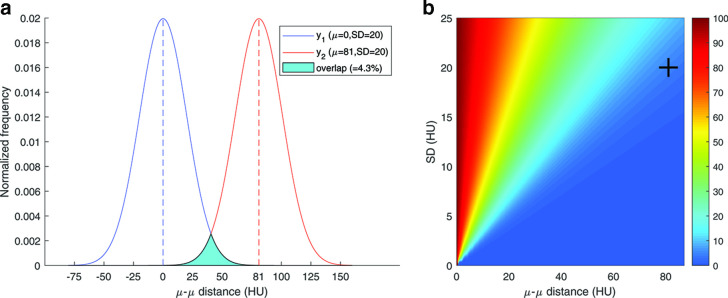
A simulation was performed to determine a threshold for acceptable overlap. The overlap was calculated for varying values of SD and differences of mean value between the simulated density histograms. Both distributions were assumed to be normal distributions for this calculation. The result of this simulation is shown in Figure 3. At 81 HU separation (the separation between the values for the lung and emphysema inserts reported by Newell et al.: −937 HU and −856 HU) and a SD at the limit proposed by QIBA (20 HU), the overlap was calculated at 4.3%.12,13 This percentage was then considered the upper cut-off value for acceptable overlap in the remainder of this study.
Figure 3.
Results of overlap simulation. (A) Simulated overlap percentage calculation was based on two normal distributions with equal SD and a specific distance between their means. The image shows the overlap as the filled cyan area. In this example the separation is 81 HU (mean difference between emphysema insert and lung material12) and SD is 20 HU (upper limit suggested by the QIBA13) (B) Three-dimensional plot that shows the histogram overlap for each combination of SD and µ–µ distance. The crosshair marks the case of the A part. SD, standard deviation; HU, Hounsfield unit; QIBA, quantitative imagingbiomarker alliance.
Graphical user interfaces
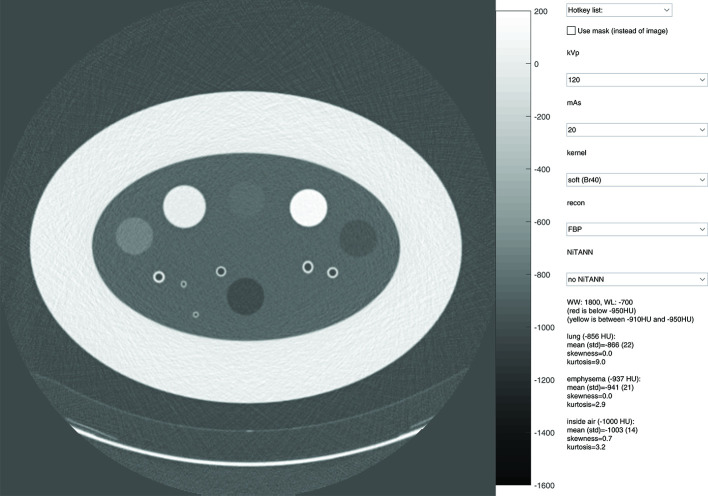
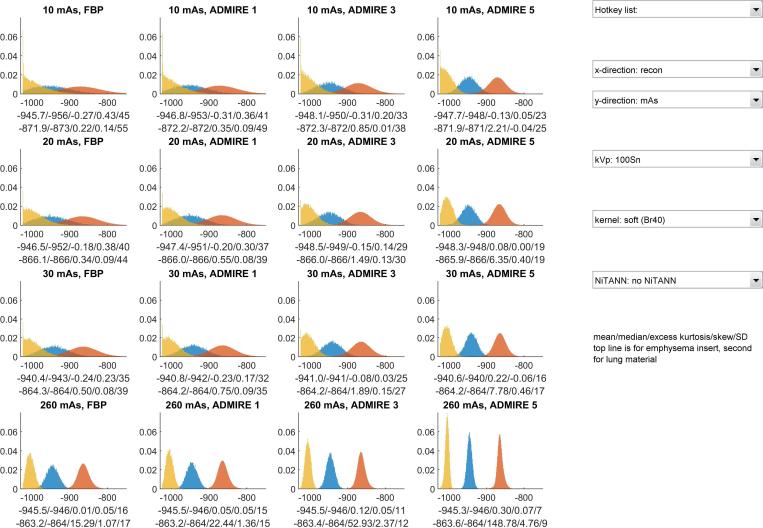
Two graphical user interfaces (GUIs) were developed to provide more intuitive insight into the effects of the chosen parameters. These tools were used to visually compare scans, and to assess the effect of each parameter on the density distributions. Screenshots of these tools are shown in Figures 4 and 5. Interactive versions are available as supplementary material.
Figure 4.
Layout of the user interface used to assess the visual differences caused by changing acquisition parameters and post-filtering parameters. The top drop-down menu can be used to change several parameters at once. The check box can be used to switch between normal view and mask view. In the mask view, voxels with a density below −950 HU are marked red, and all voxels with a density between −910 and −950 HU are marked yellow. The window level setting is adjusted by dragging, and the setting is shown in the text area. HU, Hounsfield unit.
Figure 5.
Lay out of the user interface used to view the histogram characteristics. The "x-direction" drop-down menu controls which parameter is varied between columns, the "y-direction" drop-down menu controls which parameter is varied between rows. The colours of each histogram correspond to the material: yellow is for the air inside the phantom, blue is for the emphysema insert, orange is for the lung material. The shown histograms are normalized, meaning that their total area is 1.
Data analysis
Data processing and characterization were performed with MATLAB R2018b.16 A labeled mask was generated to enable consistent CT density analysis. To create the mask, the water in the bottle, the emphysema insert and the inside air from the phantom were segmented. The mask was based on the physical dimensions reported in the manual,17 and was created from the scan with highest dose in combination with highest IR setting. To avoid partial volume effects, the edges of each volume of interest (VOI) were discarded. This was done using a morphological erosion with a spherical structuring element with a radius of two voxels. The eroded cylindrical VOIs had a diameter of approximately 27 mm.
The radiation dose was correlated to the overlap percentage using an exponential function. The exponential function was fit to the dose-overlap data by fitting a linear function to the dose against the logarithm of overlap. This function was then intersected with the 4.3% threshold (based on the previously mentioned simulation) to determine the minimally required dose to reach the QIBA recommendations. For an example, see Figure 6.
Figure 6.
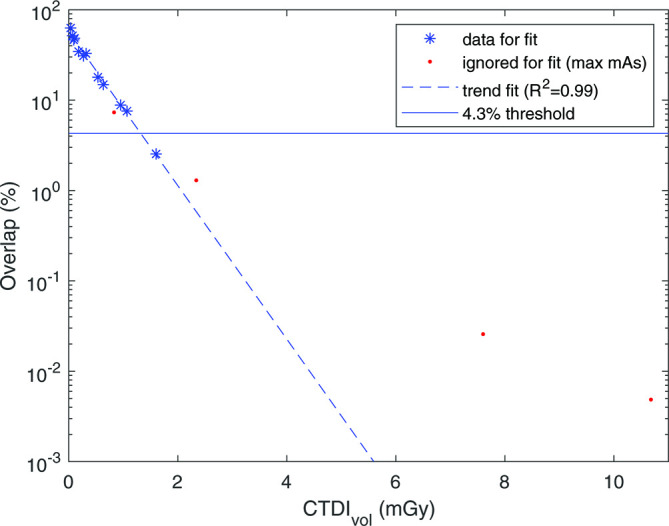
Percentage of overlap between the CT density histograms of lung material and emphysema insert plotted against the CTDIvol (for this example, data from the Br40, FBP, no NiTANN scan was used). Maximum mAs setting for each kV was ignored for the fit. Fit parameters and R2 were calculated with the log of the overlap. CTDIvol, volumetric CT dose index; FBP, filtered backprojection; NiTANN, non-iterative technique artificial neural network.
The image noise was defined as the SD of the HU values within each material.
Results
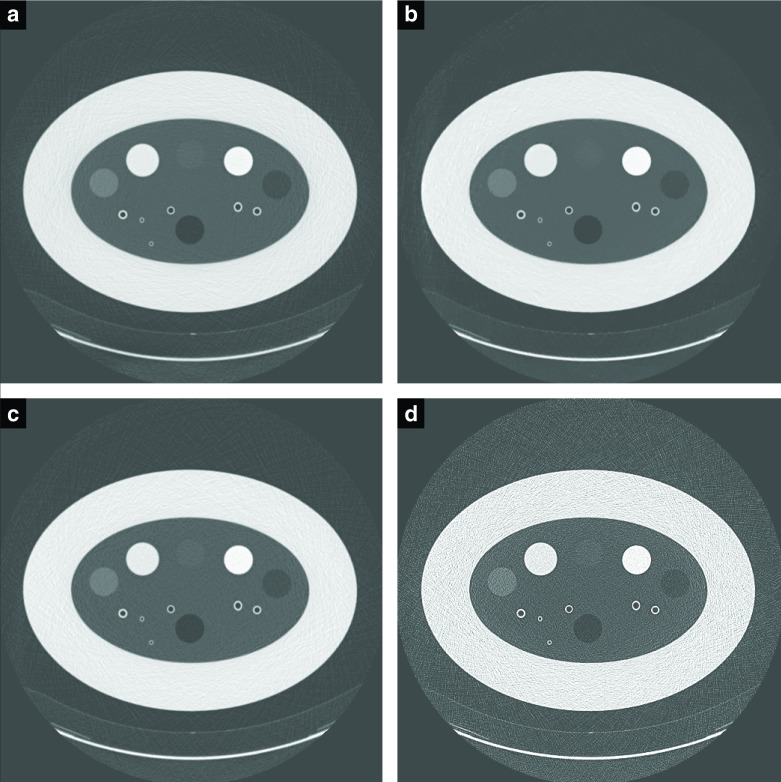
An overview of the normalized histogram data of CT density is available in the GUIs, which are available on http://tiny.cc/QUykRbrc (usage instructions included). From the histogram GUI it becomes clear that a softer kernel resulted in much less overlap for the same dose, while visual inspection with the other GUI showed an image with more noise for hard kernels. Four example slices can be found in Figure 7.
Figure 7.
Example slices for different settings (shown at WW:1800 WL:−700). (a) is an 86% lower dose than (b), with ADMIRE three and NiTANN to reduce noise. (c) is 120 kVp,20 mAs with a soft kernel, (d) is with a hard kernel. ADMIRE, ADvanced Model Iterative REconstruction; NiTANN, non-iterative technique artificial neural network; WL, window level; WW, window width.
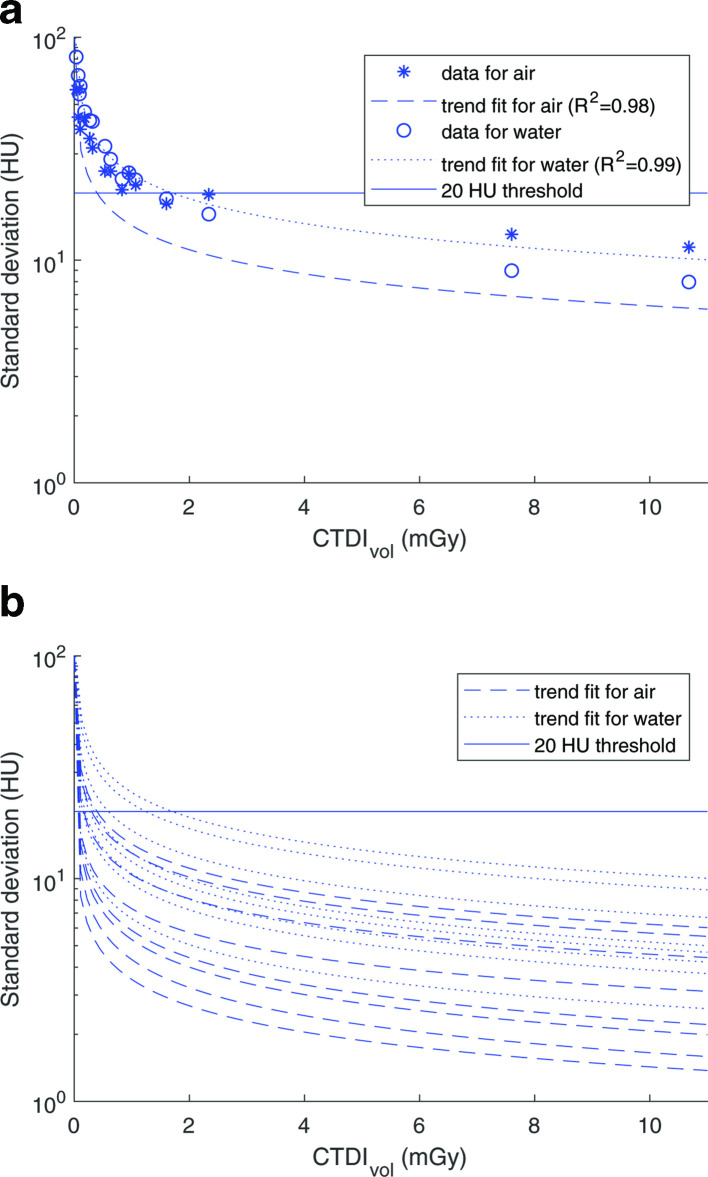
The kVp had a small effect on the HU values: approximately 0.5% for the described levels (Figure 8). This means that mAs and kV can be considered together to determine the dose effects. Decreasing the dose exponentially increased the measured SD (Figure 9). A decrease in dose from 10 to 8 mGy resulted in only a minor change in SD, while a decrease from 2.5 to 0.5 mGy resulted in a tripling of the SD. All combinations of kernel, IR and NiTANN settings showed a similar trend as shown in Figure 9B.
Figure 8.
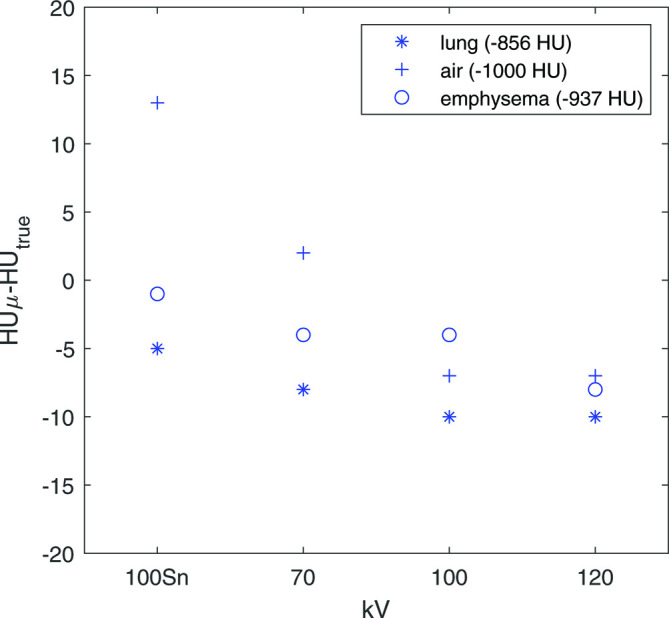
Difference between median HU of each insert and true value (see Newell et al12), points shown here are from the 30 mAs scans. To prevent mixing of effects in this example, no ADMIRE or NiTANN data was used. HU, Hounsfield unit; FBP, filteredbackprojection; ADMIRE, ADvanced Model Iterative Reconstruction; NiTANN, non-iterative technique artificial neural network.
Figure 9.
(A) Measured standard deviation of air and water plotted against CTDIvol (data used as example: Br40, FBP, no NiTANN). The threshold is 20 HU (QIBA threshold for air and water inserts13). (B) All trend lines for soft kernel (different ADMIRE levels and with/without NiTANN). R2 values of the fits range: 0.96–0.99 (median 0.98). ADMIRE, ADvanced Model IterativeREconstruction; CTDIvol, Computer TomographyDose Index (volumetric); FBP, filtered backprojection; HU, Hounsfield Unit; NiTANN, non-iterative technique artificial neural network; QIBA, quantitativeimaging biomarkers alliance.
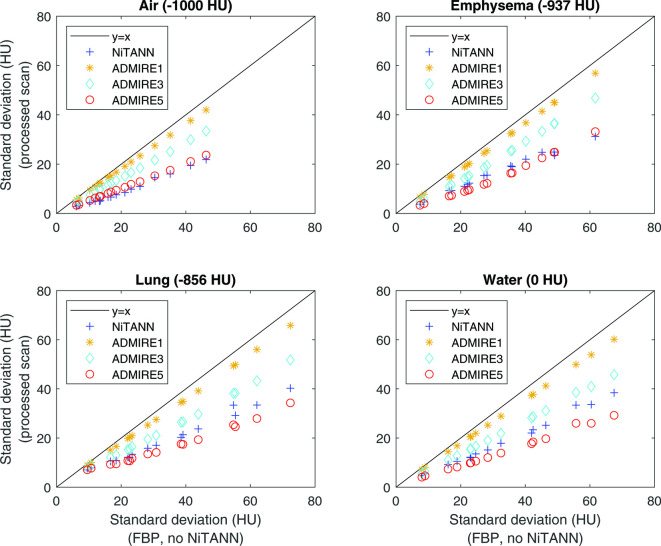
ADMIRE and NiTANN decreased the image noise (Figure 10). The relative decrease for ADMIRE was approximately the same for air, emphysema and water inserts, while the reduction in SD by NiTANN was more profound for air and emphysema, thus for the very low density inserts. For the air insert, NiTANN had approximately the same effect on image noise as ADMIRE 5, while for the lung and water inserts the effect was in-between ADMIRE 3 and 5. Neither ADMIRE or NiTANN caused a substantial shift in median HU.
Figure 10.
Effect of ADMIRE and NiTANN on SD of the density distribution of air insert (upper left), emphysema material (upper right), lung material (lower left) and water (lower right). Only soft kernel scans were used for these plots; hard kernels showed similar results, but with a wider range of SD values. The black line shows the equality line, so SD values to the right of the line are lower in the processed scan than in the unprocessed scan. ADMIRE, ADvanced Model Iterative Reconstruction; NiTANN, non-iterative technique artificial neural network; SD, standard deviation.
The correlation between dose and overlap percentage is shown in Figure 6. An exponential function was fitted to the data and then intersected with the horizontal line. This horizontal line denotes an overlap of 4.3%, which is the maximum overlap allowed when conforming to the QIBA profile. The dose that is required for acceptable imaging to be able to have no more than 4.3% overlap in CT density histograms between emphysema material and lung-like material, is shown in Table 2 for all combinations of ADMIRE and NiTANN. The tabulated values are the values found for the intersection of the trend line and the threshold in Figure 6. Each value is based on 12 scans (4 kV levels and 3 mAs levels, as the maximum mAs was ignored for the trend line fit). This table shows that ADMIRE and NiTANN both allow a substantial reduction in the minimal dose required to conform to the quality standard suggested by the QIBA profile.
Table 2.
CTDIvol in mGy required to comply with the QIBA profile,13 meaning that the expected SD is at most 20 HU. This should allow differentiating healthy from emphysematous lung tissue.
| No NiTANN | NiTANN | |
|---|---|---|
| FBP | 1.32 | 0.48 |
| ADMIRE 1 | 1.07 | 0.39 |
| ADMIRE 3 | 0.66 | 0.19 |
| ADMIRE 5 | 0.25 | ≤0.07 |
ADMIRE, ADvanced Model Iterative REconstruction; CTDIvol, Computer Tomography Dose Index (volumetric); FBP, filtered backprojection; HU, Hounsfield unit; NiTANN, non-iterative technique artificial neural network; QIBA, Quantitative Imaging Biomarkers Alliance; SD, standard deviation.
Discussion
The aim of this phantom study was to study the effect of scan parameters and noise suppression techniques on the minimum radiation dose that results in reconstructed images that are suitable for CT emphysema densitometry.
This study showed that decreasing CT dose increases histogram overlap, which could be mitigated by using (higher levels of) IR and/or NiTANN. The use of moderate level IR (e.g. ADMIRE 3) allowed 50% reduction in dose without loss of power to differentiate between emphysematous and lung-like material in this phantom study. The use of NiTANN allowed at least 64% dose reduction compared to the standard FBP reconstruction. It is important to note that these results are only applicable for emphysema densitometry. For other evaluations and applications such as measurement of bronchopathy, lung nodules, or coronary calcium, this low dose might result in inadequate images.
A commonly used method of quantifying pulmonary emphysema on CT relies on the assumption that emphysematous tissue has a CT density below −950 HU. So, to quantify for emphysema, the amount of tissue with CT density below this threshold is calculated. However, the emphysema insert in the COPDGene phantom has a homogeneous density above −950 HU, so this thresholding method cannot be used to calculate sensitivity and specificity. Based on the requirements suggested in the QIBA profile draft,13 the overlap percentage was used as a proxy for emphysema densitometry performance, as described in the methods section.
In this study, different scan parameters and reconstruction possibilities were studied with regards to potentially reduce CT dose while maintaining discernibility between normal and emphysematous lung-like materials.
The small shift caused by changing kVp will generally have little effect, but it is important to keep in mind when comparing quantifications based on scans with slightly different scan parameters. Adding the Sn filter for 100 kV approximately lowers the dose by a factor of 10, while lowering the kV to 70 results in an approximate dose reduction by a factor of 3. The mAs has a linear effect on the dose, but the kV does not.
Hard kernels are generally not recommended for emphysema quantification, due to a flat density distribution.18 This means that a single material density will result in a wide spread of HU values. With high emphysema thresholds (–900/–890 HU), hard kernels yield the same results as soft kernels, but this is not the case for more usual thresholds such as −950 HU.19 Using a high threshold would then seem a good solution for making the quantification method more robust, however, choosing a high threshold will result in more healthy tissue being marked as emphysema, reducing the specificity. Therefore, we propose a low threshold (like −950 HU) with a soft kernel (like Br40) for emphysema densitometry.
The effect of iterative reconstruction on emphysema quantification has been extensively studied. A frequent conclusion is that IR reduces the measured emphysema index compared to FBP. This is thought to be especially true for low dose CT, although this difference was not always statistically significant.7,20–24 Lower radiation dose leads to higher emphysema index values and higher SD, which can be mitigated with iterative reconstruction.18,21,24
Our results suggest that applying NiTANN to a CT scan may increase its quality substantially. Very little is known about the effects of PixelShine on CT. Cross et al25 performed a study in which 10 CT images were sent to radiologists in a survey (five low-dose, five low-dose with PixelShine). 75% of the respondents classified the processed images as being acquired with a standard dose protocol.25 This suggests that NiTANN has a large potential for allowing dose reduction without adversely affecting the visual quality. Although it was partially trained with phantom data, PixelShine is intended for the processing of human CT data, and it is therefore unknown whether the effects in our phantom study are comparable to the effects in human data. When indeed any difference is found, it is to be expected that PixelShine will perform better on human data than on phantom data, meaning that an even larger dose reduction might be possible. Recently, the use of PixelShine was shown in pelvic CT in 33 patients.15 In that study, the use of NiTANN lowered the image noise by 30% and increased the signal to noise ratio by 58%.
ADMIRE and the NiTANN provide the potential for substantial dose reduction, down to the dose level of a two-direction chest radiograph. This finding agrees with De Margerie-Mellon et al, who compared a standard-of-care CT to a reduced dose protocol with different types of IR.26 It should be noted their study shares the potential dose underestimation because of low body weight study participants.
One of the strengths of this study is the standardized analysis of several CT parameters influencing the quantification of emphysema. This makes it easier to compare the newly tested NiTANN with more common methods of influencing image noise. Furthermore, the use of the graphical user interface did not result in numerical outcomes, but did substantially contribute to the understanding of the effect each parameter has on visual image quality and on the CT density distributions of each insert. A weakness of this study is that the phantom does not mimic a typical western body habitus. This likely results in underestimation of the minimum required dose. It is worth noting that QIBA proposes the use of a slightly different phantom than the one used in this paper, although this is not expected to have a substantial effect as the materials and shape are very similar.
This study describes an objective method of determining the possible dose reduction and the minimum dose required for CT densitometry in emphysema estimation. This is especially important for the clinical implementation of a low dose chest CT screening program, which has been introduced for lung cancer in the USA, and is under consideration for lung cancer in Europe.6 Lung cancer screening provides the opportunity to simultaneously evaluate the presence and extent of emphysema, which gives additional information about prognosis. Based on the requirements described in the QIBA profile draft,13 our study suggests that modern CT systems with new iterative reconstruction techniques can yield images that are acceptable for quantitative emphysema evaluation with substantially lower dose than normal dose levels. The presented results are very promising for densitometry-based automated analysis of lung parenchyma on low dose CT, but the assessment of emphysema and other thoracic diseases do not solely depend on densitometry. High levels of denoising may potentially remove structural information, which could make the scan quality insufficient for reading by a radiologist. Structural information is also very important for correct segmentation of the blood vessels and airways, which may also be quantified. Future research should focus on assessing what level of denoising yields acceptable images in human CT scanning.
Conclusion
The aim of this phantom study was to investigate the effect of scan parameters and noise suppression techniques on the minimum radiation dose that results in reconstructed images that are suitable for CT emphysema densitometry. Reducing the dose reduced discernibility of emphysema and healthy lung tissue.
A soft reconstruction kernel yielded markedly better results than harder kernels.
ADMIRE reduced image noise. Using NiTANN and/or ADMIRE substantially decreased the dose required to obtain low dose CT that can differentiate between emphysematous and normal lung tissue.
Contributor Information
Hendrik Joost Wisselink, Email: h.j.wisselink@umcg.nl, h.j.wisselink@alumnus.utwente.nl.
Gert Jan Pelgrim, Email: g.j.pelgrim@umcg.nl.
Mieneke Rook, Email: m.rook@umcg.nl.
Maarten van den Berge, Email: m.van.den.berge@umcg.nl.
Kees Slump, Email: c.h.slump@utwente.nl.
Yeshu Nagaraj, Email: y.nagaraj@umcg.nl.
Peter van Ooijen, Email: p.m.a.van.ooijen@umcg.nl.
Matthijs Oudkerk, Email: m.oudkerk@umcg.nl.
Rozemarijn Vliegenthart, Email: r.vliegenthart@umcg.nl.
REFERENCES
- 1.Moran AE, Forouzanfar MH, Roth GA, Mensah GA, Ezzati M, Murray CJL, et al. . Temporal trends in ischemic heart disease mortality in 21 world regions, 1980 to 2010: the global burden of disease 2010 study. Circulation 2014; 129: 1483–92. doi: 10.1161/CIRCULATIONAHA.113.004042 [DOI] [PMC free article] [PubMed] [Google Scholar]
- 2.Torre LA, Bray F, Siegel RL, Ferlay J, Lortet-Tieulent J, Jemal A. Global cancer statistics, 2012. CA Cancer J Clin 2015; 65: 87–108. doi: 10.3322/caac.21262 [DOI] [PubMed] [Google Scholar]
- 3.Burney PGJ, Patel J, Newson R, Minelli C, Naghavi M. Global and regional trends in COPD mortality, 1990-2010. Eur Respir J 2015; 45: 1239–47. doi: 10.1183/09031936.00142414 [DOI] [PMC free article] [PubMed] [Google Scholar]
- 4.Stone IS, Barnes NC, Petersen SE. Chronic obstructive pulmonary disease: a modifiable risk factor for cardiovascular disease? Heart 2012; 98: 1055–62. doi: 10.1136/heartjnl-2012-301759 [DOI] [PubMed] [Google Scholar]
- 5.Aberle DR, Adams AM, Berg CD, Black WC, Clapp JD, Fagerstrom RM, et al. . Reduced lung-cancer mortality with low-dose computed tomographic screening. N Engl J Med 2011; 365: 395–409. doi: 10.1056/NEJMoa1102873 [DOI] [PMC free article] [PubMed] [Google Scholar]
- 6.Oudkerk M, Devaraj A, Vliegenthart R, Henzler T, Prosch H, Heussel CP, et al. . European position statement on lung cancer screening. Lancet Oncol 2017; 18: e754–66. doi: 10.1016/S1470-2045(17)30861-6 [DOI] [PubMed] [Google Scholar]
- 7.Messerli M, Ottilinger T, Warschkow R, Leschka S, Alkadhi H, Wildermuth S, et al. . Emphysema quantification and lung volumetry in chest X-ray equivalent ultralow dose CT - Intra-individual comparison with standard dose CT. Eur J Radiol 2017; 91: 1–9. doi: 10.1016/j.ejrad.2017.03.003 [DOI] [PubMed] [Google Scholar]
- 8.Oelsner EC, Carr JJ, Enright PL, Hoffman EA, Folsom AR, Kawut SM, et al. . Per cent emphysema is associated with respiratory and lung cancer mortality in the general population: a cohort study. Thorax 2016; 71: 624–32. doi: 10.1136/thoraxjnl-2015-207822 [DOI] [PMC free article] [PubMed] [Google Scholar]
- 9.Lynch DA, Moore CM, Wilson C, Nevrekar D, Jennermann T, Humphries SM, et al. . Ct-Based visual classification of emphysema: association with mortality in the COPDGene study. Radiology 2018; 288: 859–66. doi: 10.1148/radiol.2018172294 [DOI] [PMC free article] [PubMed] [Google Scholar]
- 10.Koyama H, Ohno Y, Yamazaki Y, Nogami M, Murase K, Onishi Y, et al. . Quantitative and qualitative assessments of lung destruction and pulmonary functional loss from reduced-dose thin-section CT in pulmonary emphysema patients. Acad Radiol 2010; 17: 163–8. doi: 10.1016/j.acra.2009.08.009 [DOI] [PubMed] [Google Scholar]
- 11.Madani A, Zanen J, de Maertelaer V, Gevenois PA. Pulmonary emphysema: objective quantification at multi-detector row CT--comparison with macroscopic and microscopic morphometry. Radiology 2006; 238: 1036–43. doi: 10.1148/radiol.2382042196 [DOI] [PubMed] [Google Scholar]
- 12.Newell JD, Fuld MK, Allmendinger T, Sieren JP, Chan K-S, Guo J, et al. . Very low-dose (0.15 mGy) chest CT protocols using the COPDGene 2 test object and a third-generation dual-source CT scanner with corresponding third-generation iterative reconstruction software. Invest Radiol 2015; 50: 40–5. doi: 10.1097/RLI.0000000000000093 [DOI] [PMC free article] [PubMed] [Google Scholar]
- 13.QIBA Lung Density Biomarker Committee Computed Tomography: Lung Densitometry [Internet]. Available from: http://web.archive.org/web/20180122144040/http://qibawiki.rsna.org/images/7/70/QIBA_CT_Lung_Density_Profile_083017-Clean.docx
- 14.U.S. Food and Drug Administration FDA clearance PixelShine [Internet]. 2016. Available from: http://web.archive.org/web/20170212231946/https://www.accessdata.fda.gov/cdrh_docs/pdf16/K161625.pdf
- 15.Tian S-F, Liu A-L, Liu J-H, Liu Y-J, Pan J-D. Potential value of the PixelShine deep learning algorithm for increasing quality of 70 kVp+ASiR-V reconstruction pelvic arterial phase CT images. Jpn J Radiol 2019; 37: 186–90. doi: 10.1007/s11604-018-0798-0 [DOI] [PubMed] [Google Scholar]
- 16.MATLAB version 9.5.0.944444 (R2018b). 2018. Natick, Massachusetts: The Mathworks, Inc.. [Google Scholar]
- 17.CTP698 and CCT162 Lung Phantom II Manual [Internet]. Available from: http://web.archive.org/web/20171212092220/https://static1.squarespace.com/static/5367b059e4b05a1adcd295c2/t/5636b3d6e4b0507883462a67/1446425558230/CTP698+%26+CCT162+Lung+Phan+Manual+Nov14.pdf
- 18.Rodriguez A, Ranallo FN, Judy PF, Fain SB. The effects of iterative reconstruction and kernel selection on quantitative computed tomography measures of lung density. Med Phys 2017; 44: 2267–80. doi: 10.1002/mp.12255 [DOI] [PMC free article] [PubMed] [Google Scholar]
- 19.Gierada DS, Bierhals AJ, Choong CK, Bartel ST, Ritter JH, Das NA, et al. . Effects of CT section thickness and reconstruction kernel on emphysema quantification relationship to the magnitude of the CT emphysema index. Acad Radiol 2010; 17: 146–56. doi: 10.1016/j.acra.2009.08.007 [DOI] [PMC free article] [PubMed] [Google Scholar]
- 20.Martin SP, Gariani J, Hachulla A-L, Botsikas D, Adler D, Karenovics W, et al. . Impact of iterative reconstructions on objective and subjective emphysema assessment with computed tomography: a prospective study. Eur Radiol 2017; 27: 2950–6. doi: 10.1007/s00330-016-4641-7 [DOI] [PubMed] [Google Scholar]
- 21.Yamashiro T, Miyara T, Honda O, Tomiyama N, Ohno Y, Noma S, et al. . Iterative reconstruction for quantitative computed tomography analysis of emphysema: consistent results using different tube currents. Int J Chron Obstruct Pulmon Dis 2015; 10: 321. doi: 10.2147/COPD.S74810 [DOI] [PMC free article] [PubMed] [Google Scholar]
- 22.Mets OM, Willemink MJ, de Kort FPL, Mol CP, Leiner T, Oudkerk M, et al. . The effect of iterative reconstruction on computed tomography assessment of emphysema, air trapping and airway dimensions. Eur Radiol 2012; 22: 2103–9. doi: 10.1007/s00330-012-2489-z [DOI] [PMC free article] [PubMed] [Google Scholar]
- 23.Nishio M, Matsumoto S, Ohno Y, Sugihara N, Inokawa H, Yoshikawa T, et al. . Emphysema quantification by low-dose CT: potential impact of adaptive iterative dose reduction using 3D processing. AJR Am J Roentgenol 2012; 199: 595–601. doi: 10.2214/AJR.11.8174 [DOI] [PubMed] [Google Scholar]
- 24.Nishio M, Koyama H, Ohno Y, Negi N, Seki S, Yoshikawa T, et al. . Emphysema quantification using ultralow-dose CT with iterative reconstruction and filtered back projection. AJR Am J Roentgenol 2016; 206: 1184–92. doi: 10.2214/AJR.15.15684 [DOI] [PubMed] [Google Scholar]
- 25.Cross NM, DeBerry J, Ortiz D, Kemp J, Morey J. Diagnostic Quality of Machine Learning Algorithm for Optimization of Low-Dose Computed Tomography Data In: SIIM 2017 Scientific Session Posters & Demonstrations; 2017. [Google Scholar]
- 26.de Margerie-Mellon C, de Bazelaire C, Montlahuc C, Lambert J, Martineau A, Coulon P, et al. . Reducing radiation dose at chest CT: comparison among model-based type iterative reconstruction, hybrid iterative reconstruction, and filtered back projection. Acad Radiol 2016; 23: 1246–54. doi: 10.1016/j.acra.2016.05.019 [DOI] [PubMed] [Google Scholar]


