

Abstract
This study presented a qualitative and quantitative project risk assessment using a hybrid PMBOK model developed under uncertainty conditions. Accordingly, an exploratory and applied research design was employed in this study. The research sample included 15 experienced staff working in main and related positions in Neyr Perse Company. After reviewing the literature and the Project Management Body of Knowledge (PMBOK), 32 risk factors were identified and their number reduced to 17 risks using the expert opinions via the fuzzy Delphi technique run through three stages. The results of the confirmatory factor analysis showed that all risks were confirmed by the members of the research sample. Then the identified risks were structured and ranked using fuzzy DEMATEL and fuzzy ANP techniques. The final results of the study showed that the political and economic sanctions had the highest weight followed by foreign investors' attraction and the lack of regional infrastructure.
Keywords: Project risks, Project management body of knowledge (PMBOK), Uncertainty, Mixed qualitative and quantitative risk assessment approach, Mathematics, Probability theory, Engineering, Industrial engineering, Business
Project risks; Project management body of knowledge (PMBOK); Uncertainty; Mixed qualitative and quantitative risk assessment approach; Mathematics; Probability theory; Engineering; Industrial engineering; Business
1. Introduction
It can be stated with certainty that uncertainty exists in all projects, and appropriate methods should be employed to deal with this uncertainty and reduce its impact on managers' decision making [1]. One way to reduce uncertainty and counteract it is to use the fuzzy set theory, which can reflect somehow the ambiguity inherent in the problem under analysis, and present results that are closer to reality [2]. There are many risks in oil projects which can cause many problems if there is no required control and planning [3]. Considering the great importance of such projects and the vital impact of oil on various aspects of the life of Iranian people, it is necessary to conduct extensive studies to increase the reliability of planning. Risk management as one of the most important branches of management science, especially project management, aims to increase reliability. Accordingly, several methods have been devised and proposed. Fuzzy set theory and fuzzy logic as modern concepts will be able to play a major role in risk management f they are combined with management science. Construction projects constitute the greatest and most important projects in the oil industry, and they naturally are replete with small and big risks that can be dealt with through accurate planning [4].
The oil and gas industry is the most important industry in terms of financial turnover and employment. Given the degree of development in the industry which depends on oil and its derivatives, new projects are initiated every day. Therefore, the number of projects in the oil and gas sector is very high. Considering the financial tunover of oil projects, the management of these projects is very important [4]. On the other hand, these projects are also at high risk which can be attributed to the high risky nature of gas and oil and the flammability and hazardous nature of their derivatives, which are often the cause of accidents in exploration and exploitation projects. For this reason, reducing the risks associated with oil projects, especially in exploration and exploitation projects, is very important [5]. Gas and oil projects are associated with a variety of risks in the present era. Therefore, the management of project risks is critical to the survival of these projects. Risk management is one of the phases of project management and project risk ranking is a key part of the risk assessment phase in the process of project risk management. Also, according to experts and practitioners of oil industry projects, the probable impact of risks affect project objectives such as cost, time, scope and quality of the project [3]. The PMBOK standard identifies risk management at various steps and provides control programs to reduce the severity of risks. These steps are stated as follows:
-
1.
Risk management planning
-
2.
Risk identification
-
3.
Quantitative risk analysis
-
4.
Qualitative risk analysis
-
5.
Risk response planning
-
6.
Risk monitoring and control [2]
An important point in risk assessment and assessment is uncertainty. Uncertainty in estimating the time and cost of industrial projects is considered as a major challenge in project management science. Accordingly, one of the most effective solutions to solve this problem is risk analysis. In fact, risk management is the systematic use of management policies, procedures, and processes related to risk analysis, assessment, and control activities. Therefore, prior to initiating the project, the project risks must be identified and quantified, and ultimately an appropriate strategy taken to prevent their occurrence or mitigate their effects [6]. Two issues are critical in implementing the risk management process. First, the critical risks that have a great impact on the time and cost of the project are identified, because the analysis of all risks in a project is time-consuming and not effective. Second, after identifying critical risks and analyzing them, responding to the risks is essential, because the risk management is effective only in cases where the effects of risk are eliminated or mitigated with precise and predetermined planning as soon as the risk occurs. To this end, the use of a method that can perform quantitative analysis at a higher speed and reduce uncertainty in the decision-making context can be effective. Therefore, the present study focuses on the use of statistical and multi-criteria decision making methods and fuzzy techniques which are used to structure and prioritize the risks of oil projects in the exploration and exploitation phases. The risks inherent in oil projects due to the great number of these projects can have a negative impact on the project quality, time, and cost, and their management can greatly hinder the occurrence of risk-associated accidents. Thus, given the presence of European countries such as France for collaborating on oil projects after the Joint Comprehensive Plan of Action (JCPOA), it seems that focusing on risk management and mitigating their effects is one of the requirements that contracting companies need to pursue engineering, procurement, and construction (EPC) projects. This kind of risk mitigation will also lead to the increased trust of foreign companies and lower their costs. The review of databases showed that, despite the importance of risk assessment and analysis in oil exploration projects, mixed methods have not been employed for risk analysis and evaluation. Therefore, the present study seeks to use mixed methods including fuzzy Delphi, factor analysis, and DEMATEL, and Fuzzy ANP techniques to propose an executive and operational framework for risk analysis that minimizes the risks of exploration projects. Thus, the main questions addressed in this study are stated as follows:
-
1.
What risks exist in oil exploration and exploitation phase projects based on the PMBOK classification?
-
2.
How do these risks affect and how they are affected?
-
3.
What is the significance of each project risk?
2. Literature review
2.1. Concepts and theories
2.1.1. Definition of the project and the importance of its management
Considering the rapid development of industries in the country and the gradual increase of new industrial, construction, and development projects, correct project planning, and management is essential in these industrial sectors. Overall, a project can be defined as a series of complex, non-repetitive, and interrelated operations that are implemented by the management or an administrative organization to meet certain goals within a predetermined schedule and budget framework: Project management is a process in which the project will achieve the desired outcome during its lifetime through the easiest and most cost-effective way. The project management process consists of three main components: planning, implementation, and supervision [4].
2.1.2. Project planning and control system
The success of major industrial and construction projects is dependent on a systematic approach to planning and controlling the way activities are carried out in terms of the execution time and cost. The main function of the project planning and control system is preparing, compiling, recording, and keeping the information related to different stages of the project lifecycle and also processing, classifying, and analyzing the information, and preparing the necessary reports for the project manager. The purpose of this system is to direct the project according to the determined schedule and budget, and to provide the final objectives and products of the project and to store the resulting information for use in future projects. This system should assist the project manager in optimizing the three factors of time, cost, and quality in project implementation. A good project planning and control system should have the following capabilities and features [7]:
-
1.
Determining the completion date of the project at the planning and initial scheduling stage
-
2.
Determining the work breakdown structure (WBS) for proper implementation and non-interference of activities and their resources
-
3.
Providing cost-effective solutions to compensate for delays in executing some project activities at the execution time
-
4.
Delivering cost-effective solutions to expedite project implementation in case of changes in the economic and social conditions of the country or the project-generating organization and changes in the project priorities and the need for its faster implementation
-
5.
Scheduling and planning for the use of human resources, machinery and equipment, and, in general, reusing the resources for optimum use of them and avoiding possible bottlenecks and limitations
-
6.
Determining the distribution of materials and, in general, non-reuse resources between projects and their various activities
-
7.
Scheduling purchase orders for materials, materials, machines, and equipment to reduce storage and waste costs as well as losses caused by stagnant project finance.
-
8.
Determine the amount of the project's liquidity per time unit for timely payment of bills and prepayments
-
9.
Recording and analyzing the results when necessary to change the project planning and maintenance for use in future projects and prevent similar problems [7]).
2.1.3. Project planning and control stages
1. Planning stage Project planning includes tasks that are done to identify project activities and their interrelationships, and estimate the time, resources, and cost of implementing them based on criteria in the project-generating organization. The various project planning stages can be divided into the following categories: Step 1: Project analysis, understanding activities and their interrelationships, preparing the work breakdown structure (WBS)
-
1.
Determining the project implementation phase based on the implantation organization of its activities and determining the major activities of each project phase, i.e. dividing the project to its sub-projects
-
2.
Breaking down each sub-project into its components and determining all project activities based on how they are implemented
-
3.
Designing the work breakdown structure (WBS) using a systematic and top-down approach, which according to the type, organization, and scope of the project can affect the project implementation phases, major project activities, final product, and its components, units contributing to the implementation of the project or a combination of them
-
4.
Determining all project milestones to facilitate subsequent controls and emphasize the completion of some vital activities at a given time
-
5.
Identifying and defining the order of activities in an accurate and realistic way [8].
Step 2: Estimating the time, resources, and cost of implementing each project activity
-
1.
Estimating the duration of implementation of any of the activities identified in the first step according to the opinions of executive experts and prior experience in the implementation of similar projects
-
2.
Plotting the project network using the critical path method (CRM) and utilizing professional software programs for project planning and control
-
3.
Estimating human resources, equipment, and machinery required for implementing each project activity
-
4.
Estimating the materials needed to implement the project
-
5.
Identifying existing and available resources and their applicability
-
6.
Estimating the cost of each activity with respect to their fixed and variable costs
-
7.
Analyzing the project costs and comparison of the results with the budget determined for project implementation by the project-generating organization [8].
Step 3: Project scheduling, resource planning, cost-time trade-off analysis, and reviewing possible problems
-
1.
Analyzing the network time, determining the critical path, and identifying activities that are less floating (critical activities)
-
2.
Allocating available resources to project activities based on the existing resource constraints
-
3.
Analyzing the project resources and changing the initial scheduling due to existing resource constraints
-
4.
Leveling resources if necessary and changing the initial scheduling according to the leveled resources
-
5.
Analyzing cost-time trade-off and project scheduling with minimal cost using the existing and new methods presented in this field
-
6.
Reviewing inappropriate atmospheric conditions and other predictable problems affecting the implementation and timing of project activities [8].
2.1.4. Risk management
Chapman and Ward have proposed a general project risk management process consisting of nine phases: 1) Identifying key aspects of the project; 2) Focusing on a strategic approach to risk management; 3) Identifying the time of occurrence of risks; 4) Estimating risks and the interrelationship; 5) Allocating ownership of risks and providing appropriate responses; 6) Estimating uncertainty; 7) Estimating the importance of the relationship between different risks; 8) Designing responses and monitoring the risk situation; and 9) Controlling the implementation stages [4].
In order to achieve tangible development, developing countries are forced to increase investment in infrastructure, which, apart from meeting basic needs, has a positive impact on accelerating economic development [9] [10]. Although developing countries such as Iran faces some limitations and uncertainties when moving toward this goal, they have to engage in domestic and foreign private sectors in projects or infrastructural services in order to overcome or reduce such uncertainties. Growing development in a country like Iran requires a large amount of investment in the infrastructural sector [11]. Therefore, due to the uncertain nature of projects and the need for the optimal utilization of resources, each project faces uncertainties. The belief that projects are fraught with uncertainties, such as technical skills or management quality reinforces the fact that many projects fail in terms of their goals, benefits, costs, and the expected time. The existence of risk and uncertainty in the project reduces the accuracy in the proper estimation of the goals and reduces the efficiency of the projects. Therefore, the need for project risk identification and management is essential [12]. Considering the importance of the science of project management in recent years, various standards have proposed in this regard. These standards include the basic principles and requirements that are considered necessary for the successful management of a project or the implementation of a project management system. Some of the famous standard project management standards are presented in Table 1.
Table 1.
Famous project management standards [4].
| Row | Standard | Scope of Application |
|---|---|---|
| 1 | PMBOK | Global |
| 2 | ISO 10006 | Global |
| 3 | Professional Methodologies | Global |
| 4 | PRINCE 2 | Semi-global |
| 5 | BS 6079 | National |
| 6 | DIN 69900 | National |
| 7 | AIPM | National |
| 8 | APMBOK | Regional |
| 9 | IPMA Competence Base Line | Regional |
The most famous and extensive standard among the above standards is the Project Management Body of Knowledge (PMBOK). This standard covers nine areas of knowledge for successful project management. Of these areas, project scope management, project time management, project cost management, and project quality management are considered as the main areas. One of the most important support areas is risk management [8]. Risk management is the process of identifying, analyzing, evaluating, and responding to the risks in the project [13]. The Project Management Body of Knowledge is a set of words, guidelines, and instructions for project management developed and proposed the Project Management Institute. This body of knowledge has evolved over time in the form of a book entitled “A Guide to the Project Management Body of Knowledge”. The fifth edition of this guide was released in 2013. The Project Management Body of Knowledge (PMBOK) also overlaps with the concept of management in its overall sense because both involve concepts such as planning, organizing, human resources, implementing, and controlling organizational operations. The Project Management Body of Knowledge (PMBOK) has similarity and overlap in other management disciplines, such as financial predictions, organizational behavior, management science, budgeting, and other planning approaches [2].
The purpose of project risk management is to identify and analyze risks in a manner that the risks are understood easier and managed more effectively [14]. A systematic risk management process is usually divided into three categories:
-
1.
Risk identification and classification
-
2.
Risk analysis
-
3.
Risk mitigation [14].
2.1.5. Project risk management
Project risk management is one of the main project issues [20] and is considered a key factor in most of the organizations involving in the project [21]. Risk management is the systematic process of identifying, analyzing, and responding to project management, which involves maximizing the probability of occurrence of positive events and their outcomes and minimizing the risk of adverse events and their outcomes [22]. He proposed a two-stage process for project risk management as follows:
-
1.
Risk assessment including risk identification, analysis, and prioritization
-
2.
Risk management including risk management planning, risk precautions, follow-up, and corrective actions
Risk assessment is the process of estimating the likelihood of the occurrence of an event (desirable or undesirable) and its impact [23]. This step can help to select less risky projects and eliminate the residual risk [22]. In the first step, using one of the risk identification tools, major threats and opportunities that can affect the project processes and outcomes are identified. After identifying the main risks, the second step involves the accurate assessment of the frequency of the occurrence and the results of each risk and then ranking the various risks based on the assessment results. In this way, identified risks can be compared with each other, and in the next phases of the risk management process, an appropriate risk response method can be decided.
2.2. Previous studies
2.2.1. Domestic studies
See Table 2.
Table 2.
Summarizes the studies conducted in Iran.
| Row | Researcher(s) | Topic | Results |
|---|---|---|---|
| 1 | Olfat et al. (2010) [15] | Identification and prioritization of project risk based on the PMBOK standard with fuzzy approach (Case study: non-level crossing construction projects in Bushehr Province) | Concerning technical-qualitative-functional risks, the most important risk affecting the four main goals of the projects is the inability to produce quality concrete at the right time due to the poor quality of materials and failure of machinery. |
| 2 | Alam Tabriz & Hamzei (2011) [4] | Assessment and analysis of project risks using the mixed approach of PMBOK and RFMEA technique | The risk indicators of the Northern Azadegan oil field project were identified and ranked based on an integrated model of the risk management process. |
| 3 | Razavi Falahieh et al. (2012) [3] | Analysis of project risks using fuzzy logic in the case study of the project for the construction and operation of an oil desalination plant | Identification of cost and construction risks and prioritizing them using fuzzy logic. |
| 4 | Naderi et al. (2014) [8] | Risk identification and analysis of the fourth-generation engine project based on the PMBOK standard | Micro risks (technology) and macro risks (political, economic) were ranked with regard to their effects on the three goals of the project (cost, time, and quality). |
| 5 | Bagheri & Lotfi (2016) [16] | Proposing a model for the implementation of the risk management process in oil projects using the PMBOK standard | The results allow each organization to use the proposed model on the basis of its risk acceptance thresholds, and while clarifying the plan of the project risk management road map in the life cycle of the project, the model reduces cost and time required for risk management planning in the projects. |
| 6 | Roudashti et al. (2017) [17] | The application of EFME PHA and AHP mixed method in environmental risk assessment: Case study of the crude oil desalination plant | The pipeline piercing factor had the highest risk score of 210 and the reservoir piercing factor had the lowest risk score of 21. In addition, the output data from the EXPERT CHOICE software showed the same results. There were 2 high-risks, 7 medium-risks and 2 low-risks at the factory. |
2.2.2. Foreign studies
See Table 3.
Table 3.
Summarizes the studies conducted abroad.
| Row | Researcher(s) | Topic | Results |
|---|---|---|---|
| 1 | Taylan et al. (2014) [5] | The selection of construction projects and risk assessment using AHP and fuzzy TOPSIS | 30 construction projects were studied according to five main criteria: time, cost, quality, safety, and environmental sustainability. The results showed that these new methods are capable of evaluating the overall risks of construction projects and selecting a project with the lowest risk with a relative weight index. This approach would have potential applications in the future. |
| 2 | Dziadosz & Rejment (2015) [18] | Risk analysis in construction projects | Risk is a measurable part of uncertainty, which can be estimated from the probability of occurrence and damage. This risk is a deviation from the desired level. This deviation can be positive, or it can, as in many cases, be negative. Therefore, risk analysis is very important for selecting a project and for coordinating construction work. |
| 3 | Samantra et al. (2017) [19] | Fuzzy risk assessment in urban construction projects | The risk associated with a specific risk source is expressed as the function of two parameters: the probability of occurrence and the effect (the outcome of occurrence). The concept of risk matrix is here to categorize different risk factors at different levels of severity to create a program of necessary actions. |
| 4 | Muriana & Vizzini (2017) [2] | Project risk management: A quantitative measurement method for evaluation and adjustment | The current risk level of the project is calculated using the total weight method. If the is more than the planned level, preventive measures are taken to reduce the risk of the whole project. The application of this technique is related to common projects and cases where planning/costs/requirements are to be defined at the planning stage and deviations are identified at the development stage. |
2.3. Identified factors
The risks of exploration and exploitation projects are considered as variables and units of analysis and are initially classified using the PMBOK standard based on the following model (see Fig. 1).
Figure 1.

Risks classified based on the PMBOK standard [4]).
Also, based on studies in the literature, the following risks were identified for oil projects in the exploration and exploitation phase (see Table 4). Thus, various risks were identified based on the studies in the literature.
Table 4.
Risks identified in oil projects in the exploration and exploitation phase.
| PMBOK-based classification | Risks |
|---|---|
| Time and cost | Delay in sending the drilling rig due to delay in constructing the cellar site and the failure to construct the access roads on time. |
| Oil recovery by the neighboring country from joint oil reservoirs | |
| Limitations on supplying materials and equipment | |
| Land pollution in the project site due to explosives and mines | |
| The observance of the ecosystem of wetlands in the region | |
| The absence of the necessary infrastructure in the site for implementing industrial projects | |
| Fluctuations in the price of steel and bars | |
| Fluctuations in the price of cement | |
| Fluctuations in the price of bitumen | |
| Preventing the implementation of projects in the lands of interest by the farmers (land acquisition) | |
| Preventing the implementation of projects in the government-owned lands by the Department of Environment | |
| Banning professional consultation by foreign companies | |
| Non-cooperation of the endowment organization in exploiting endowed lands | |
| The lack of required liquidity by domestic contractors | |
| Failure to attract foreign investors to implement the project | |
| Failure to perform hazard and operability (HAZOP) studies | |
| Preventing the entrance of machinery to the site by the military authorities | |
| Human resources | The lack of skilled workers due to the deprivation of the region |
| The lack of skilled experts due to the deprivation of the region | |
| The nonexistence of various executive teams | |
| Quality | Extraction of heavy and super heavy oil from reservoir layers and light oil from field reservoir layer |
| Failure to conduct IOR And EOR studies the reservoir and preservation of reservoir layers | |
| Gas injection or gas lift implementation for correct recovery from reservoirs | |
| Failure to comply with HSE standards | |
| Contract | The failure to comply with the work schedule and working shifts in the project cycle |
| The failure of contractors and consultants to consider minus requirements in tenders and their failure to consider the project final cost and estimate profit and loss | |
| Failure to obtain guarantees from foreign contractors | |
| Scope | Failure to understand the project and activities associated with it |
| Communication | Failure to identify the executive processes of the project and establish intra-organizational communication |
| Viewing the project as a matrix | |
| Others | Economic and political sanctions |
| Insurance of goods and equipment | |
As mentioned above, there are notable researches addressing Risk Assessment. However, to the best of our knowledge, none of them considered an Fuzzy Dematel and Fuzzy ANP techniques in the risk assessment problems in oil and gas companies. This has been a motivation of the current work. More specifically, the main contributions of this paper can be described as follows:
-
1.
Qualitative and Quantitative Project Risk Assessment Using a Hybrid PMBOK Model is developed Under Uncertainty for oil and gas company.
-
2.
32 risk factors were identified using Literature and their number reduced to 17 risks using the expert opinions via the fuzzy Delphi technique run through three stages.
-
3.
The identified risks were structured and ranked using fuzzy DEMATEL and fuzzy ANP techniques
-
4.
The performance of the developed solution approaches are evaluated by running the mentioned techniques
The rest of this paper is structured as follows. Section 3 is devoted to the Methodology. Section4 represents the results and comprehensive experimental analysis comprehensive experimental analysis. Finally, conclusion of this paper is provided in Section 5.
3. Methodology
The present study is an exploratory research in terms of its objectives as it seeks to identify and evaluate the risks of exploration and exploitation projects. In addition, this study employs descriptive and analytical design as the researcher does not manipulate the variables and only describes the variables in their normal states and analyzes the collected data. This study is also a survey because it collected expert data and opinions using various questionnaires. First, this study presented a review of the literature and addressed the risks under analysis. Then, using the PMBOK standard, other risks were identified. The fuzzy Delphi method was used to confirm the related risks based on expert opinions. The results identified the relevant risks, which ones are relevant. Afterward, the fuzzy DEMATEL technique was employed to structure and investigate the network relationships among the risks. Finally, based on the fuzzy DEMATEL results, the interrelationship between risks was identified using the fuzzy ANP questionnaire. Besides, the fuzzy rank and weight of each risk were estimated using the fuzzy ANP technique (see Fig. 2).
Figure 2.

The research procedure.
3.1. Expert panel
In order to identify and evaluate the project risks, the opinions of experts and specialists in managing oil exploration and exploitation projects in Neyr-Perse Company were used. Regarding Cochran sampling method 60 experts were asked to fill the questionnaire. In order to complete the Delphi, DEMATEL, and ANP questionnaires, 15 experienced experts who held the main and related positions in the company were surveyed. The experts were selected based on their expertise and availability.
3.2. Instruments and data collection procedure
The data were collected through library and field techniques. The secondary data were collected via the library technique and the initial data were collected using the field technique, i.e. by distributing questionnaires among the respondents in the research sample. In this study, three fuzzy Delphi, fuzzy DEMATEL and fuzzy ANP questionnaires were used. To determine the validity of the questionnaire, expert opinion was used. That is, all three questionnaires have a stereotypical structure and the indices are first extracted from the research literature and entered into the Delphi questionnaire. Then the confirmed risks are entered into the DEMTEL and paired ANP comparison questionnaire. Therefore, the professors as well as the experts in the first stage of the research confirm the risks.
3.3. Data analysis
The data collected in this study were analyzed in three stages. First confirmation of the identified risks using fuzzy Delphi analysis, second construction of the validated factors using fuzzy DEMATEL and then prioritization of the final indicators using fuzzy ANP. The following is a description of each method:
3.3.1. Fuzzy set theory
Decision-making in the area of risk analysis cannot be made in a purely definitive space. In classical multi-criteria decision making, the weight of the criteria is well known, but due to the ambiguity and uncertainty in the decision-maker statements, expressing the data definitively is inappropriate [24]. In this study, verbal expressions were used instead of definite numbers to determine the weight of the indexes and to rank the options. In this study, Table 5 proposed by [25] to determine the effectiveness of risks and their weights and Table 6 presented by [26] to form the decision matrix were used.
Table 5.
Correspondence of verbal expressions with triangular fuzzy numbers.
| Fuzzy numbers | Verbal expressions |
|---|---|
| (0.75,1,1) | Very High Influence |
| (1,0.75,0.5) | High Influence |
| (0.75,0.5,0.25) | Low Influence |
| (0.5,.0.25,0) | Very Low Influence |
| (0.25,0,0) | No Influence |
Table 6.
Verbal variables associated with indicators.
| Verbal variables | Triangular Fuzzy Number |
|---|---|
| Very Weak | (0,1,3) |
| Weak | (1,3,5) |
| Normal | (3,5,7) |
| Strong | (5,7,9) |
| Very Strong | (7,9,10) |
In this study, triangular fuzzy numbers are used to prevent ambiguity from decision making at all stages. A fuzzy triangle number denoted by à = (l, m, u). The parameters l, m, and u respectively represent the lowest possible value, the most probable value, and the highest possible value of a fuzzy event [24]. To assess the experts' views on the severity of the impact of the risks in pairwise comparisons, the five preferred linguistic variables “equal”, “low”, “high”, “very high” and “very high” were used.
It should be noted that triangular fuzzy numbers is used in Fuzzy DEMATEL and Fuzzy ANP methods and trapezoidal Fuzzy numbers is used in Fuzzy Delphi Method. The description of both method is as follows.
3.3.2. Fuzzy Delphi technique
The fuzzy Delphi technique is, in fact, a combination of the Delphi method and the analysis of the collected data using the definitions of the theory of fuzzy sets as follows:
-
1.
Selecting experts and explaining the research problem to them
-
2.
Preparing the questionnaire and sending it to experts
-
3.Receiving the expert opinions and analyzing them: At this stage, the questionnaire is sent to the members of the expert panel and they are asked to express the extent to which they agree with each item/statement contained in the questionnaire. Given the verbal descriptions and variables defined in the questionnaire, the fuzzy average of each component is calculated using the following equations [27]
(1) (2) In Eq. (1) indicates the opinion of expert i and in Eq. (2), represents the average of the expert opinions. Also, , , , and represent trapezoidal fuzzy numbers.
-
4.
In this step, the previous opinion of each expert and its difference with the average opinions of others along with the next round of questionnaires will be sent back to the experts.
-
5.After conducting a new round of surveys, the opinions presented in the first step are compared with those expressed in the next step and if the difference between the two steps is less than the threshold of 0.2, the survey process is stopped. The threshold is calculated from the following equation:
(3) If the difference at this step exceeds the threshold, step 4 should be repeated.
-
6.
However, if the difference between the two steps is smaller than the threshold, the fuzzy Delphi process is stopped.
3.3.3. Fuzzy DEMATEL technique
Given that expert opinions are required to use the DEMATEL method and include both verbal and ambiguous expressions, it is advisable to convert them to fuzzy numbers in order to integrate them. To solve this problem, Lin and Wu developed a model using the dimensional method in the fuzzy environment [28]. The procedure is described below [25]
Step 1: Obtaining the expert opinions and averaging them
Suppose p experts have expressed their opinions about the relationship between risks is using the verbal expressions in Table 5. Therefore, there are p matrixes , , …, and , each representing the opinions of one expert, and the matrix components are identified with the corresponding fuzzy numbers. Eq (4) is used to estimate the average matrix of opinions
| (4) |
Matrix Z is called the initial fuzzy direct relation matrix.
Step 2: Calculation of the normalized direct relation matrix
Equations (5) and (6) are used to normalize the obtained matrix:
| (5) |
The steps for performing the fuzzy DEMATEL technique are described below:
| (6) |
Step 3: Calculating the total T relation fuzzy matrix
The total relation fuzzy matrix is calculated via equations (7) through (9):
| (7) |
Where each component is expressed as and is calculated as follows:
| (8) |
| (9) |
| (10) |
Where I is the identity matrix, and , , and are each an matrix whose components constitute the lower, middle, and upper numbers of the triangular fuzzy numbers of matrix H [29].
Step 4: Calculating the sum of the rows and columns of the matrix T4
The sum of rows and columns is obtained according to equations (11) and (12):
| (11) |
| (12) |
Where, and are and matrixes, respectively.
Step 5: Determining the weight of indexes and the relationship between the criteria
If, the related criterion will be effective and if the related criterion will be affected.
Step 6: Defuzzification of fuzzy numbers and calculated in the previous step
The fuzzy numbers and calculated in the previous step are defuzzificated using center of Gravity method Eq. (13)–(16):
| (13) |
| (14) |
| (15) |
| (16) |
Where is the defuzzificated value of .
Step 7: Calculating weight and impact factors:
The relative importance of the criteria will be estimated through the following equation [30] [31]
| (17) |
Step 8: Normalization of the weights of the criteria
| (18) |
Where, is the final weight of the decision-making criteria.
3.3.4. The fuzzy analysis network process (FANP)
The analysis network process (ANP) is generally the analytic hierarchy process (AHP) and a method for supporting multi-criteria decision-making for breaking down complex issues, with hierarchical relations among its components. The ANP also uses clockwise paired comparisons. The compatibility indicator is also used to indicate the convergence of the expert opinions. Each network component is denoted with symbols such as and , with elements. We show these elements with , , and . The effect of a dataset of elements in a component in the system is represented by a priority vector derived from the paired comparisons. The purpose of grouping and sorting these data is to transform the structure into a matrix. This matrix is used to represent the effect of an element of a component on itself, or of a component with an arrow from it to another component. Sometimes, like hierarchical mode, effects are run only from the beginning of the arrow to the end of the arrow. The effects of elements on other elements of the network can be shown via the supermatrix displayed in Fig. 3(a).
Figure 3.

Supermatrix.
Each in the supermatrix is called a block as shown in Fig. 3(b). Each column is an eigenvector of the effect (significance) of elements in the network component i on an element in the network component j. Some data may be zero for the lack of impact. Therefore, we do not need to use all the elements of a component in pairwise comparisons to obtain an eigenvector and only non-zero effects are sufficient. In the last step, we take the limit of the supermatrix W using the Markov process as follows, in order to obtain the ultimate priority: [32]
| (19) |
After completing the comparison matrix, the priority or weight of each criterion and alternative are calculated. In the analysis process, two types of weight should be calculated: relative weight and final weight.
The relative weight is obtained from the pairwise comparison matrix. The elements of each level are compared in terms of their respective element at the higher level in even pairs and their weights are calculated. These weights are called relative weights, while the final weight is the final rank of each option calculated from the combination of relative weights. Any pairwise comparison matrix may be compatible or incompatible. If this value is less than 0.1 it is accepted but in case of inconsistency, pairwise comparisons need to be repeated to obtain a consistent pairwise comparison matrix. Because a good decision model requires ambiguity, fuzzy set theory is used to solve the usual ANP, commonly known as fuzzy ANP or FANP. The following steps are taken to do so:
-
1.
Breaking down the project risk analysis into a network. The overall goal is to select the risks with the highest importance.
-
2.
A questionnaire is prepared on the basis of the mentioned network and experts are asked to complete it. The questionnaire is developed based on pairwise comparisons and a nine-point clock scale. The compatibility index and compatibility ratio are calculated for each matrix to test the consistency of the opinions of each expert. If the compatibility test is not accepted, the main values in the comparative pairwise matrix must be reviewed by the expert.
-
3.
The responses given to the items in the questionnaires are codified. Pairwise comparative scores are converted to expressive variables by the transformation concept in Table 7.
A fuzzy positive two-way matrix can be defined as follows:(20) Where is the positive two-way matrix of the decision maker k and is the related importance between the decision elements i and j:(21) If k represents expert to , each of the pairwise comparisons between the two criteria will have a k-positive fuzzy two-way triangular value. The geometric averaging method is used to integrate the multiple answers of experts. Accordingly, the integrated fuzzy positive two-way matrix is as follows:
so:(22) (23) -
4.
Using the center of Gravity method (explained in Fuzzy DEMATEL technique section), the generated triangular fuzzy numbers are converted to ordinary numbers.
-
5.
The pairwise comparison matrix is computed using non-fuzzy values and the priority vector for each pairwise comparison matrix is calculated.
-
6.
Using the Fuzzy ANP Solver, we create the unweighted supermatrix as shown in Fig. 4.
-
7.
The limit supermatrix is calculated by raising it to the power of the weighed supermatrix until the supermatrix converges to a stable supermatrix. Risk priority weights are obtained from the limit supermatrixes by using the Fuzzy ANP Solver software.
Table 7.
Conversion of expressive variables to fuzzy numbers.
| Variable expression | Fuzzy triangular positive numbers | Two-way fuzzy triangular numbers |
|---|---|---|
| Number 9 represents much higher importance of the row criterion compared to the column criterion. | (9, 9, 9) | (1/9, 1/9, 1/9) |
| Number 8 represents the state mediating 7 and 9. | (9, 8, 7) | (1/7, 1/8, 1/9) |
| Number 7 represents the greater importance of the row criterion versus the column criterion. | (8, 7, 6) | (1/6, 1/7, 1/8) |
| Number 6 represents the state mediating 5 and 7. | (7, 6, 5) | (1/5, 1/6, 1/7) |
| Number 5 represents a relatively greater relative importance of the row criterion versus the column criterion; | (6, 5, 4) | (1/4, 1/5, 1/6) |
| Number 4 represents the state mediating 3 and 5. | (5, 4, 3) | (1/3, 1/4, 1/5) |
| Number 3 represents the relatively more importance of the row criterion versus the column criterion. | (4, 3, 2) | (1/2, 1/3, 1/4) |
| Number 2 represents the state mediating 1 and 3. | (3, 2, 1) | (1, 1/2, 1/3) |
| Number 1 represents the equal importance of the row criterion and the column criterion. | (1, 1, 1) | (1, 1, 1) |
Figure 4.

The supermatrix used in this study.
4. Result
After the necessary information and data have been collected, extracted and categorized, the model and the information will be solved and analyzed respectively. This chapter uses the fuzzy Delphi method to specify identified risks in oil exploration and exploitation phases, and a novel fuzzy DEMATEL structuring method, as well as a fuzzy ANP ranking method for analyzing the collected data and structuring and rating of these factors. Following are the identified risks from the research sources, the results of the fuzzy Delphi method, the data analysis using the fuzzy DEMATEL method and finally the results of the fuzzy ANP technique.
4.1. Identified risks
This section presents the 32 identified risks from previous literature and studies and their categorization using the PMBOK classification (see Table 8).
Table 8.
Identified risks.
| Classification Based on PMBOK | Risks |
|---|---|
| Time and Cost | Delays in delivery of drilling rig due to delay in construction of seler yards and failure to timely access roads to wells |
| Neighboring oil withdrawal from the field due to shared reservoir | |
| Available restrictions on the supply of goods and equipment | |
| Landfill site contamination with explosives and landmines | |
| Observe the wetlands ecosystem in the region | |
| Lack of necessary infrastructure in the region to carry out industrial projects | |
| Price fluctuations in steel and rebar | |
| Cement price fluctuations | |
| Bitumen price fluctuations | |
| Preventing farmers from carrying out the project on the land | |
| Prevent the EPA from implementing the project on governmental lands | |
| The boycott of specialized consultations conducted by foreign companies | |
| Failure of endowment organization to cooperate in utilization of land | |
| Lack of necessary liquidity by internal contractors | |
| Failure to attract foreign investor in project implementation | |
| Failure to Perform Error Detection Studies (HAZOP) | |
| Preventing military organs from entering the area | |
| Human Resource | Lack of skilled labor due to deprivation of area |
| Lack of expert labor due to deprivation of area | |
| Not considering different executive teams | |
| Quality | Heavy and super heavy oil harvesting from reservoir layers and light oil harvesting from field reservoir layers |
| Failure to carry out IOR and EOR studies in the reservoir and preserve reservoir layers | |
| Injection of gas or execution of Gas Lift for proper removal of tanks | |
| Failure to comply with HSE environmental standards | |
| Contract | Not taking into account the work calendar and the shift in the project cycle |
| Not using minus by contractors and consultants in the bidding process and not taking into consideration the cost of the project and calculating the profits and losses | |
| Unable to get guarantees from foreign companies on the contract | |
| Area | Lack of understanding of the project and related activities |
| Communication | Failure to identify project execution processes and establish inter-organizational communication |
| Executing project like a matrix | |
| Others | Political and economic sanctions |
| Insurance of goods and equipment | |
By identifying these risks, given that these risks are taken from standard authorities, some of them may not be applicable in the Iranian field of operation or there may be other risks in the process of exploration and exploitation in Iran that should be addressed and only experts can comment on this. Therefore, fuzzy Delphi technique was used to gather expert opinion and reach consensus on identified risks. The reason for using fuzzy Delphi is to accept the uncertainty and ambiguity of the expert opinion as described below.
4.2. Fuzzy Delphi results
After distributing the questionnaire in two rounds and the averaging of the opinions, the results of the difference in averages and the final results of the consensus of the experts on the risks are presented in the following table.
4.2.1. Definition of linguistic variables
Qualitative variables are defined as trapezoidal fuzzy numbers: low (0,0,2,4), medium (3,4,6,7), high (6,8,10,10). Although trapezoidal fuzzy numbers have more complex computational process than triangular fuzzy numbers, they can Carry out more ambiguity in the verbal and qualitative variables in range from b to c defined for trapezoidal fuzzy numbers that the use of trapezoidal numbers for the Delphi section may reveal more ambiguity in expert opinion [33].
4.2.2. Risk analysis
Based on the suggested options and definition of linguistic variables, the questionnaire was designed. The results of the survey responses to the questionnaire are presented in Table 9.
Table 9.
First questionnaire results.
| Number | Risks | Agreement |
||
|---|---|---|---|---|
| Low | Medium | High | ||
| 1 | Delays in delivery of drilling rig due to delay in construction of seler yards and failure to timely access roads to wells | 4 | 7 | 4 |
| 2 | Neighboring oil withdrawal from the field due to shared reservoir | 7 | 6 | 2 |
| 3 | Available restrictions on the supply of goods and equipment | 0 | 0 | 15 |
| 4 | Landfill site contamination with explosives and landmines | 7 | 5 | 3 |
| 5 | Observe the wetlands ecosystem in the region | 2 | 6 | 7 |
| 6 | Lack of necessary infrastructure in the region to carry out industrial projects | 0 | 0 | 15 |
| 7 | Price fluctuations in steel and rebar | 1 | 3 | 11 |
| 8 | Cement price fluctuations | 0 | 3 | 12 |
| 9 | Bitumen price fluctuations | 0 | 3 | 12 |
| 10 | Preventing farmers from carrying out the project on the land | 8 | 5 | 3 |
| 11 | Prevent the EPA from implementing the project on governmental lands | 6 | 8 | 1 |
| 12 | The boycott of specialized consultations conducted by foreign companies | 0 | 1 | 14 |
| 13 | Failure of endowment organization to cooperate in utilization of land | 1 | 3 | 11 |
| 14 | Lack of necessary liquidity by internal contractors | 4 | 3 | 8 |
| 15 | Failure to attract foreign investor in project implementation | 0 | 0 | 15 |
| 16 | Failure to Perform Error Detection Studies (HAZOP) | 3 | 3 | 9 |
| 17 | Preventing military organs from entering the area | 0 | 0 | 15 |
| 18 | Lack of skilled labor due to deprivation of area | 0 | 0 | 15 |
| 19 | Lack of expert labor due to deprivation of area | 0 | 0 | 15 |
| 20 | Not considering different executive teams | 11 | 3 | 1 |
| 21 | Heavy and super heavy oil harvesting from reservoir layers and light oil harvesting from field reservoir layers | 3 | 4 | 8 |
| 22 | Failure to carry out IOR and EOR studies in the reservoir and preserve reservoir layers | 4 | 7 | 7 |
| 23 | Injection of gas or execution of Gas Lift for proper removal of tanks | 3 | 5 | 7 |
| 24 | Failure to comply with HSE environmental standards | 5 | 6 | 4 |
| 25 | Not taking into account the work calendar and the shift in the project cycle | 8 | 6 | 1 |
| 26 | Not using minus by contractors and consultants in the bidding process and not taking into consideration the cost of the project and calculating the profits and losses | 3 | 2 | 10 |
| 27 | Unable to get guarantees from foreign companies on the contract | 0 | 0 | 15 |
| 28 | Lack of understanding of the project and related activities | 1 | 4 | 10 |
| 29 | Failure to identify project execution processes and establish inter-organizational communication | 6 | 7 | 2 |
| 30 | Executing project like a matrix | 8 | 7 | 0 |
| 31 | Political and economic sanctions | 0 | 0 | 15 |
| 32 | Insurance of goods and equipment | 3 | 5 | 7 |
We also convert fuzzy numbers to definite numbers by using the Minkowski formula. Minkowski formula was used because with regards to the data in this paper in comparison with another defuzzification methods had better answer and was easier to use.
| (24) |
According to Tables 9 and 10, each expert's disagreement can be calculated according to Eq. (3) [27]. In fact, based on this relationship, each expert can measure his opinion with average comments and adjust his previous opinions if desired. The result of this step is given in Tables 11 and 12.
Table 10.
Average opinions of experts from the first questionnaire.
| Number | Risks | Average Views | The Defuzzificated Averages |
|---|---|---|---|
| 1 | Delays in delivery of drilling rig due to delay in construction of seler yards and failure to timely access roads to wells | (7, 6, 4, 3) | 5 |
| 2 | Neighboring oil withdrawal from the field due to shared reservoir | (6, 4.6, 2.6, 2) | 3.78 |
| 3 | Available restrictions on the supply of goods and equipment | (10, 10, 8, 6) | 8.67 |
| 4 | Landfill site contamination with explosives and landmines | (6.2, 4.9, 2.9, 2.2) | 4.02 |
| 5 | Observe the wetlands ecosystem in the region | (8, 7.3, 5.3, 4) | 6.22 |
| 6 | Lack of necessary infrastructure in the region to carry out industrial projects | (10, 10, 8, 6) | 8.67 |
| 7 | Price fluctuations in steel and rebar | (9, 8.6, 6.6, 5) | 7.44 |
| 8 | Cement price fluctuations | (9.4, 9.2, 7.2, 5.4) | 7.93 |
| 9 | Bitumen price fluctuations | (9.4, 9.2, 7.2, 5.4) | 7.93 |
| 10 | Preventing farmers from carrying out the project on the land | (6.4, 5, 2.9, 2.2) | 4.11 |
| 11 | Prevent the EPA from implementing the project on governmental lands | (6, 4.6, 2.9, 2.2) | 3.78 |
| 12 | The boycott of specialized consultations conducted by foreign companies | (9.8, 9.7, 7.7, 5.8) | 8.42 |
| 13 | Failure of endowment organization to cooperate in utilization of land | (9, 8.6, 6.6, 5) | 7.44 |
| 14 | Lack of necessary liquidity by internal contractors | (7.8, 7, 5, 3.8) | 5.98 |
| 15 | Failure to attract foreign investor in project implementation | (10, 10, 8, 6) | 8.67 |
| 16 | Failure to Perform Error Detection Studies (HAZOP) | (8.2, 7.6, 5.6, 4.2) | 6.47 |
| 17 | Preventing military organs from entering the area | (10, 10, 8, 6) | 8.67 |
| 18 | Lack of skilled labor due to deprivation of area | (10, 10, 8, 6) | 8.67 |
| 19 | Lack of expert labor due to deprivation of area | (10, 10, 8, 6) | 8.67 |
| 20 | Not considering different executive teams | (5, 3.3, 1.3, 1) | 2.56 |
| 21 | Heavy and super heavy oil harvesting from reservoir layers and light oil harvesting from field reservoir layers | (8, 7.3, 5.3, 4) | 6.22 |
| 22 | Failure to carry out IOR and EOR studies in the reservoir and preserve reservoir layers | (7, 6, 4, 3) | 5 |
| 23 | Injection of gas or execution of Gas Lift for proper removal of tanks | (7.8, 7, 5, 3.8) | 5.98 |
| 24 | Failure to comply with HSE environmental standards | (6.8, 5.7, 3.7, 2.8) | 4.76 |
| 25 | Not taking into account the work calendar and the shift in the project cycle | (5.6, 4.1, 2.1, 1.6) | 3.29 |
| 26 | Not using minus by contractors and consultants in the bidding process and not taking into consideration the cost of the project and calculating the profits and losses | (8.4, 7.8, 5.8, 4.4) | 6.71 |
| 27 | Unable to get guarantees from foreign companies on the contract | (10, 10, 8, 6) | 8.67 |
| 28 | Lack of understanding of the project and related activities | (8.8, 8.4, 6.4, 4.8) | 7.20 |
| 29 | Failure to identify project execution processes and establish inter-organizational communication | (6.2, 4.9, 2.9, 2.2) | 4.02 |
| 30 | Executing project like a matrix | (5.4, 3.8, 1.8, 1.4) | 3.04 |
| 31 | Political and economic sanctions | (10, 10, 8, 6) | 8.67 |
| 32 | Insurance of goods and equipment | (7.8, 7, 5, 3.8) | 5.98 |
Table 11.
Second questionnaire results.
| Number | Risks | Agreement |
||
|---|---|---|---|---|
| Low | Medium | High | ||
| 1 | Delays in delivery of drilling rig due to delay in construction of seler yards and failure to timely access roads to wells | 8 | 6 | 1 |
| 2 | Neighboring oil withdrawal from the field due to shared reservoir | 8 | 7 | 0 |
| 3 | Available restrictions on the supply of goods and equipment | 0 | 0 | 15 |
| 4 | Landfill site contamination with explosives and landmines | 6 | 6 | 3 |
| 5 | Observe the wetlands ecosystem in the region | 3 | 7 | 5 |
| 6 | Lack of necessary infrastructure in the region to carry out industrial projects | 0 | 0 | 15 |
| 7 | Price fluctuations in steel and rebar | 1 | 4 | 10 |
| 8 | Cement price fluctuations | 0 | 3 | 12 |
| 9 | Bitumen price fluctuations | 0 | 3 | 12 |
| 10 | Preventing farmers from carrying out the project on the land | 9 | 6 | 0 |
| 11 | Prevent the EPA from implementing the project on governmental lands | 7 | 8 | 0 |
| 12 | The boycott of specialized consultations conducted by foreign companies | 0 | 1 | 14 |
| 13 | Failure of endowment organization to cooperate in utilization of land | 1 | 3 | 11 |
| 14 | Lack of necessary liquidity by internal contractors | 3 | 4 | 8 |
| 15 | Failure to attract foreign investor in project implementation | 0 | 0 | 15 |
| 16 | Failure to Perform Error Detection Studies (HAZOP) | 2 | 3 | 10 |
| 17 | Preventing military organs from entering the area | 0 | 0 | 15 |
| 18 | Lack of skilled labor due to deprivation of area | 0 | 0 | 15 |
| 19 | Lack of expert labor due to deprivation of area | 0 | 0 | 15 |
| 20 | Not considering different executive teams | 12 | 2 | 1 |
| 21 | Heavy and super heavy oil harvesting from reservoir layers and light oil harvesting from field reservoir layers | 3 | 4 | 8 |
| 22 | Failure to carry out IOR and EOR studies in the reservoir and preserve reservoir layers | 3 | 8 | 4 |
| 23 | Injection of gas or execution of Gas Lift for proper removal of tanks | 1 | 6 | 8 |
| 24 | Failure to comply with HSE environmental standards | 7 | 8 | 0 |
| 25 | Not taking into account the work calendar and the shift in the project cycle | 8 | 7 | 0 |
| 26 | Not using minus by contractors and consultants in the bidding process and not taking into consideration the cost of the project and calculating the profits and losses | 3 | 2 | 10 |
| 27 | Unable to get guarantees from foreign companies on the contract | 0 | 0 | 15 |
| 28 | Lack of understanding of the project and related activities | 1 | 3 | 12 |
| 29 | Failure to identify project execution processes and establish inter-organizational communication | 6 | 8 | 1 |
| 30 | Executing project like a matrix | 8 | 7 | 0 |
| 31 | Political and economic sanctions | 0 | 0 | 15 |
| 32 | Insurance of goods and equipment | 3 | 4 | 8 |
Table 12.
Average opinions of experts from the second questionnaire.
| Number | Risks | Average of opinions | The Defuzzificated Averages |
|---|---|---|---|
| 1 | Delays in delivery of drilling rig due to delay in construction of seler yards and failure to timely access roads to wells | (6, 4.6, 2/6, 2) | 3.78 |
| 2 | Neighboring oil withdrawal from the field due to shared reservoir | (5.4, 3.8, 1.8, 1.4) | 3.04 |
| 3 | Available restrictions on the supply of goods and equipment | (10, 10, 8, 6) | 8.67 |
| 4 | Landfill site contamination with explosives and landmines | (6.4, 5.2, 3.2, 2.4) | 4.27 |
| 5 | Observe the wetlands ecosystem in the region | (7.4, 6.5, 4.5, 3.4) | 5.49 |
| 6 | Lack of necessary infrastructure in the region to carry out industrial projects | (10, 10, 8, 6) | 8.67 |
| 7 | Price fluctuations in steel and rebar | (8.8, 8.4, 6.4, 4.8) | 7.20 |
| 8 | Cement price fluctuations | (9.4, 9.2, 7.2, 5.4) | 7.93 |
| 9 | Bitumen price fluctuations | (9.6, 9.4, 7.4, 5.6) | 8.18 |
| 10 | Preventing farmers from carrying out the project on the land | (5.2, 3.6, 1.6, 1.2) | 2.80 |
| 11 | Prevent the EPA from implementing the project on governmental lands | (5.6, 4.1, 2.1, 1.6) | 3.29 |
| 12 | The boycott of specialized consultations conducted by foreign companies | (9.8, 9.7, 7.7, 5.8) | 8.42 |
| 13 | Failure of endowment organization to cooperate in utilization of land | (8.5, 8.2, 6.4, 4.8) | 7.11 |
| 14 | Lack of necessary liquidity by internal contractors | (8, 7.3, 5.3, 4) | 6.22 |
| 15 | Failure to attract foreign investor in project implementation | (10, 10, 8, 6) | 8.67 |
| 16 | Failure to Perform Error Detection Studies (HAZOP) | (8.6, 8.1, 6.1, 4.6) | 6.96 |
| 17 | Preventing military organs from entering the area | (10, 10, 8, 6) | 8.67 |
| 18 | Lack of skilled labor due to deprivation of area | (10, 10, 8, 6) | 8.67 |
| 19 | Lack of expert labor due to deprivation of area | (10, 10, 8, 6) | 8.67 |
| 20 | Not considering different executive teams | (4.8, 3, 1, 0.8) | 2.31 |
| 21 | Heavy and super heavy oil harvesting from reservoir layers and light oil harvesting from field reservoir layers | (8, 7.3, 5.3, 4) | 6.22 |
| 22 | Failure to carry out IOR and EOR studies in the reservoir and preserve reservoir layers | (7.2, 6.2, 4.2, 3.2) | 5.24 |
| 23 | Injection of gas or execution of Gas Lift for proper removal of tanks | (8.4, 7.8, 5.8, 4.4) | 6.71 |
| 24 | Failure to comply with HSE environmental standards | (5.6, 4.1, 2.1, 1.6) | 3.29 |
| 25 | Not taking into account the work calendar and the shift in the project cycle | (5.4, 3.8, 1.8, 1.4) | 3.04 |
| 26 | Not using minus by contractors and consultants in the bidding process and not taking into consideration the cost of the project and calculating the profits and losses | (8.4, 7.8, 5.8, 4.4) | 6.71 |
| 27 | Unable to get guarantees from foreign companies on the contract | (10, 10, 8, 6) | 8.67 |
| 28 | Lack of understanding of the project and related activities | (9, 8.6, 6.6, 5) | 7.44 |
| 29 | Failure to identify project execution processes and establish inter-organizational communication | (6, 4.6, 2.6, 2) | 3.78 |
| 30 | Executing project like a matrix | (5.4, 3.8, 1.8, 1.4) | 3.04 |
| 31 | Political and economic sanctions | (10, 10, 8, 6) | 8.67 |
| 32 | Insurance of goods and equipment | (8, 7.3, 5.3, 4) | 6.22 |
Following is a review of the results of the mean differences and the final conclusions of the experts on the risks.
As it can be seen, the experts did not agree on 6 cases. They also agreed to omit 10 risks and they confirmed 16 risks. Thus, to determine the assignment of the remaining six indices, the third Delphi questionnaire was redistributed and asked to re-evaluate their opinion (see Table 13).
Table 13.
Differences in the experts' opinions in the first and second questionnaires.
| No. | Identified risks | Differences | Average | Result |
|---|---|---|---|---|
| 1 | Delay in sending the drilling rig due to delay in constructing the cellar site and the failure to construct the access roads on time. | 1.17 | 3.78 | Next step |
| 2 | Oil recovery by the neighboring country from joint oil reservoirs | 0.70 | 3.04 | Next step |
| 3 | Limitations on supplying materials and equipment | 0.00 | 8.67 | Confirmed |
| 4 | Land pollution in the project site due to explosives and mines | 0.23 | 4.27 | Omitted |
| 5 | The observance of the ecosystem of wetlands in the region | 0.70 | 5.49 | Next step |
| 6 | The absence of the necessary infrastructure in the site for implementing industrial projects | 0.00 | 8.67 | Confirmed |
| 7 | Fluctuations in the price of steel and bars | 0.23 | 7.20 | Confirmed |
| 8 | Fluctuations in the price of cement | 0.00 | 7.93 | Confirmed |
| 9 | Fluctuations in the price of bitumen | 0.23 | 8.18 | Confirmed |
| 10 | Preventing the implementation of projects in the lands of interest by the farmers (land acquisition) | 1.27 | 2.80 | Next step |
| 11 | Preventing the implementation of projects in the government-owned lands by the Department of Environment | 0.47 | 3.29 | Omitted |
| 12 | Banning professional consultation by foreign companies | 0.00 | 8.42 | Confirmed |
| 13 | Non-cooperation of the endowment organization in exploiting endowed lands | 0.33 | 7.11 | Confirmed |
| 14 | The lack of required liquidity by domestic contractors | 0.23 | 6.22 | Omitted |
| 15 | Failure to attract foreign investors to implement the project | 0.00 | 8.67 | Confirmed |
| 16 | Failure to perform hazard and operability (HAZOP) studies | 0.47 | 6.96 | Confirmed |
| 17 | Preventing the entrance of machinery to the site by the military authorities | 0.00 | 8.67 | Confirmed |
| 18 | The lack of skilled workers due to the deprivation of the region | 0.00 | 8.67 | Confirmed |
| 19 | The lack of skilled experts due to the deprivation of the region | 0.00 | 8.67 | Confirmed |
| 20 | The nonexistence of various executive teams | 0.23 | 2.31 | Omitted |
| 21 | Extraction of heavy and super heavy oil from reservoir layers and light oil from field reservoir layers | 0.00 | 6.22 | Omitted |
| 22 | Failure to conduct IOR And EOR studies the reservoir and preservation of reservoir layers | 0.23 | 5.24 | Omitted |
| 23 | Gas injection or gas lift implementation for correct recovery from reservoirs | 0.70 | 6.71 | Next step |
| 24 | Failure to comply with HSE standards | 1.40 | 3.29 | Next step |
| 25 | The failure to comply with the work schedule and working shifts in the project cycle | 0.23 | 3.04 | Omitted |
| 26 | The failure of contractors and consultants to consider minus requirements in tenders and their failure to consider the project final cost and estimate profit and loss | 0.00 | 6.71 | Confirmed |
| 27 | Failure to obtain guarantees from foreign contractors | 0.00 | 8.67 | Confirmed |
| 28 | Failure to understand the project and activities associated with it | 0.23 | 7.44 | Confirmed |
| 29 | Failure to identify the executive processes of the project and establish intra-organizational communication | 0.23 | 3.78 | Omitted |
| 30 | Viewing the project as a matrix | 0.00 | 3.04 | Omitted |
| 31 | Economic and political sanctions | 0.00 | 8.67 | Confirmed |
| 32 | Insurance of goods and equipment | 0.23 | 6.22 | Omitted |
As it is shown in Table 14, it appears that the experts agreed with the remaining 6 items in the third stage. They omitted 5 risks and confirmed only 1 risk (No. 23). Thus, in total, 17 risks were confirmed by the experts and 15 were not confirmed due to climatic conditions of exploration and exploitation activities(see Table 15). Table 16 presents the list of the confirmed risks.
Table 14.
Differences in the experts' opinions in the second and third questionnaires.
| No. | Identified risks | Differences | Average | Result |
|---|---|---|---|---|
| 1 | Delay in sending the drilling rig due to delay in constructing the cellar site and the failure to construct the access roads on time | 0.23 | 3.53 | Omitted |
| 2 | Oil recovery by the neighboring country from joint oil reservoirs | 0.00 | 3.04 | Omitted |
| 5 | The observance of the ecosystem of wetlands in the region | 0.23 | 5.73 | Omitted |
| 10 | Preventing the implementation of projects in the lands of interest by the farmers (land acquisition) | 0.00 | 2.8 | Omitted |
| 23 | Gas injection or gas lift implementation for correct recovery from reservoirs | 0.23 | 6.96 | Confirmed |
| 24 | Failure to comply with HSE standards | 0.00 | 3.29 | Omitted |
Table 15.
The identified risks.
| No. | Identified risks | symbol |
|---|---|---|
| 1 | Limitations on supplying materials and equipment | |
| 2 | The absence of the necessary infrastructure in the site for implementing industrial projects | |
| 3 | Fluctuations in the price of steel and bars | |
| 4 | Fluctuations in the price of cement | |
| 5 | Fluctuations in the price of bitumen | |
| 6 | Banning professional consultation by foreign companies | |
| 7 | Non-cooperation of the endowment organization in exploiting endowed lands | |
| 8 | Failure to attract foreign investors to implement the project | |
| 9 | Failure to perform hazard and operability (HAZOP) studies | |
| 10 | Preventing the entrance of machinery to the site by the military authorities | |
| 11 | The lack of skilled workers due to the deprivation of the region | |
| 12 | The lack of skilled experts due to the deprivation of the region | |
| 13 | Gas injection or gas lift implementation for correct recovery from reservoirs | |
| 14 | The failure of contractors and consultants to consider minus requirements in tenders and their failure to consider the project final cost and estimate profit and loss | |
| 15 | Failure to obtain guarantees from foreign contractors | |
| 16 | Failure to understand the project and activities associated with it | |
| 17 | Economic and political sanctions |
Table 16.
One expert's opinion on the pairwise comparison of indicators in terms of effectiveness.
| Identified risk | |||||||||||||||||
|---|---|---|---|---|---|---|---|---|---|---|---|---|---|---|---|---|---|
| NO | VL | NO | NO | NO | NO | NO | VL | VL | NO | NO | NO | H | NO | VL | NO | NO | |
| H | NO | L | L | L | NO | NO | L | NO | NO | L | L | NO | NO | NO | NO | NO | |
| H | VL | NO | VL | VL | NO | NO | NO | NO | NO | NO | NO | NO | H | NO | VL | NO | |
| H | VL | VL | NO | VL | NO | NO | NO | NO | NO | NO | NO | NO | H | NO | VL | NO | |
| H | VL | VL | VL | NO | NO | NO | NO | NO | NO | NO | NO | NO | H | NO | VL | NO | |
| NO | NO | NO | NO | NO | NO | NO | VL | H | NO | VL | VL | H | H | H | H | NO | |
| NO | NO | NO | NO | NO | NO | NO | NO | NO | NO | L | L | NO | NO | NO | NO | NO | |
| H | H | VL | VL | VL | VL | NO | VL | H | NO | H | H | H | H | L | H | NO | |
| NO | NO | NO | NO | NO | NO | NO | NO | NO | NO | NO | NO | VL | NO | NO | NO | NO | |
| VL | H | NO | NO | NO | NO | NO | L | NO | NO | VL | VL | NO | L | NO | NO | NO | |
| NO | NO | NO | NO | NO | NO | NO | NO | L | NO | NO | VL | VL | VL | NO | NO | NO | |
| NO | NO | NO | NO | NO | NO | NO | NO | L | NO | VL | NO | L | H | NO | H | NO | |
| NO | NO | NO | NO | NO | NO | NO | NO | NO | NO | NO | NO | NO | NO | NO | NO | NO | |
| H | NO | VL | VL | VL | NO | NO | NO | VL | NO | VL | VL | VL | NO | NO | NO | NO | |
| VL | VL | NO | NO | NO | VL | NO | L | NO | NO | L | VL | VL | VL | NO | NO | NO | |
| VL | VL | NO | NO | NO | NO | L | NO | L | L | VL | VL | VL | L | VL | NO | NO | |
| VH | VH | VH | VH | VH | VH | NO | VH | VL | L | VH | VH | L | H | VH | NO | NO |
4.3. Fuzzy DEMATEL results
At first, the DEMATEL questionnaire was distributed among the experts and they were asked to compare the extent to which the indexes under analysis are effective or being affected by each other using verbal descriptions. In the next step, the questionnaires were collected and the verbal descriptions were converted to the corresponding fuzzy numbers (see Table 17).
Table 17.
Corresponding fuzzy numbers for pairwise comparisons.
| Identified Risk | |||||||||
|---|---|---|---|---|---|---|---|---|---|
| (.25, 0, 0) | (.5, .25, 0) | (.25, 0, 0) | (.25, 0, 0) | (.25, 0, 0) | (.25, 0, 0) | (.25, 0, 0) | (.5, .25, 0) | (.5, .25, 0) | |
| (.25, 0, 0) | (.25, 0, 0) | (.25, 0, 0) | (1, .75, .5) | (.25, 0, 0) | (.5, .25, 0) | (.25, 0, 0) | (.25, 0, 0) | ||
| (1, .75, .5) | (.25, 0, 0) | (.75,.5,.25) | (.75,.5,.25) | (.75,.5,.25) | (.25, 0, 0) | (.25, 0, 0) | (.75,.5,.25) | (.25, 0, 0) | |
| (.25, 0, 0) | (.75,.5,.25) | (.75,.5,.25) | (.25, 0, 0) | (.25, 0, 0) | (.25, 0, 0) | (.25, 0, 0) | (.25, 0, 0) | ||
| (1, .75, .5) | (.5, .25, 0) | (.25, 0, 0) | (.5, .25, 0) | (.5, .25, 0) | (.25, 0, 0) | (.25, 0, 0) | (.25, 0, 0) | (.25, 0, 0) | |
| (.25, 0, 0) | (.25, 0, 0) | (.25, 0, 0) | (.25, 0, 0) | (1, .75, .5) | (.25, 0, 0) | (.5, .25, 0) | (.25, 0, 0) | ||
| (1, .75, .5) | (.5, .25, 0) | (.5, .25, 0) | (.25, 0, 0) | (.5, .25, 0) | (.25, 0, 0) | (.25, 0, 0) | (.25, 0, 0) | (.25, 0, 0) | |
| (.25, 0, 0) | (.25, 0, 0) | (.25, 0, 0) | (.25, 0, 0) | (1, .75, .5) | (.25, 0, 0) | (.5, .25, 0) | (.25, 0, 0) | ||
| (1,.75,.5) | (.5, .25, 0) | (.5, .25, 0) | (.5, .25, 0) | (.25, 0, 0) | (.25, 0, 0) | (.25, 0, 0) | (.25, 0, 0) | (.25, 0, 0) | |
| (.25, 0, 0) | (.25, 0, 0) | (.25, 0, 0) | (.25, 0, 0) | (1, .75, .5) | (.25, 0, 0) | (.5, .25, 0) | (.25, 0, 0) | ||
| (.25, 0, 0) | (.25, 0, 0) | (.25, 0, 0) | (.25, 0, 0) | (.25, 0, 0) | (.25, 0, 0) | (.25, 0, 0) | (.5, .25, 0) | (1, .75, .5) | |
| (.25, 0, 0) | (.5, .25, 0) | (.5, .25, 0) | (1, .75, .5) | (1, .75, .5) | (1, .75, .5) | (1, .75, .5) | (.5, .25, 0) | ||
| (.25, 0, 0) | (.25, 0, 0) | (.25, 0, 0) | (.25, 0, 0) | (.25, 0, 0) | (.25, 0, 0) | (.25, 0, 0) | (.25, 0, 0) | (.25, 0, 0) | |
| (.25, 0, 0) | (.75,.5,.25) | (.75,.5,.25) | (.25, 0, 0) | (.25, 0, 0) | (.25, 0, 0) | (.25, 0, 0) | (.25, 0, 0) | ||
| (1, .75, .5) | (1, .75, .5) | (.5, .25, 0) | (.5, .25, 0) | (.5, .25, 0) | (.5, .25, 0) | (.25, 0, 0) | (.25, 0, 0) | (1, .75, .5) | |
| (.25, 0, 0) | (1, .75, .5) | (1, .75, .5) | (1, .75, .5) | (1, .75, .5) | (.75,.5,.25) | (1, .75, .5) | (.25, 0, 0) | ||
| (.25, 0, 0) | (.25, 0, 0) | (.25, 0, 0) | (.25, 0, 0) | (.25, 0, 0) | (.25, 0, 0) | (.25, 0, 0) | (.25, 0, 0) | (.25, 0, 0) | |
| (.25, 0, 0) | (.25, 0, 0) | (.25, 0, 0) | (.5, .25, 0) | (.25, 0, 0) | (.25, 0, 0) | (.25, 0, 0) | (.25, 0, 0) | ||
| (.5, .25, 0) | (.5, .25, 0) | (.25, 0, 0) | (.25, 0, 0) | (.25, 0, 0) | (.25, 0, 0) | (.25, 0, 0) | (.75,.5,.25) | (.25, 0, 0) | |
| (.25, 0, 0) | (.5, .25, 0) | (.5,.25, 0) | (.25, 0, 0) | (.75,.5,.25) | (.25, 0, 0) | (.25, 0, 0) | (.25, 0, 0) | ||
| (.25, 0, 0) | (.25, 0, 0) | (.25, 0, 0) | (.25, 0, 0) | (.25, 0, 0) | (.25, 0, 0) | (.25, 0, 0) | (.25, 0, 0) | (.75,.5,.25) | |
| (.25, 0, 0) | (.25, 0, 0) | (.25, 0, 0) | (.25, 0, 0) | (.25, 0, 0) | (.25, 0, 0) | (.25, 0, 0) | (.25, 0, 0) | ||
| (.25, 0, 0) | (.25, 0, 0) | (.25, 0, 0) | (.25, 0, 0) | (.25, 0, 0) | (.25, 0, 0) | (.25, 0, 0) | (.25, 0, 0) | (.75,.5,.25) | |
| (.25, 0, 0) | (.5, .25, 0) | (.25, 0, 0) | (.75,.5,.25) | (1, .75, .5) | (.25, 0, 0) | (1, .75, .5) | (.25, 0, 0) | ||
| (.25, 0, 0) | (.25, 0, 0) | (.25, 0, 0) | (.25, 0, 0) | (.25, 0, 0) | (.25, 0, 0) | (.25, 0, 0) | (.25, 0, 0) | (.25, 0, 0) | |
| (.25, 0, 0) | (.25, 0, 0) | (.25, 0, 0) | (.25, 0, 0) | (.25, 0, 0) | (.25, 0, 0) | (.25, 0, 0) | (.25, 0, 0) | ||
| (1, .75, .5) | (.25, 0, 0) | (.5, .25, 0) | (.5, .25, 0) | (.5, .25, 0) | (.25, 0, 0) | (.25, 0, 0) | (.25, 0, 0) | (.5, .25, 0) | |
| (.25, 0, 0) | (.5, .25, 0) | (.5, .25, 0) | (.5, .25, 0) | (.25, 0, 0) | (.25, 0, 0) | (.25, 0, 0) | (.25, 0, 0) | ||
| (.5, .25, 0) | (.5, .25, 0) | (.25, 0, 0) | (.25, 0, 0) | (.5, .25, 0) | (.25, 0, 0) | (.75,.5,.25) | (.25, 0, 0) | (.25, 0, 0) | |
| (0.75,.5,.25) | (.5, .25, 0) | (.5, .25, 0) | (.5, .25, 0) | (.25, 0, 0) | (.25, 0, 0) | (.25, 0, 0) | (.25, 0, 0) | ||
| (.5, .25, 0) | (.5, .25, 0) | (.25, 0, 0) | (.25, 0, 0) | (.25, 0, 0) | (.25, 0, 0) | (.75,.5, .25) | (.25, 0, 0) | (.75,.5,.25) | |
| (.75,.5,.25) | (.5, .25, 0) | (.5, .25, 0) | (.5, .25, 0) | (.75,.5,.25) | (.5, .25, 0) | (.25, 0, 0) | (.25, 0, 0) | ||
| (1, 1, .75) | (1, 1, .75) | (1, 1, .75) | (1, 1, .75) | (1, 1, .75) | (1, 1, .75) | (.25, 0, 0) | (1, 1, .75) | (.5, .25, 0) | |
| (.75,.5,.25) | (1, 1, .75) | (1, 1,.75) | (.75,.5,.25) | (1,.75,.5) | (1, 1,.75) | (.25, 0, 0) | (.25, 0, 0) | ||
In the next step, the matrix of the expert opinions was formed in the form of fuzzy numbers for each expert, and the opinions were accumulated using the mean arithmetic method. The matrix of accumulated expert opinions is obtained as a fuzzy set [34]
This matrix is called the initial direct-relation fuzzy matrix, in which is a triangular fuzzy number and is considered a triangular fuzzy number .
Then, by normalizing the initial direct-relation fuzzy matrix, the normalized direct-relation fuzzy matrix is obtained as follows:
| (25) |
Where r is defined as follows:
| (26) |
Table 18 shows the normalized accumulated expert opinion matrix.
Table 18.
The normalized accumulated expert opinion matrix.
| Identified Risk | |||||||||
|---|---|---|---|---|---|---|---|---|---|
| (0,0,.25) | (.53,.28,.03) | (0,0,.25) | (0,0,.25) | (0,0,.25) | (0,0,.25) | (0,0,.25) | (.58,.33,.08) | (.53,.28,.03) | |
| (0,0,.25) | (0,0,.25) | (0,0,.25) | (1, .76, .51) | (0,0,.25) | (.5, .25, 0) | (0,0,.25) | (0,0,.25) | ||
| (1,.78,.53) | (0,0,.25) | (.68,.43,.18) | (.51,.26, .5) | (.73,.48,.23) | (0,0,.25) | (0,0,.25) | (.25,.5,.75) | (0,0,.25) | |
| (0,0,.25) | (.73,.48,.23) | (.73,.48,.23) | (0,0,.25) | (0,0,.25) | (0,0,.25) | (0,0,.25) | (0,0,.25) | ||
| (1,.78,.53) | (.58,.33,.08) | (0,0,.25) | (.58,.33,.08) | (.58,.33,.08) | (0,0,.25) | (0,0,.25) | (0,0,.25) | (0,0,.25) | |
| (0,0,.25) | (0,0,.25) | (0,0,.25) | (0,0,.25) | (1, .9, .79) | (0,0,.25) | (.58,.33,.08) | (0,0,.25) | ||
| (1, .78, .53) | (.58,.33,.08) | (.58,.33,.08) | (0,0,.25) | (.58,.33,.08) | (0,0,.25) | (0,0,.25) | (0,0,.25) | (0,0,.25) | |
| (0,0,.25) | (0,0,.25) | (0,0,.25) | (0,0,.25) | (.6,.25,.21) | (0,0,.25) | (.58,.33,.08) | (0,0,.25) | ||
| (1,.78,.53) | (.58,.33,.08) | (.58,.33,.08) | (.58,.33,.08) | (0,0,.25) | (0,0,.25) | (0,0,.25) | (0,0,.25) | (0,0,.25) | |
| (0,0,.25) | (0,0,.25) | (0,0,.25) | (0,0,.25) | (.9,.65,.4) | (0,0,.25) | (.58,.33,.08) | (0,0,.25) | ||
| (0,0,.25) | (0,0,.25) | (0,0,.25) | (0,0,.25) | (0,0,.25) | (0,0,.25) | (0,0,.25) | (.68,.43,.18) | (1, .8, .55) | |
| (0,0,.25) | (.55,.3,.15) | (.55,.3,.15) | (1,.8, .55) | (1, .8, .55) | (1, .8, .55) | (1, .8, .55) | (0,0,.25) | ||
| (0,0,.25) | (0,0,.25) | (0,0,.25) | |||||||
| (0,0,.25) | (0,0,.25) | (0,0,.25) | (0,0,.25) | (0,0,.25) | (0,0,.25) | ||||
| (0,0,.25) | (.56,.31,.06) | (.6,.35,.1) | (0,0,.25) | (0,0,.25) | (0,0,.25) | (0,0,.25) | (0,0,.25) | ||
| (.9,.65,.4) | (.93,.71,.46) | (.51,.26,.01) | (.5, .25, 0) | (.5, .25, 0) | (.5, .25, 0) | (0,0,.25) | (0,0,.25) | (1, .8,.55) | |
| (0,0,.25) | (1,.88,.73) | (0.96,.71,.46) | (1,.81,.56) | (1, .75, .5) | (.75,.5,.25) | (1, .75, .5) | (0,0,.25) | ||
| (0,0,.25) | (0,0,.25) | (0,0,.25) | (0,0,.25) | (0,.25, .5) | (0,0,.25) | (0,0,.25) | (0,0,.25) | (0,0,.25) | |
| (0,0,.25) | (0,0,.25) | (0,0,.25) | (.55,.3,.05) | (0,0,.25) | (0,0,.25) | (0,0,.25) | (0,0,.25) | ||
| (.55,.3,.05) | (.91,.66,.41) | (0,0,.25) | (0,0,.25) | (0, .25, .5) | (0,0,.25) | (0,0,.25) | (.55,.3,.05) | (0,0,.25) | |
| (0,0,.25) | (.55,.3,.05) | (.55,.3,.05) | (0,0,.25) | (.55,.3,.05) | (0,0,.25) | (0,0,.25) | (0,0,.25) | ||
| (0,0,.25) | (0,0,.25) | (0,0,.25) | (0,0,.25) | (0, .25, .5) | (0,0,.25) | (0,0,.25) | (0,0,.25) | (.55,.3,.05) | |
| (0,0,.25) | (0,0,.25) | (.55,.3,.05) | (.55,.3,.05) | (.55,.3,.05) | (0,0,.25) | (0,0,.25) | (0,0,.25) | ||
| (0,0,.25) | (0,0,.25) | (0,0,.25) | (0,0,.25) | (0, .25, .5) | (0,0,.25) | (0,0,.25) | (0,0,.25) | (.55,.3,.05) | |
| (0,0,.25) | (.55,.3,.05) | (0,0,.25) | (.55,.3,.05) | (.55,.3,.05) | (0,0,.25) | (.55,.3,.05) | (0,0,.25) | ||
| (0,0,.25) | (0,0,.25) | (0,0,.25) | (0,0,.25) | (0,.25, .5) | (0,0,.25) | (0,0,.25) | (0,0,.25) | (0,0,.25) | |
| (0,0,.25) | (0,0,.25) | (0,0,.25) | (0,0,.25) | (0,0,.25) | (0,0,.25) | (0,0,.25) | (0,0,.25) | ||
| (1, .76, .51) | (0,0,.25) | (.55,.3,.05) | (.55,.3,.05) | (.55,.3,.05) | (0,0,.25) | (0,0,.25) | (0,0,.25) | (.55,.3,.05) | |
| (0,0,.25) | (.55,.3,.05) | (.55,.3,.05) | (.55,.3,.05) | (0,0,.25) | (0,0,.25) | (0,0,.25) | (0,0,.25) | ||
| (.55,.3,.05) | (.55,.3,.05) | (0,0,.25) | (0,0,.25) | (0,0,.25) | (.55,.3,.05) | (0,0,.25) | (.55,.3,.05) | (0,0,.25) | |
| (0,0,.25) | (.55,.3,.05) | (.55,.3,.05) | (.55,.3,.05) | (.55,.3,.05) | (0,0,.25) | (0,0,.25) | (0,0,.25) | ||
| (.55,.3,.05) | (.55,.3,.05) | (0,0,.25) | (0,0,.25) | (0, .25, .5) | (0,0,.25) | (.55,.3,.05) | (0,0,.25) | (.55,.3,.05) | |
| (.55,.3,.05) | (.55,.3,.05) | (.55,.3,.05) | (.55,.3,.05) | (.55,.3,.05) | (.55,.3,.05) | (0,0,.25) | (0,0,0.25) | ||
| (1, 1,.75) | (1, 1,.75) | (1, 1,.75) | (1, 1,.75) | (1, 1,.75) | (1, 1,.75) | (0,0,.25) | (1, 1,.75) | (.55,.3,.05) | |
| (.7,.45,.2) | (1, 1,.75) | (1, 1,.75) | (.7,.45, .2) | (1, 1,.75) | (1, 1,.75) | (0,0,.25) | (0,0,.25) | ||
In the next stage, high, middle, and lower fuzzy triangular numbers were separated from each other and entered into the DEMATEL Solver software as three separate matrices. Then the results were combined. That is, R and J values for all three parts were combined and the three matrices formed a single fuzzy matrix. Then the R+J and R-J were calculated using fuzzy equations (see Table 19).
Table 19.
The result of the DEMTEL technique for the bottom section of triangular fuzzy.
| Result | R | J | R+J | R-J |
|---|---|---|---|---|
| 0.081 | 0.502 | 0.583 | -0.4211 | |
| 0.2305 | 0.239 | 0.4695 | -0.0085 | |
| 0.1984 | 0.1422 | 0.3406 | 0.0562 | |
| 0.1352 | 0.1224 | 0.2576 | 0.0128 | |
| 0.1574 | 0.1482 | 0.3056 | 0.0092 | |
| 0.3931 | 0.0936 | 0.4867 | 0.2995 | |
| 0.0204 | 0.0058 | 0.0263 | 0.0146 | |
| 0.5454 | 0.1731 | 0.7185 | 0.3723 | |
| 0.0058 | 0.184 | 0.1898 | -0.1781 | |
| 0.0924 | 0.0292 | 0.1217 | 0.0632 | |
| 0.0243 | 0.2792 | 0.3035 | -0.2549 | |
| 0.1294 | 0.247 | 0.3764 | -0.1177 | |
| 0 | 0.3074 | 0.3074 | -0.3074 | |
| 0.1094 | 0.4821 | 0.5915 | -0.3727 | |
| 0.0545 | 0.1998 | 0.2543 | -0.1453 | |
| 0.0617 | 0.2458 | 0.3075 | -0.18411 | |
| 1.1621 | 0 | 1.1621 | 1.1621 |
The results showed that the risk of political and economic sanctions, lack of attraction of foreign investors in project implementation, sanctioning of specialized consultations by foreign companies, and lack of necessary infrastructure in the region for the implementation of industrial projects in the first priority up to Fourth is in the analysis of bottom numbers of triangular fuzzy (see Table 20).
Table 20.
The result of the DEMTEL technique for the middle section of triangular fuzzy.
| Result | R | J | R+J | R-J |
|---|---|---|---|---|
| 0.1825 | 0.6117 | 0.7942 | -0.4291 | |
| 0.3593 | 0.3891 | 0.7484 | -0.0297 | |
| 0.2921 | 0.2488 | 0.5409 | 0.0433 | |
| 0.246 | 0.2289 | 0.4749 | 0.0171 | |
| 0.2712 | 0.2536 | 0.5248 | 0.0176 | |
| 0.4601 | 0.129 | 0.5891 | 0.3311 | |
| 0.0648 | 0.0249 | 0.0897 | 0.0399 | |
| 0.7238 | 0.2772 | 1.001 | 0.4467 | |
| 0.0249 | 0.3492 | 0.3741 | -0.3243 | |
| 0.2271 | 0.0622 | 0.2894 | 0.1649 | |
| 0.1074 | 0.43 | 0.5374 | -0.3225 | |
| 0.2366 | 0.4509 | 0.6876 | -0.2143 | |
| 0 | 0.5198 | 0.5198 | -0.5198 | |
| 0.2803 | 0.6387 | 0.9191 | -0.3584 | |
| 0.248 | 0.2809 | 0.5288 | -0.0329 | |
| 0.2797 | 0.3533 | 0.633 | -0.0737 | |
| 1.2443 | 0 | 1.2443 | 1.2443 |
The results showed that the risk of political and economic sanctions, lack of attraction of foreign investors in project implementation, sanctioning of specialized consultations by foreign companies, and lack of necessary infrastructure in the region for the implementation of industrial projects in the first priority up to Fourth is in the analysis of middle numbers of triangular fuzzy (see Table 21).
Table 21.
The result of the DEMTEL technique for the above section of triangular fuzzy.
| Result | R | J | R+J | R-J |
|---|---|---|---|---|
| 0.9096 | 1.5353 | 2.4449 | -0.6257 | |
| 1.1485 | 1.199 | 2.3475 | -0.0505 | |
| 1.0551 | 0.9872 | 2.0423 | 0.0679 | |
| 0.9971 | 0.9591 | 1.9562 | 0.038 | |
| 1.0406 | 0.9936 | 2.0342 | 0.047 | |
| 1.322 | 0.8109 | 2.1329 | 0.5111 | |
| 0.7316 | 0.6869 | 1.4185 | 0.0447 | |
| 1.6718 | 1.0105 | 2.6823 | 0.6613 | |
| 0.6766 | 1.1738 | 1.8504 | -0.4972 | |
| 1.0082 | 0.7408 | 1.749 | 0.2674 | |
| 0.8008 | 1.2265 | 2.0274 | -0.4257 | |
| 0.9632 | 1.2256 | 2.1888 | -0.2624 | |
| 0.6407 | 1.3319 | 1.9726 | -0.6912 | |
| 1.0337 | 1.4804 | 2.5141 | -0.4467 | |
| 1.0018 | 0.9955 | 1.9973 | 0.0063 | |
| 1.0549 | 1.1115 | 2.1664 | -0.0567 | |
| 2.0533 | 0.6407 | 2.694 | 1.4126 |
The results showed that the risk of political and economic sanctions, lack of attraction of foreign investors in project implementation, sanctioning of specialized consultations by foreign companies, and lack of necessary infrastructure in the region for the implementation of industrial projects in the first priority up to Fourth is in the analysis of above numbers of triangular fuzzy.
In order to determine the final ranks and design the impact model Table 22 is deffuzzified as follows [35], [36]
Table 22.
Fuzzy R+J and R-J relations.
| R-J | R+J | ||||||||||
|---|---|---|---|---|---|---|---|---|---|---|---|
| -1.4543 | -0.4292 | 0.4076 | 0.583 | 0.7942 | 2.4449 | 0.502 | 0.6117 | 1.5353 | 0.081 | 0.1825 | 0.9096 |
| -0.9685 | -0.0298 | 0.9095 | 0.4695 | 0.7484 | 2.3475 | 0.239 | 0.3891 | 1.199 | 0.2305 | 0.3593 | 1.1485 |
| -0.7888 | 0.0433 | 0.9129 | 0.3406 | 0.5409 | 2.0423 | 0.1422 | 0.2488 | 0.9872 | 0.1984 | 0.2921 | 1.0551 |
| -0.8239 | 0.0171 | 0.8747 | 0.2576 | 0.4749 | 1.9562 | 0.1224 | 0.2289 | 0.9591 | 0.1352 | 0.246 | 0.9971 |
| -0.8362 | 0.0176 | 0.8924 | 0.3056 | 0.5248 | 2.0342 | 0.1482 | 0.2536 | 0.9936 | 0.1574 | 0.2712 | 1.0406 |
| -0.4178 | 0.4178 | 1.2284 | 0.4867 | 0.5891 | 2.1329 | 0.0936 | 0.129 | 0.8109 | 0.3931 | 0.4601 | 1.322 |
| -0.6665 | 0.0399 | 0.7258 | 0.0262 | 0.0897 | 1.4185 | 0.0058 | 0.0249 | 0.6869 | 0.0204 | 0.0648 | 0.7316 |
| -0.4651 | 0.4466 | 1.4987 | 0.7185 | 1.001 | 2.6823 | 0.1731 | 0.2772 | 1.0105 | 0.5454 | 0.7238 | 1.6718 |
| -1.168 | -0.3243 | 0.4926 | 0.1898 | 0.3741 | 1.8504 | 0.184 | 0.3492 | 1.1738 | 0.0058 | 0.0249 | 0.6766 |
| -0.6484 | 0.1649 | 0.979 | 0.1216 | 0.2893 | 1.749 | 0.0292 | 0.0622 | 0.7408 | 0.0924 | 0.2271 | 1.0082 |
| -1.2022 | -0.3226 | 0.5216 | 0.3035 | 0.5374 | 2.0273 | 0.2792 | 0.43 | 1.2265 | 0.0243 | 0.1074 | 0.8008 |
| -1.0962 | -0.2143 | 0.7162 | 0.3764 | 0.6875 | 2.1888 | 0.247 | 0.4509 | 1.2256 | 0.1294 | 0.2366 | 0.9632 |
| -1.3319 | -0.5198 | 0.3333 | 0.3074 | 0.5198 | 1.9726 | 0.3074 | 0.5198 | 1.3319 | 0 | 0 | 0.6407 |
| -1.371 | -0.3584 | 0.55163 | 0.5915 | 0.919 | 2.5141 | 0.4821 | 0.6387 | 1.4804 | 0.1094 | 0.2803 | 1.0337 |
| -0.941 | -0.0329 | 0.802 | 0.2543 | 0.5289 | 1.9973 | 0.1998 | 0.2809 | 0.9955 | 0.0545 | 0.248 | 1.0018 |
| -1.0498 | -0.0736 | 0.8091 | 0.3075 | 0.633 | 2.1664 | 0.2458 | 0.3533 | 1.1115 | 0.0617 | 0.2797 | 1.0549 |
| 0.5214 | 1.2443 | 2.0533 | 1.1621 | 1.2443 | 2.694 | 0 | 0 | 0.6407 | 1.1621 | 1.2443 | 2.0533 |
As is clear from the calculations, R17 has the greatest impact. This means that it also affects a large number of risks and has the greatest impact. Fig. 5 shows the impact of the final risks in the exploration and exploitation phase (see Table 23).
Figure 5.

The impact of final risks in the exploration and exploitation phase.
Table 23.
Final defuzzificated results.
| Result | R-J | R+J |
|---|---|---|
| -0.476 | 1.154 | |
| -0.030 | 1.078 | |
| 0.053 | 0.866 | |
| 0.021 | 0.791 | |
| 0.023 | 0.847 | |
| 0.368 | 0.949 | |
| 0.035 | 0.406 | |
| 0.482 | 1.351 | |
| -0.331 | 0.697 | |
| 0.165 | 0.612 | |
| -0.331 | 0.851 | |
| -0.202 | 0.985 | |
| -0.510 | 0.830 | |
| -0.384 | 1.236 | |
| -0.051 | 0.827 | |
| -0.097 | 0.935 | |
| -1.266 | 1.586 |
As it can be seen in the figure above, each factor at the highest point of the model (RJ) can affect the highest number of factors, and each factor on the right side of the model (R + J) can have the greatest impact on other factors. The results also indicated that the political and economic sanction is at the top of the model. Therefore, it affects the greatest number of factors. The non-attraction of foreign investors in the implementation of the projects and Banning professional consultation by foreign companies occupy the other positions in terms of their effects on other factors. In addition, political and economic sanction is located at the rightmost point the model, occupying the first place in terms of intensity. Also, the non-attraction of foreign investors in the implementation of the projects and the failure of contractors and consultants to consider minus requirements in tenders and their failure to consider the project final cost and estimate profit and loss occupy the next positions.
4.4. Fuzzy ANP results
To better understand the effect of the indexes, the threshold value must be specified so that the low-effect relationships are filtered out and removed from the model. In other words, only the effects are displayed that their value in the matrix T exceeds the threshold. According to the experts, the threshold covers the effects that are below the lower limit. To determine the threshold, the fuzzy matrix was defuzzificated and a DEMATEL analysis was performed for it. Then the defuzzificated threshold was estimated to be 0.05. In other words, the relations whose impact was higher than 0.05 were determined in the total impact matrix as shown in Table 24. [35], [36]:
Table 24.
The effects higher than the threshold in the total impact matrix.
| 0.0147 | 0.0303 | 0.0099 | 0.0095 | 0.01 | 0.0087 | 0.0073 | 0.0332 | 0.03 | 0.0076 | 0.0129 | |
| 0.0126 | 0.073 | 0.0134 | 0.0261 | 0.011 | 0.0071 | ||||||
| 0.0833 | 0.0169 | 0.0441 | 0.0303 | 0.0484 | 0.0098 | 0.0085 | 0.0498 | 0.0166 | 0.0087 | 0.0516 | |
| 0.0516 | 0.0207 | 0.0232 | 0.0129 | 0.0176 | 0.0081 | ||||||
| 0.0841 | 0.0371 | 0.0132 | 0.0352 | 0.03591 | 0.0088 | 0.0085 | 0.0124 | 0.014 | 0.0088 | 0.0142 | |
| 0.0142 | 0.018 | 0.0867 | 0.0115 | 0.035 | 0.0078 | ||||||
| 0.0808 | 0.0365 | 0.0344 | 0.0114 | 0.0346 | 0.0085 | 0.0082 | 0.0119 | 0.0126 | 0.0084 | 0.0128 | |
| 0.0128 | 0.0164 | 0.0429 | 0.011 | 0.0344 | 0.0075 | ||||||
| 0.0825 | 0.0368 | 0.0351 | 0.0346 | 0.0127 | 0.0087 | 0.0084 | 0.0122 | 0.0133 | 0.0086 | 0.0135 | |
| 0.0136 | 0.0173 | 0.0663 | 0.0113 | 0.0347 | 0.0076 | ||||||
| 0.0238 | 0.0172 | 0.0132 | 0.013 | 0.0133 | 0.0119 | 0.0105 | 0.0447 | 0.0808 | 0.0108 | 0.0425 | |
| 0.0425 | 0.0851 | 0.084 | 0.0766 | 0.0783 | 0.0089 | ||||||
| 0.0106 | 0.0088 | 0.008 | 0.0078 | 0.008 | 0.0072 | 0.0066 | 0.008 | 0.0096 | 0.0069 | 0.0309 | |
| 0.0347 | 0.0104 | 0.012 | 0.0081 | 0.01 | 0.0064 | ||||||
| 0.0816 | 0.0745 | 0.0341 | 0.0322 | 0.0335 | 0.0286 | 0.0119 | 0.018 | 0.0845 | 0.0123 | 0.0922 | |
| 0.0793 | 0.0914 | 0.0873 | 0.0542 | 0.0795 | 0.0103 | ||||||
| 0.0101 | 0.0085 | 0.0077 | 0.0075 | 0.0077 | 0.007 | 0.0064 | 0.0078 | 0.0082 | 0.0066 | 0.0087 | |
| 0.0087 | 0.0295 | 0.0098 | 0.0078 | 0.0082 | 0.0062 | ||||||
| 0.0389 | 0.0637 | 0.0118 | 0.0109 | 0.012 | 0.0087 | 0.0076 | 0.0324 | 0.0198 | 0.0079 | 0.0354 | |
| 0.0355 | 0.0156 | 0.0358 | 0.0106 | 0.0127 | 0.0074 | ||||||
| R11 | 0.0122 | 0.0092 | 0.0099 | 0.0085 | 0.0087 | 0.0075 | 0.0069 | 0.0084 | 0.0303 | 0.0071 | 0.0102 |
| 0.0306 | 0.0316 | 0.0322 | 0.0084 | 0.0101 | 0.0067 | ||||||
| 0.017 | 0.0117 | 0.0104 | 0.0102 | 0.0105 | 0.0084 | 0.0089 | 0.0095 | 0.0337 | 0.0091 | 0.0338 | |
| 0.0266 | 0.0353 | 0.0678 | 0.0106 | 0.0704 | 0.0075 | ||||||
| 0.0099 | 0.0084 | 0.0075 | 0.0074 | 0.0075 | 0.0069 | 0.0063 | 0.0076 | 0.0081 | 0.0065 | 0.0085 | |
| 0.0085 | 0.0089 | 0.0096 | 0.0076 | 0.008 | 0.0061 | ||||||
| 0.0768 | 0.0132 | 0.031 | 0.0308 | 0.031 | 0.0085 | 0.0078 | 0.011 | 0.0328 | 0.0081 | 0.0319 | |
| 0.0322 | 0.0369 | 0.0169 | 0.0106 | 0.0128 | 0.0076 | ||||||
| 0.0369 | 0.0326 | 0.0108 | 0.0103 | 0.0109 | 0.0292 | 0.0077 | 0.0319 | 0.0146 | 0.0079 | 0.0348 | |
| 0.0349 | 0.0372 | 0.0369 | 0.0119 | 0.0139 | 0.0074 | ||||||
| 0.0367 | 0.033 | 0.0106 | 0.0101 | 0.0107 | 0.0089 | 0.0283 | 0.0117 | 0.0328 | 0.0285 | 0.0343 | |
| 0.0347 | 0.0355 | 0.0354 | 0.0305 | 0.0116 | 0.0076 | ||||||
| 0.1313 | 0.1102 | 0.102 | 0.1004 | 0.1024 | 0.0934 | 0.0139 | 0.1029 | 0.0568 | 0.0478 | 0.1118 | |
| 0.1119 | 0.0783 | 0.1191 | 0.1023 | 0.0388 | 0.0131 | ||||||
As it can be seen, only the factors whose interrelationship exceeds 0.05 are entered into the ANP questionnaire, and other relationships are considered to be zero due to their low importance. The initial relation matrix based on the above results is presented in Table 25.
Table 25.
The impact matrix (0, 1).
| 0 | 0 | 0 | 0 | 0 | 0 | 0 | 0 | 0 | 0 | 0 | 0 | 1 | 0 | 0 | 0 | 0 | |
| 1 | 0 | 0 | 0 | 0 | 0 | 0 | 0 | 0 | 0 | 1 | 1 | 0 | 0 | 0 | 0 | 0 | |
| 1 | 0 | 0 | 0 | 0 | 0 | 0 | 0 | 0 | 0 | 0 | 0 | 0 | 1 | 0 | 0 | 0 | |
| 1 | 0 | 0 | 0 | 0 | 0 | 0 | 0 | 0 | 0 | 0 | 0 | 0 | 0 | 0 | 0 | 0 | |
| 1 | 0 | 0 | 0 | 0 | 0 | 0 | 0 | 0 | 0 | 0 | 0 | 0 | 1 | 0 | 0 | 0 | |
| 0 | 0 | 0 | 0 | 0 | 0 | 0 | 0 | 1 | 0 | 0 | 0 | 1 | 1 | 1 | 1 | 0 | |
| 0 | 0 | 0 | 0 | 0 | 0 | 0 | 0 | 0 | 0 | 0 | 0 | 0 | 0 | 0 | 0 | 0 | |
| 1 | 1 | 0 | 0 | 0 | 0 | 0 | 0 | 1 | 0 | 1 | 1 | 1 | 1 | 1 | 1 | 0 | |
| 0 | 0 | 0 | 0 | 0 | 0 | 0 | 0 | 0 | 0 | 0 | 0 | 0 | 0 | 0 | 0 | 0 | |
| 0 | 1 | 0 | 0 | 0 | 0 | 0 | 0 | 0 | 0 | 0 | 0 | 0 | 0 | 0 | 0 | 0 | |
| R11 | 0 | 0 | 0 | 0 | 0 | 0 | 0 | 0 | 0 | 0 | 0 | 0 | 0 | 0 | 0 | 0 | 0 |
| 0 | 0 | 0 | 0 | 0 | 0 | 0 | 0 | 0 | 0 | 0 | 0 | 0 | 1 | 0 | 1 | 0 | |
| 0 | 0 | 0 | 0 | 0 | 0 | 0 | 0 | 0 | 0 | 0 | 0 | 0 | 0 | 0 | 0 | 0 | |
| 1 | 0 | 0 | 0 | 0 | 0 | 0 | 0 | 0 | 0 | 0 | 0 | 0 | 0 | 0 | 0 | 0 | |
| 0 | 0 | 0 | 0 | 0 | 0 | 0 | 0 | 0 | 0 | 0 | 0 | 0 | 0 | 0 | 0 | 0 | |
| 0 | 0 | 0 | 0 | 0 | 0 | 0 | 0 | 0 | 0 | 0 | 0 | 0 | 0 | 0 | 0 | 0 | |
| 1 | 1 | 1 | 1 | 1 | 1 | 0 | 1 | 1 | 0 | 1 | 1 | 1 | 1 | 1 | 0 | 0 |
Table 26 displays the normalized matrix.
Table 26.
The normalized matrix.
| 0 | 0 | 0 | 0 | 0 | 0 | 0 | 0 | 0 | 0 | 0 | 0 | 0.25 | 0 | 0 | 0 | 0 | |
| 0.142 | 0 | 0 | 0 | 0 | 0 | 0 | 0 | 0 | 0 | 0.333 | 0.333 | 0 | 0 | 0 | 0 | 0 | |
| 0.142 | 0 | 0 | 0 | 0 | 0 | 0 | 0 | 0 | 0 | 0 | 0 | 0 | 0.2 | 0 0 | 0 | ||
| 0.142 | 0 | 0 | 0 | 0 | 0 | 0 | 0 | 0 | 0 | 0 | 0 | 0 | 0 | 0 | 0 | 0 | |
| 0.142 | 0 | 0 | 0 | 0 | 0 | 0 | 0 | 0 | 0 | 0 | 0 | 0 | 0.2 | 0 | 0 | 0 | |
| 0 | 0 | 0 | 0 | 0 | 0 | 0 | 0 | 0.333 | 0 | 0 | 0 | 0.25 | 0.2 | 0.333 | 0.333 | 0 | |
| 0 | 0 | 0 | 0 | 0 | 0 | 0 | 0 | 0 | 0 | 0 | 0 | 0 | 0 | 0 | 0 | 0 | |
| 0.142 | 0.333 | 0 | 0 | 0 | 0 | 0 | 0 | 0.333 | 0 | 0.333 | 0.333 | 0.25 | 0.2 | 0.333 | 0.333 | 0 | |
| 0 | 0 | 0 | 0 | 0 | 0 | 0 | 0 | 0 | 0 | 0 | 0 | 0 | 0 | 0 | 0 | 0 | |
| 0 | 0.333 | 0 | 0 | 0 | 0 | 0 | 0 | 0 | 0 | 0 | 0 | 0 | 0 | 0 | 0 | 0 | |
| 0 | 0 | 0 | 0 | 0 | 0 | 0 | 0 | 0 | 0 | 0 | 0 | 0 | 0 | 0 | 0 | 0 | |
| 0 | 0 | 0 | 0 | 0 | 0 | 0 | 0 | 0 | 0 | 0 | 0 | 0 | 0.2 | 0 | 0.333 | 0 | |
| 0 | 0 | 0 | 0 | 0 | 0 | 0 | 0 | 0 | 0 | 0 | 0 | 0 | 0 | 0 | 0 | 0 | |
| 0.142 | 0 | 0 | 0 | 0 | 0 | 0 | 0 | 0 | 0 | 0 | 0 | 0 | 0 | 0 | 0 | 0 | |
| 0 | 0 | 0 | 0 | 0 | 0 | 0 | 0 | 0 | 0 | 0 | 0 | 0 | 0 | 0 | 0 | 0 | |
| 0 | 0 | 0 | 0 | 0 | 0 | 0 | 0 | 0 | 0 | 0 | 0 | 0 | 0 | 0 | 0 | 0 | |
| 0.142 | 0.333 | 1 | 1 | 1 | 1 | 0 | 1 | 0.333 | 0 | 0.333 | 0.333 | 0.25 | 0.2 | 0.333 | 0 | 0 |
Accordingly, the normalized weights of the risk impact matrix were determined. Then, in order to determine the weight of each risk, the risks were initially classified based on PMBOK standard into seven categories including time and cost, human resources, quality, contract, score, communication, and others, and the final risks of each index were determined in Fig. 6
Figure 6.

Risk-relation matrix based on DEMATEL results in fuzzy ANP software.
Once the model has been identified, the main categories should be compared and weighted first. Each group of risks is then compared and weighted. Categories with single risks are weighted 1. The three categories of quality, range and other risks have only one risk. In addition, two categories of human resources and contract have two risks, the weight of which was determined by experts in the questionnaire. In order to achieve the purpose of the research, paired comparisons questionnaires were designed and distributed among experts. According to the fuzzy approach in this study, the verbal expressions and fuzzy numbers in Table 27 were used.
Table 27.
Fuzzy spectrum and corresponding verbal expressions.
| No. | Verbal expressions | Fuzzy number |
|---|---|---|
| 1 | Totally equal preference | (1,1,1) |
| 2 | Almost equal preference | (0.5,1,1.5) |
| 3 | Low preference | (1,1.5,2) |
| 4 | Highly preference | (1.5,2,2.5) |
| 5 | Very High preference | (2,2.5,3) |
| 6 | Totally High preference | (2.5,3,3.5) |
In this section, according to Fig. 7, pairwise comparisons are made and using the modified method of [37], [38] [39], [35] the component weights were obtained and prioritized accordingly. In this software Gogus and Butcher method was used to calculate compatibility. The following tables show the geometric mean of expert opinions. In the last column of these tables, the special vector is shown. The following example tables for explaining how to calculate the eigen vector and the geometric mean.
Figure 7.

The final weight matrix for criteria in terms of oil exploration and exploitation risks.
The following figures and tables (see Fig. 8 and Tables 28, 29, 30, 31, 32, 33, 34 and 35) show the final weights for each risk category:
Figure 8.
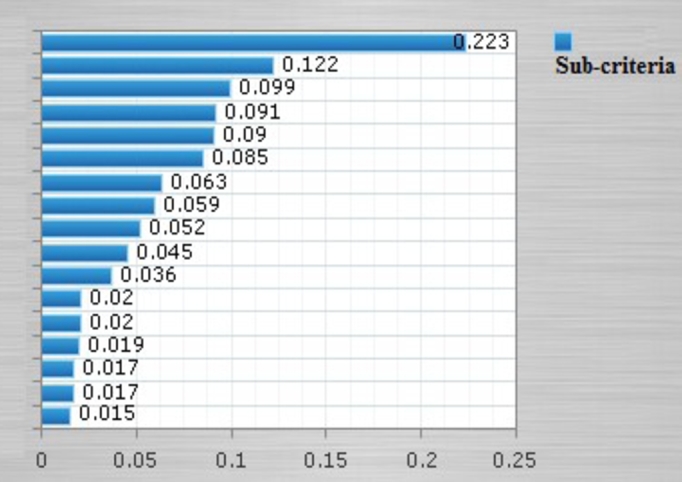
The final weight matrix for sub-criteria in terms of oil exploration and exploitation risks.
Table 28.
Mean paired comparisons to the risk of oil exploration and exploitation.
| Risks | Cost and Time | Human Resource | Quality | Contract | Scope | Others | Eigen Vector |
|---|---|---|---|---|---|---|---|
| Cost and Time | (1,1,1) | (1.5,2,2.5) | (0.5,1,1.5) | (1,1.5,2) | (2,2.5,3) | (1,1.5,2) | (0.174,0.243,0.306) |
| Human Resource | (0.4,0.5,0.667) | (1,1,1) | (0.5,0.667,1) | (0.667,1,2) | (0.5,0.667,1) | (0.5,0.667,1) | (0.092,0.118,0.17) |
| Quality | (0.667,1,2) | (1,1.5,2) | (1,1,1) | (1,1.5,2) | (0.5,1,1.5)) | (0.5,1,1.5) | (0.12,0.186,0.263) |
| Contract | (0.5,0.667,1) | (0.5,1,1.5) | (0.5,0.667,1) | (1,1,1) | (1,1.5,2) | (0.667,1,2) | (0.107,0.152,0.219) |
| Scope | (0.333,0.4,0.5) | (1,1.5,2) | (0.667,1,2) | (0.5,0.667,1) | (1,1,1) | (0.667,1,2) | (0.105,0.139,0.204) |
| Others | (0.5,0.667,1) | (1,1.5,2) | (0.667,1,2) | (0.5,1,1.5) | (0.5,1,1.5) | (1,1,1) | (0.107,0.162,0.234) |
Table 29.
Mean paired comparisons to Time and Cost.
| Time and Cost | |||||||||
|---|---|---|---|---|---|---|---|---|---|
| Eigen Vector | |||||||||
| (1,1,1) | (.5,.667,1) | (1.5,2,2.5) | (2,2.5,3) | (2,2.5,3) | (.5,1,1.5) | (2.5,3,3.5) | (.333,.4,.5) | (2,2.5,3) | |
| (2.5,3,3.5) | (.107,.137,.169) | ||||||||
| (1,1.5,2) | (1,1,1) | (2,2.5,3) | (2,2.5,3) | (2,2.5,3) | (1.5,2,2.5) | (2.5,3,3.5) | (1,1,1) | (2.5,3,3.5) | |
| (2.5,3,3.5) | (.15,.182,.212) | ||||||||
| (.4,.5,.667) | (.333,.4,.5) | (1,1,1) | (1,1,1) | (.5,1,1.5) | (.4,.5,.667) | (.5,1,1.5) | (.286,.333,.4) | (.5,.667,1) | |
| (1,1,1) | (.048,.061,.076) | ||||||||
| (.333,.4,.5) | (.333,.4,.5) | (1,1,1) | (1,1,1) | (1,1,1) | (.4,.5,.667) | (.667,1,2) | (.286,.333,.4) | (1,1,1) | |
| (1,1,1) | (.055,.062,.073) | ||||||||
| (.333,.4,.5) | (.333,.4,.5) | (.667,1,2) | (1,1,1) | (1,1,1) | (.4,.5,.667) | (.5,1,1.5) | (.286,.333,.4) | (.667,1,2) | |
| (1,1,1) | (.049,.062,.081) | ||||||||
| (.667,1,2) | (.4,.5,.667) | (1.5,2,2.5) | (1.5,2,2.5) | (1.5,2,2.5) | (1,1,1) | (.4,.5,.667) | (.286,.333,.4) | (.5,.667,1) | |
| (.667,1,2) | (.064,.082,.113) | ||||||||
| (.286,.333,.4) | (.286,.333,.4) | (.667,1,2) | (.5,1,1.5) | (.667,1,2) | (1.5,2,2.5) | (1,1,1) | (.286,.333,.4) | (.5,.667,1) | |
| (.667,1,2) | (.049,.066,.095) | ||||||||
| (2,2.5,3) | (1,1,1) | (2.5,3,3.5) | (2.5,3,3.5) | (2.5,3,3.5) | (2.5,3,3.5) | (2.5,3,3.5) | (1,1,1) | (2.5,3,3.5) | |
| (2.5,3,3.5) | (.181,.21,.239) | ||||||||
| (.333,.4,.5) | (.286,.333,.4) | (1,1.5,2) | (1,1,1) | (.5,1,1.5) | (1,1.5,2) | (1,1.5,2) | (.286,.333,.4) | (.22,.266,.309) | |
| (1,1.5,2) | (.058,.077,.095) | ||||||||
| (.286,.333,.4) | (.286,.333,.4) | (1,1,1) | (1,1,1) | (1,1,1) | (.5,1,1.5) | (.5,1,1.5) | (.286,.333,.4) | (.5,.667,1) | |
| (1,1,1) | (.05,.061,.073) | ||||||||
Table 30.
Mean paired comparisons to Time and Cost.
| Time and Cost | Human Resource | Quality | Contract | Others | Eigen Vector |
|---|---|---|---|---|---|
| Human Resource | (1,1,1) | (0.5,0.667,1) | (1,1.5,2) | (0.5,1,1.5) | (0.174,0.246,0.323) |
| Quality | (1,1.5,2) | (1,1,1) | (1,1.5,2) | (0.5,1,1.5) | (0.207,0.301,0.385) |
| Contract | (0.5,0.667,1) | (0.5,0.667,1) | (1,1,1) | (0.5,0.667,1) | (0.146,0.181,0.246) |
| Others | (0.667,1,2) | (0.667,1,2) | (1,1.5,2) | (1,1,1) | (0.201,0.272,0.413) |
Table 31.
Mean paired comparisons to Rl.
| Eigen Vector | |||||||||
|---|---|---|---|---|---|---|---|---|---|
| (1,1,1) | (.333,.4,.5) | (1,1,1) | (1,1,1) | (1,1,1) | (.4,.5,.667) | (.5,.667,1) | (.286,.333,.4) | (.067,.075,.086) | |
| (2,2.5,3) | (1,1,1) | (2,2.5,3) | (2,2.5,3) | (2,2.5,3) | (.5,1,1.5) | (2,2.5,3) | (.5,.667,1) | (.144,.187,.231) | |
| (1,1,1) | (.333,.4,.5) | (1,1,1) | (1,1,1) | (.5,1,1.5) | (.4,.5,.667) | (.667,1,2) | (.286,.333,.4) | (.064,.079,.099) | |
| (1,1,1) | (.333,.4,.5) | (1,1,1) | (1,1,1) | (1,1,1) | (.4,.5,.667) | (.667,1,2) | (.286,.333,.4) | (.065,.077,.099) | |
| (1,1,1) | (.333,.4,.5) | (.667,1,2) | (1,1,1) | (1,1,1) | (.333,.4,.5) | (.667,1,2) | (.286,.333,.4) | (0.065,0.077,0.099) | |
| (1.5,2,2.5) | (.667,1,2) | (1.5,2,2.5) | (1.5,2,2.5) | (2,2.5,3) | (1,1,1) | (2,2.5,3) | (.286,.333,.4) | (.125,.157,.2) | |
| (1,1.5,2) | (.333,.4,.5) | (.5,1,1.5) | (.5,1,1.5) | (.5,1,1.5) | (.333,.4,.5) | (1,1,1) | (.286,.333,0.4) | (.055,.081,.105) | |
| (2.5,3,3.5) | (1,1.5,2) | (2.5,3,3.5) | (2.5,3,3.5) | (2.5,3,3.5) | (2.5,3,3.5) | (2.5,3,3.5) | (1,1,1) | (.22,.266,.309) |
Table 32.
The result of mean paired comparisons to each risk and consistency/inconsistency of expert's opinions.
| Risks | Consistent or inconsistent | ||
|---|---|---|---|
| Time and Cost | 0.077 | 0.025 | consistent |
| Human Resource | 0.058 | 0.007 | consistent |
| Quality | 0.065 | 0.009 | consistent |
| Contract | 0.053 | 0.007 | consistent |
| Others | 0.061 | 0.013 | consistent |
Table 33.
The result of mean paired comparisons to each risk and consistency/inconsistency of expert's opinions.
| Risks | Consistent or inconsistent | ||
|---|---|---|---|
| 0.033 | 0.009 | consistent | |
| 0.094 | 0.029 | consistent | |
| 0.034 | 0.004 | consistent | |
| 0.027 | 0.009 | consistent | |
| 0.017 | 0.009 | consistent | |
| 0.073 | 0.025 | consistent | |
| 0.048 | 0.025 | consistent | |
| 0.049 | 0.014 | consistent | |
| 0.017 | 0.009 | consistent | |
| 0.036 | 0.014 | consistent | |
| 0.056 | 0.025 | consistent | |
| 0.036 | 0.007 | consistent | |
| 0.083 | 0.019 | consistent | |
| 0.043 | 0.014 | consistent | |
| 0.013 | 0.001 | consistent | |
| 0.065 | 0.009 | consistent | |
| 0.043 | 0.012 | consistent |
Table 34.
The final weight matrix for criteria in terms of oil exploration and exploitation risks.
| Final rank | Final fuzzy weight of components | Final fuzzy weight | Component |
|---|---|---|---|
| 1 | 0.286 | (0.179,0.28,0.417) | Cost and time |
| 6 | 0.115 | (0.071,0.111,0.179) | Human resources |
| 2 | 0.18 | (0.105,0.176,0.275) | Cost and time |
| 5 | 0.126 | (0.079,0.122,0.193) | Contract |
| 4 | 0.158 | (0.112,0.152,0.228) | Scope |
| 3 | 0.166 | (0.097,0.16,0.261) | Other risks |
Table 35.
The final weight matrix for sub-criteria in terms of oil exploration and exploitation risks.
| Final rank | Final fuzzy weight of components | Final fuzzy weight | Component |
|---|---|---|---|
| 5 | 0.09 | (0.06,0.085,0.136) | |
| 3 | 0.099 | (0.056,0.095,0.154) | |
| 12 | 0.02 | (0.009,0.018,0.04) | |
| 13 | 0.02 | (0.01,0.019,0.034) | |
| 14 | 0.019 | (0.008,0.018,0.036) | |
| 4 | 0.091 | (0.045,0.085,0.163) | |
| 17 | 0.015 | (0.008,0.014,0.028) | |
| 2 | 0.122 | (0.057,0.112,0.227) | |
| 11 | 0.036 | (0.017,0.032,0.068) | |
| 16 | 0.017 | (0.008,0.016,0.032) | |
| 7 | 0.063 | (0.027,0.058,0.119) | |
| 6 | 0.085 | (0.037,0.078,0.161) | |
| 15 | 0.017 | (0.008,0.016,0.032) | |
| 10 | 0.045 | (0.02,0.041,0.087) | |
| 9 | 0.052 | (0.024,0.048,0.095) | |
| 8 | 0.059 | (0.026,0.055,0.11) | |
| 1 | 0.223 | (0.107,0.209,0.397) |
As it can be seen, cost and time have the highest weight followed by quality risks and other major risks.
As it is shown, economic and political sanctions have the highest weight followed by the attraction of foreign investors and the lack of the regional infrastructure which occupied the second and third positions.
5. Conclusions
Neyr Perse Company is one of the most important companies in the field of exploration and exploitation of oil projects whose operations are always exposed to risks. Considering the importance and necessity of risk management in the company's projects, this study proposed a hybrid model of risks presented in the Project Management Body of Knowledge (PMBOK) in order to structure and rank these risks using the expert opinions. The results showed the weight factor (importance) of the risks under analysis. Accordingly, economic and political sanctions were found to have the highest weight followed by the attraction of foreign investors and the lack of the regional infrastructure which occupied the second and third positions. Based on the results and the qualitative and quantitative approach taken in this study, a couple of suggestions are provided to the officials of Neyr Perse Company:
-
1.
Managers of the company are recommended to plan and counteract the risks by continuously recognizing and assessing the company's risks. Without the use of scientific methods, the decisions made by the manager may deviate a lot from reality and compensating for themistakes made in the decision may be costly.
-
2.
Managers of the company can take decisions based on a combination of approaches derived from theories and previous studies, documentation, and global and national standards, risk management instructions such as PMBOK, as well as the opinions of the experts and managers of the company that are the result of their expertise and experience, and thus contribute to promoting the position of the company and the achievement of its goals.
-
3.
The structuring of identified risks helps managers analyze the extent to which the risks can affect and be affected and recognize that the degree to which the improvement in each of the risks can be effective in improving other risks. In this way, managers can identify the domino effect of risks and focus their attention on those risks whose improvement can change the entire model.
-
4.
There is no possibility of changing some of the risks for managers, and some of the risks have features that managers should pay attention to when making decisions. The use of multi-criteria decision-making techniques helps them to prioritize risks.
-
5.
Given the uncertainty in the risk management environment and the importance of using fuzzy logic to control ambiguity and complexity in this environment, a combination of techniques used with the fuzzy approach can help the company's manager to reduce the ambiguity and complexity inherent in decision making and get better and more realistic results by using verbal descriptions.
-
6.
Mixed approaches allow managers and decision makers to have a set of tools that can both take into account the collective opinions of experts and construct a structuring and ranking model using structuring and multi-criteria decision-making approaches in order to improve their decisions.
Declarations
Author contribution statement
B. Barghi: Conceived and designed the experiments; Performed the experiments; Analyzed and interpreted the data; Contributed reagents, materials, analysis tools or data; Wrote the paper.
S. Shadrokh: Conceived and designed the experiments; Performed the experiments; Contributed reagents, materials, analysis tools or data.
Funding statement
This research did not receive any specific grant from funding agencies in the public, commercial, or not-for-profit sectors.
Competing interest statement
The authors declare no conflict of interest.
Additional information
No additional information is available for this paper.
References
- 1.Chutia R., Gogoi M.K. Fuzzy risk analysis in poultry farming based on a novel similarity measure of fuzzy numbers. Appl. Soft Comput. 2018;66:60–76. [Google Scholar]
- 2.Muriana C., Vizzini G. Project risk management: a deterministic quantitative technique for assessment and mitigation. Int. J. Proj. Manag. 2017;35(3):320–340. [Google Scholar]
- 3.Razavi Falahieh S.M., Owlapour M., Abbasi Dezfuli A. The 9th International Congress of Civil Engineering. Isfahan University of Technology; Isfahan: 2012. Analysis of project risks using fuzzy logic in the case study of the project for the construction and operation of an oil desalination plant. [Google Scholar]
- 4.Alam Tabriz A., Hamzei E. Assessment and analysis of project risks using the mixed approach of PMBOK and RFMEA technique. J. Ind. Manag. Stud. 2011;19(23):1–19. [Google Scholar]
- 5.Taylan O., Bafail A.O., Abdulaal R.M., Kabli M.R. Construction projects selection and risk assessment by fuzzy AHP and fuzzy TOPSIS methodologies. Appl. Soft Comput. 2014;17:105–116. [Google Scholar]
- 6.Naderi F., Manteghi M., Safaei Moghaddam A. Risk identification and analysis of the fourth-generation engine project based on the PMBOK standard. J. Manag. Improv. 2014;8(23):107–128. [Google Scholar]
- 7.A. Haj shir Mohammadi, Project control and management: the application of CPM, GERT, PERT, PN, Jahad daneshgai, Esfahan University of Technology, 978–964-6122-17-8, 436, 2014.
- 8.M. Sabzeparvar, Project control, V.13, Vol. 24, 100, 2018.
- 9.Kumaraswamy M.M., Zhang X.Q. Governmental role in BOT-led infrastructure development. 2001;19:195–205. [Google Scholar]
- 10.Zhang Le-Yin. Economic development in Shanghai and the role of the State. Sage. 2003;40:1549–1572. [Google Scholar]
- 11.Ebrahimnejad S., Mousav S.M., Seyrafianpour H. Risk identification and assessment for build–operate–transfer projects: a fuzzy multi attribute decision making model. Expert Syst. Appl. 2010;37:575–586. [Google Scholar]
- 12.Williams T. A classified bibliography of recent research relating to project risk management. Eur. J. Oper. Res. 1995;85:18–38. [Google Scholar]
- 13.Project Management Body of Knowledge (PMBOK), 2016.
- 14.Colicchia Claudia, Strozzi Fernanda. Supply chain risk management: a new methodology for a systematic literature review. Supply Chain Manag. 2012;17:403–418. [Google Scholar]
- 15.Olfat L., Khosravan F., Jalali R. Identification and prioritization of project risk based on the PMBOK standard with fuzzy approach (Case Study: non-level crossway construction projects in Bushehr Province) Ind. Manag. Stud. 2010;8(19):147–163. [Google Scholar]
- 16.Bagheri S., Lotfi M.R. A model for implementing the risk management process in petroleum projects using the PMBOK standard. Stand. Qual. Manag. 2016;6:41–52. [Google Scholar]
- 17.Roudashti S.P.v., Jafarzadeh Haghighifard N., Yousefi H., Alirezaei M. The National Conference on Environmental Research in Iran, Hamedan: Shahid. Mofatheh University; 2013. The application of EFME PHA and AHP mixed method in environmental risk assessment: case study of the crude oil desalination plant. [Google Scholar]
- 18.Dziadosz A., Rejment M. Risk analysis in construction project-chosen methods. Proc. Eng. 2015;122:258–265. [Google Scholar]
- 19.Samantra C., Datta S., Mahapatra S.S. Fuzzy based risk assessment module for metropolitan construction project: an empirical study. Eng. Appl. Artif. Intell. 2017;65:449–464. [Google Scholar]
- 20.Eun Chang Soo, Chung Yong Woo, Han Dong Soo, Park Kwang Hyuk, Yoo Kyo-Sang, Park Choong Kee. Insulin therapy and colorectal adenoma risk among patients with type 2 diabetes mellitus: a case-control study in Korea. 2008;51:593–597. doi: 10.1007/s10350-007-9184-1. [DOI] [PubMed] [Google Scholar]
- 21.AlKazimi M., Grantham K. Investigating new risk reduction and mitigation in the oil and gas industry. J. Loss Prev. Process Ind. 2015;34:196–208. [Google Scholar]
- 22.KumarDey Prasanta. Managing project risks using combined analytic hierarchy process and risk map. Appl. Soft Comput. 2010;10:990–1000. [Google Scholar]
- 23.Zeng Jiahao, JohnSmith Nigel. Application of a fuzzy based decision making methodology to construction project risk assessment. Int. J. Proj. Manag. 2007;25:589–600. [Google Scholar]
- 24.Keshavarz Ghorabaee Mehdi, Amiri Maghsoud, Salehi Sadaghiani Jamshid, Hassani Goodarzi Golnoosh. Multiple criteria group decision-making for supplier selection based on COPRAS method with interval type-2 fuzzy sets. Int. J. Adv. Manuf. Technol. 2014;75(5–8):1115–1130. [Google Scholar]
- 25.Lin Chi-Jen, Wu Wei-Wen. A causal analytical method for group decision-making under fuzzy environment. Expert Syst. Appl. 2008;34:205–213. [Google Scholar]
- 26.Sun Yijian, Huang Rufu, Dailin Chen, Dailin Chen. Fuzzy set-based risk evaluation model for real estate projects. Tsinghua Sci. Technol. 2008;13:158–164. [Google Scholar]
- 27.Cheng Ching-Hsue, Lin Yin. Evaluating the best main battle tank using fuzzy decision theory with linguistic criteria evaluation. Eur. J. Oper. Res. 2002;142:174–186. [Google Scholar]
- 28.Nakhaei kamal abadi E., Bagheri M. The presentation of an outputting decision making model of productive operations by ANP and DEMATEL techniques in fuzzy environment. Ind. Manag. Mag. Hum. Sci. Coll. Azad Univ. Sannadaj Branch. 2008;5(2):27–46. [Google Scholar]
- 29.Ardeshira A., Mohajeria M., Amirib M. Evaluation of safety risks in construction using Fuzzy Failure Mode and Effect Analysis (FFMEA) Trans. A: Civ. Eng., Sci. Iran. 2016;23(6):2546–2556. [Google Scholar]
- 30.Dalalah D., Hayajneh M., Batieha F. A fuzzy multi-criteria decision making model for supplier selection. Expert Syst. Appl. 2011;38:8384–8391. [Google Scholar]
- 31.Baykasoğlu A., Kaplanoğlu V., Durmuşoğlu Zeynep D.U., Şahin C. Integrating fuzzy DEMATEL and fuzzy hierarchical TOPSIS methods for truck selection. Expert Syst. Appl. 2013;40:899–907. [Google Scholar]
- 32.Mohammadi lord A. 2009. Hierarchical and network analysis process. Tehran. [Google Scholar]
- 33.Chen Shi-Jay, Chen Shyi-Ming. Fuzzy risk analysis based on the ranking of generalized trapezoidal fuzzy numbers. Appl. Intell. 2007;26(1):1–11. [Google Scholar]
- 34.Jassbi J., Mohamadnejad F., Nasrollahzadeh H. A fuzzy DEMATEL framework for modeling cause and effect relationships of strategy map. Expert Syst. Appl. 2011;38:5967–5973. [Google Scholar]
- 35.Rezaei Jafar, Ortt Roland. Multi-criteria supplier segmentation using a fuzzy preference relations based AHP. Eur. J. Oper. Res. 2013;225:75–84. [Google Scholar]
- 36.Serrano-Gomez Luis, Munoz-Hernandez Jose Ignacio. Monte Carlo approach to fuzzy AHP risk analysis in renewable energy construction projects. PLoS ONE. 2019;14(6) doi: 10.1371/journal.pone.0215943. [DOI] [PMC free article] [PubMed] [Google Scholar]
- 37.Sami Farooq, O'Brien Chris. Risk calculations in the manufacturing technology selection process. Int. J. Manuf. Technol. Manag. 2010;21(1) [Google Scholar]
- 38.Kannan Devika, Lopes de Sousa Jabbour Ana Beatriz, Chiappetta Jabbour Charbel José. Selecting green suppliers based on GSCM practices: using fuzzy TOPSIS applied to a Brazilian electronics company. Eur. J. Oper. Res. 2014;233:432–447. [Google Scholar]
- 39.Zhu Bin, Xu Zeshui, Zhang Ren, Hong Mei. Generalized analytic network process. Eur. J. Oper. Res. 2015;244(1):277–288. [Google Scholar]