

Abstract
Rapamycin, an inhibitor of mTOR, is in clinical trials for treatment of cancer. Rapamycin resistance has been reported in human breast epithelial tumor cells. Rapamycin effects on mTOR signaling and resistance were examined using benign, premalignant and tumor human breast epithelial cells. Rapamycin inhibition of cell proliferation, the cell cycle and mTOR signaling, including p70S6 and S6RP phosphorylation, was most effective in benign (MCF10A) and premalignant (MCF10AT; MCF10ATG3B) human breast epithelial cells, relative to MCF10CA1a tumor cells. Rapamycin resistance was reflected by reduced inhibition of p70S6K and S6RP phosphorylation in MCF10CA1a tumor cells, with RS6P showing the least response to rapamycin in the tumor cells. Rapamycin differentially inhibited STAT3 phosphorylation in this cell lineage. These data suggest that inhibition of mTOR signaling and STAT3 phosphorylation in benign and premalignant cells may be effective in the treatment of proliferative breast disease (PBD) and in the prevention of tumorigenesis and tumor recurrence.
Keywords: Rapamycin, mTOR signaling, mTOR phosphorylation, STAT3 phosphorylation, biomarkers of resistance, p70S6 and RS6P, human breast epithelial cells, human breast premalignant and tumor epithelial cells, early events in breast tumorigenesis
Rapamycin was developed as an immunosuppressive drug to inhibit the proliferation of T and B lymphocytes, and has been identified as a potential therapeutic agent for treatment of cancer (1). The direct cellular target of rapamycin is FK-506 binding protein 12, FKBP12 (1). Binding of the FKBP12-rapamycin complex to mammalian target of rapamycin (mTOR) inhibits the mTOR-raptor interaction (2). However, a rapamycin-independent pathway (mTOR-Rictor) can also respond to rapamycin and cause hyperphosphorylation of Akt. Signaling through mTOR regulates transcriptional and translational machinery that controls energy utilization, cell growth and proliferation, and G1- to S-phase transition in the cell cycle (3).
mTOR directly phosphorylates eukaryotic initiation factor 4E (eIF4E)-binding protein 1 (4E-BP1). Hyperphosphorylated 4E-BP1 dissociates from eIF4E, thereby increasing the availability of eIF4E, which results in cap-dependent mRNA translation (4). Additional downstream targets of mTOR include the p70 S6 kinase (p70S6K) and the S6 ribosomal protein (S6RP), which regulate mRNA translation, including elongation factor-1α and ribosomal proteins (5), thereby promoting cell growth and division.
Signal transducer and activator of transcription (STAT3), another downstream target of mTOR (6) and an oncogene, is constitutively activated in a number of tumors, including breast cancer (7). Transcriptional activation of STAT3 is reportedly regulated by phosphorylation at Ser727 through mTOR (6) to activate transcription of target genes.
In the United States, breast cancer is the second leading cause of mortality among women. The risk for developing breast cancer in American women is estimated as one in seven (8). The MCF10A series of human breast epithelial cells includes the parent benign MCF10A (10A) cells, premalignant MCF10AT (10AT) and MCF10ATG3B (10ATG3B) cells, and fully malignant MCF10CA1a (10CA1a) tumor cells. These breast cell lines, all derived from the parent 10A cells, represent a temporal progression of alterations which constitute a model for proliferative breast disease (PBD) and carcinoma (9).
We previously reported a progressive increase in Ras protein levels and resistance to Fas-mediated apoptosis in this cell lineage (10). We showed that sensitivity to oxidative DNA damage by H2O2 decreased with increased risk of tumorigenicity and that DNA repair, p53 expression and elevated antioxidant enzyme levels contributed to these effects (11). The overall goal of the present study was to examine rapamycin effects on mTOR signaling in the MCF10A human breast epithelial cell lineage of benign, premalignant and tumor cells. The specific objectives were to determine whether rapamycin inhibition of p70S6K and S6RP phosphorylation served as a indicator of rapamycin resistance, and whether rapamycin inhibited STAT3 phosphorylation in these human breast epithelial cells.
Materials and Methods
Human breast epithelial cell lines
The MCF10A cell lineage was obtained from Dr. Fred Miller at Karmanos Cancer Institute (Detroit, MI, USA). MCF10A cells, the progenitor cell line of MCF10AT cell lineage, are spontaneously immortalized breast epithelial cells obtained from a patient with fibrocystic breast disease (12). MCF10A cells were stably transfected with a mutated T24 Ha-ras gene to generate MCF10AT cells (13), which when implanted s.c. in nude mice develop into carcinomas in about 25% of the cases over an extended period of time (14). MCF10ATG3B cells were generated from cells that have been through the process of transplantation in nude/beige mice and re-established in culture three times. These premalignant cells progress to ductal carcinoma in situ and ultimately progress to invasive carcinoma in ~25% of the cases within 6 to 8 weeks (9). The MCF10CA1a tumor cells, generated from a xenograft by trocar transplantation (9, 15), give rise to rapidly growing tumors with 100% efficacy.
Cell culture
MCF10A series cells were cultured as described elsewhere (10, 11).
Reagents
Antibodies against Akt, mTOR, p70S6, S6RP, eIF4E, 4E-BP1, Rb, STAT3 proteins and/or phosphoproteins were obtained from Cell Signaling Technology (Beverly, MA, USA). Cyclin D1, cyclin D3, cdk2, p21Waf1//cip1 antibodies were purchased from BD Transduction (San Jose, CA, USA) and cyclin E antibody was obtained from BD Pharmingen (San Jose, CA, USA). Rapamycin and anti-glyceradehyde-3-phosphate dehydrogenase (GAPDH) antibody were obtained from Calbiochem (San Diego, CA, USA).
Cell treatment and cell proliferation assays
Cell proliferation assays were performed by plating cells (1-2×10⁴ cells/ml) into 24-well plates. After an overnight incubation, triplicate wells were treated with rapamycin ranging from 1 to 100 nM for 48 h. The relative percentage of metabolically active cells was determined on the basis of mitochondrial conversion of 3-(4,5-dimethylthiazol-2-yl)-2,5-diphenyltetrazolium bromide to formazine, monitored at A550 nm. The percentage of metabolically active cells was compared with the percentage of control cells growing in the absence of rapamycin.
Flow cytometry
Cells were treated with 100 nM rapamycin for 48 h, harvested in 0.25% trypsin/0.1% EDTA, centrifuged for 5 min at 500 × g and 4°C, washed and fixed with 75% ethanol and then resuspended in 1 ml of propidium iodine staining solution (i.e. 50 μg/ml of propidium iodide, 100 U/ml of ribonuclease A and 0.1% glucose) for 1 h. Apoptotic cells were quantified on FACScalibur flow cytometer (Becton Dickinson, San Jose, CA, USA). Red fluorescence (measured at 585/542 nm), indicative of propidium iodide uptake by damaged cells, was measured by use of logarithmic amplification and electronic compensation for spectral overlap.
Immunoblot analysis
Cells were treated with 100 nM rapamycin for 1 and 24 h, then lysed and protein concentrations determined as described elsewhere (10, 11). Proteins (20-40 μg) were resolved by SDS-PAGE on a 6-15% gel, transferred to nitrocellulose (Pall Corporation, Ann Arbor, MI, USA) and immunoblot analysis performed as described elsewhere (10,11). Exposed films were scanned, and the protein band density quantified using KODAK 1D Image Analysis (Eastman Kodak Company, Rochester, NY, USA) and normalized to GAPDH.
Statistical analysis
Statistical significance was determined by analysis of variance, followed by a Tukey-Kramer multiple comparison analysis.
Results
Rapamycin differentially affects 10A, 10AT, 10ATG3B and 10CA1a cell proliferation
Proliferation of 10A, 10AT and 10ATG3B cells was inhibited by rapamycin in a concentration-dependent manner (Figure 1). Rapamycin inhibition of 10A, 10AT and 10ATG3B cell proliferation was 48%, 58% and 53% at 100 nM rapamycin, respectively. In contrast, rapamycin inhibited 10CA1a cell proliferation by ~26%, showing that the tumor cells were more resistant to rapamycin than both benign (10A) and premalignant (10AT, 10ATG3B) cells (Figure 2).
Figure 1.
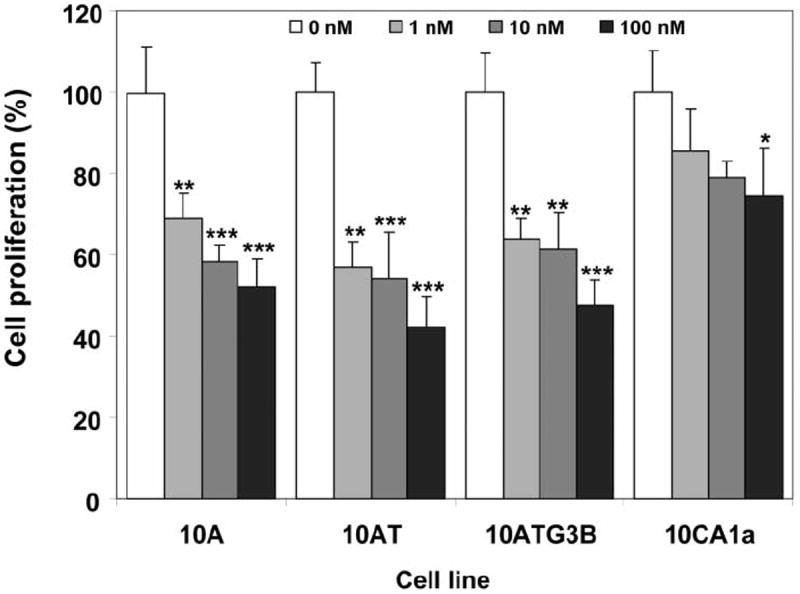
Inhibition of cell growth by rapamycin. Cells were treated with rapamycin for 48 h and cell viability was determined as described in Materials and Methods. Columns and error bars represent the mean±SE of three separate experiments at each concentration. (*) indicates significant difference from control at p<0.05; (**) indicates significant difference from control at p<0.01; (***) indicates significant difference from control at p<0.001.
Figure 2.
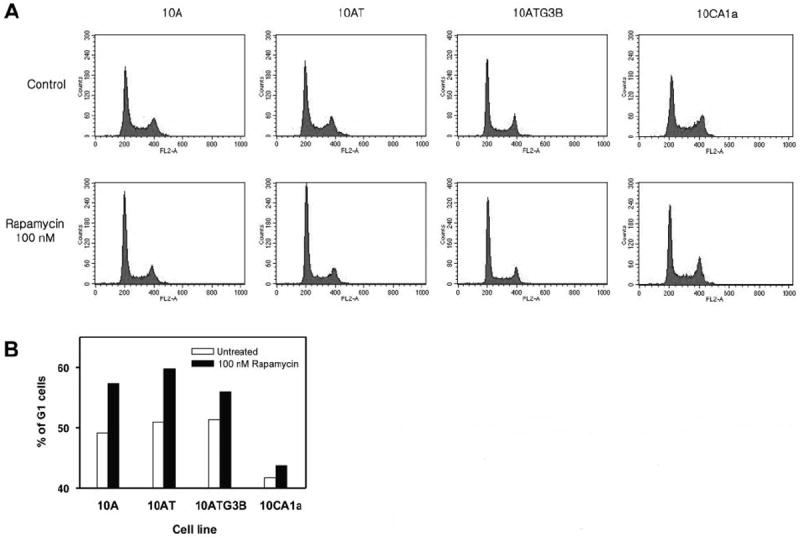
Differential effects of rapamycin on cell cycle progression in MCF10A cell lineage. Cells were incubated with or without 100 nM rapamycin for 48 h and prepared as described in Materials and Methods. Panel A: Histogram showing relative DNA content as determined by flow cytometry. Panel B: The increased percentage of cells in the G1-phase of the cell cycle was determined from the histogram.
Rapamycin differentially alters the cell cycle
Following 48-h treatment with 100 nM rapamycin, the percentage of cells in the G1-phase increased in 10A, 10AT and 10ATG3B cells by 16.6%, 17.5% and 9.2%, respectively (Figure 2A, B). In contrast, rapamycin increased the percentage of 10CA1a tumor cells in G1 only by 4.9% (Figure 2A, B). No evidence of apoptotic cells in the subG1 peak was detected in the MCF10A cell lineage under these conditions (Figure 2A). These results reveal that rapamycin inhibited cell proliferation through G1 cell cycle arrest, which was accompanied by a decrease in S-phase progression, and that the 10CA1a tumor cells were more resistant to rapamycin-mediated cell cycle arrest.
Rapamycin alters Akt, mTOR and downstream target protein and phosphoprotein levels
Rapamycin produced a time-dependent decrease in phospho-mTOR levels in 10A, 10ATG3B and 10CA1a cells by 30% to 40%, with little effect observed for 10AT cells (Figure 3). The rapamycin-independent component (i.e. Rictor) of the mTOR signaling cascade induced hyperphosphorylation of Akt (Ser473) in response to rapamycin, in a time-dependent manner, with the greatest increase occurring in the benign 10A cells, followed by the premalignant 10AT and 10ATG3B cells, with only minimal changes noted for 10CA1a tumor cells (Figure 3).
Figure 3.
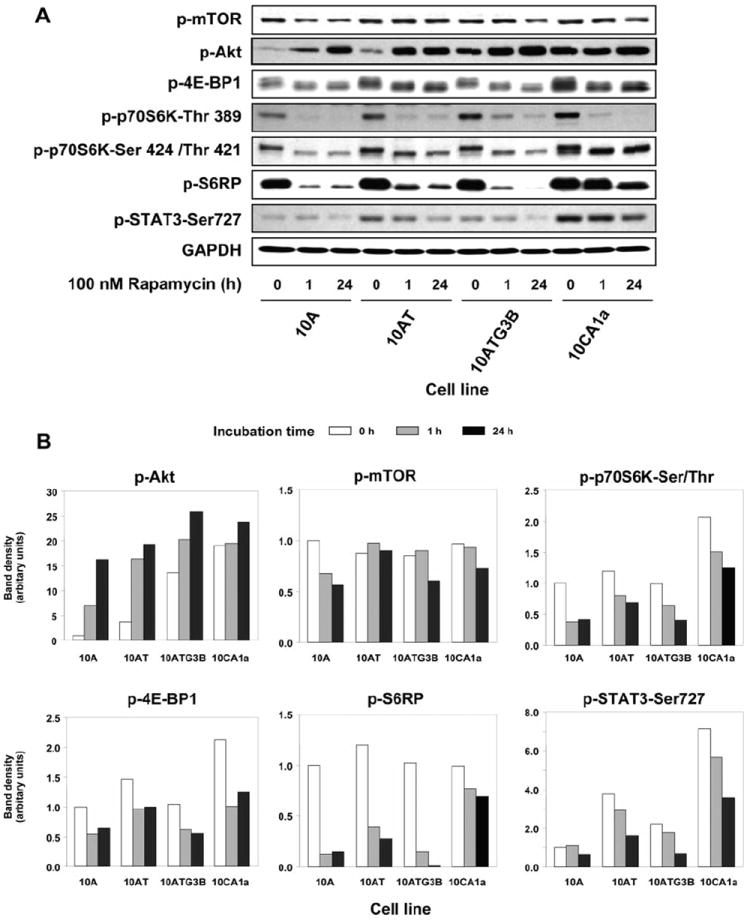
Rapamycin effects on Akt, mTOR and its downstream targets in MCF10A cell lineage. Panel A: Immunoblot analysis of phospho-mTOR, phospho-Akt, phospho-4E-BP1, phospho-p70S6K (Thr389 and Thr421/Ser424), phospho-S6RP, and phospho-STAT3 (Ser727) protein levels following the treatment of each cell with 100 nM rapamycin for 1 and 24 h. Panel B: Scanning laser densitometry analysis of immunoblot band density. Rapamycin was least effective in inhibiting phospho-p70S6K and phospho-S6RP in the 10CA1a tumor cells.
Immunoblot analysis of 4E-BP1 and phospho-4E-BP1 generally reveals one to three separate bands (16) (Figure 3 and 4). Rapamycin reduced phospho-4E-BP1 with a notable shift of bands towards a faster migrating species (16), showing that rapamycin inhibited 4E-BP1 phosphorylation in this cell lineage.
Figure 4.
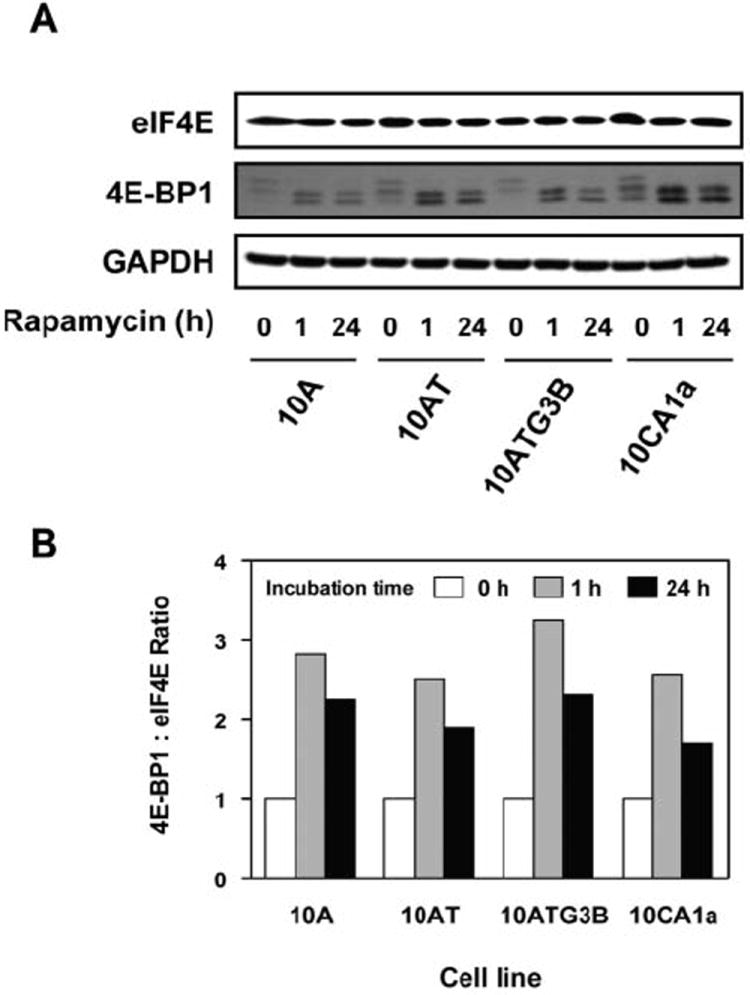
Rapamycin effects on eIF4E and 4E-BP1 in the MCF10A cell lineage. Panel A: Immunoblot analysis of 4E-BP1 and eIF4E protein levels following the treatment of each cell with 100 nM of rapamycin for 1 and 24 h. Panel B: 4E-BP1:eIF4E ratios were determined using band density of each cell line after treatment with 100 nM rapamycin for 1 and 24 h.
Phospho-p70S6K (Thr389) levels decreased to barely detectable levels in response to rapamycin in all cell lines (Figure 3A). Phospho-p70S6K (Ser424/Thr421) levels also progressively declined in 10A, 10AT and 10ATG3B cells in response to rapamycin, with minimal effects noted for 10CA1a tumor cells (Figure 3).
Rapamycin markedly reduced phospho-S6RP levels in 10A, 10AT and 10ATG3B cells (67-99% decrease), but had substantially less effect in 10CA1a cells (22-30% decrease) (Figure 3), suggesting that S6RP may be a biomarker of rapamycin resistance. The inhibitory effects of rapamycin on phospho-p70S6K and phospho-S6RP paralleled the effects of rapamycin on cell proliferation (Figure 1) and cell cycle progression (Figure 2).
Phospho-STAT3 (Ser727) levels generally increased in the MCF10A cell lineage, with the greatest increase occurring in 10CA1a cells (Figure 4). Rapamycin produced a progressive and time-dependent decrease in phospho-STAT3 (Ser727) levels. Rapamycin was least effective in reducing phospho-STAT3 levels in the benign cells and 10CA1a tumor cells, and most effective in the premalignant 10AT and 10ATG3B cells at 24 h (Figure 3A, B).
4E-BP1:eIF4E ratio as an indicator of the sensitivity to rapamycin
The 4E-BP1:eIF4E ratio was reported to be an index of rapamycin sensitivity (17). The basal protein levels of eIF4E were comparable in the MCF10A cell lineage (Figure 4A). However, 4E-BP1 protein levels increased significantly in 10A (2.6- to 3.0-fold), 10AT (1.7- to 2.2-fold), 10ATG3B (2.6- to 3.8-fold) and 10CA1a (1.4- to 1.8-fold) cells in response to rapamycin (Figure 4). The ratio of 4E-BP1:eIF4E increased markedly (1.71- to 3.26-fold) for the MCF10A cell lineage following treatment with rapamycin. These data suggest that the entire MCF10A cell lineage should be sensitive to rapamycin. This is not the case, however, for rapamycin effects on 10CA1a tumor cell proliferation or cell cycle arrest. Thus, the 4E-BP1:eIF4E ratio is not an index of rapamycin sensitivity in these cells.
Rapamycin-mediated inhibition of signaling in G1/S cell cycle checkpoint
Cell cycle-dependent phosphorylation by cdks inhibits Rb target binding, thus allowing cell cycle progression (18). The levels of Rb protein were significantly reduced in each of the cell lines at 24 h post rapamycin treatment (Figure 5A, B). The levels of phospho-Rb (Ser 780, Ser 795 and Ser 807/811) also differentially decreased in all four cell lines at 24 h after rapamycin treatment (Figure 5).
Figure 5.
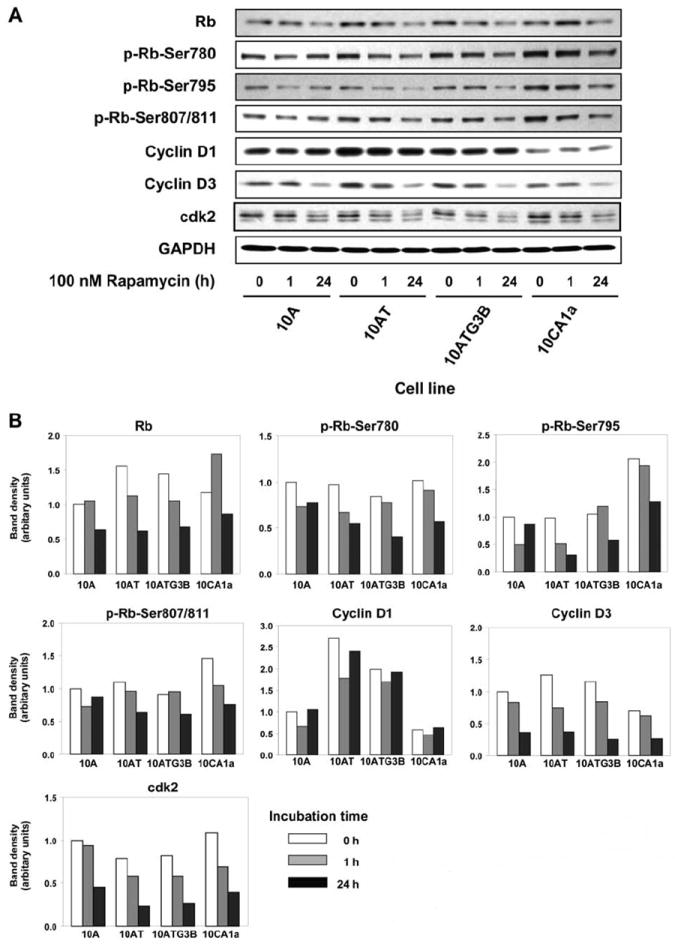
Rapamycin effects on the expression of proteins involved in the regulation of the cell cycle in the MCF10A cell lineage. Panel A: Immunoblot analysis of cyclin D1, cyclin D3, cdk2, Rb and phospho-Rb (Ser780, Ser795 and Ser807/811) in each cell line treated with 100 nM rapamycin for 1 and 24h.
Even though cyclin D1 levels were elevated in the 10AT and 10ATG3B cells, and lower in the 10CA1a cells, relative to the parent 10A cells (Figure 5), rapamycin had no notable effect. No major differences were observed in cyclin D3 levels in the cell lineage, although rapamycin treatment effectively reduced cyclin D3 levels in all the cell lines by ~60 to 70% at 24 h. Cyclin E expression was not affected by rapamycin (data not shown).
No major differences in basal cdk2 (or cdk4; data not shown) protein levels were observed in the MCF10A cell lineage. However, rapamycin reduced cdk2 protein levels in the 10A, 10AT, 10ATG3B and 10CA1a cells by 55.0, 70.3, 68.2 and 63.6%, respectively, relative to untreated controls (Figure 5).
The cdk-inhibitory protein, p21Waf1/Cip1, was inhibited by 57.4, 58.9 and 52.9% in the 10A, 10AT and 10ATG3B cells, respectively, following rapamycin treatment, with p21Waf1/Cip1 only weakly expressed in 10CA1a cells (data not shown). These data show that the changes of p21Waf1/Cip1, cyclin D3 and cdk2 levels in response to rapamycin occur to a comparable degree in benign, premalignant and tumor cells.
Discussion
Breast, prostate and small cell lung cancer, glioblastoma, and T-cell leukemia have been among those malignancies reported to be the most responsive to rapamycin therapy in preclinical studies (1). Hyperphosphorylation of Akt by rapamycin has been reported for many cancer cell lines, including, DU-145, MCF-7 (19), SkBR3, BT474 and rhabdomyosarcoma line Rh30 (20). Inhibition of mTOR reportedly induces Akt phosphorylation in human tumors in vivo (20). HER2/neu overexpression, enhances rapamycin sensitivity in NIH3T3 cells (21) and a significant decrease in rapamycin sensitivity was noted in dominant negative-Akt-transfected cells (16). These data suggest that activation of Akt/mTOR signaling is associated with increased rapamycin sensitivity. However, the 10CA1a tumor cells, which exhibit markedly elevated basal phospho-Akt levels, were not as sensitive to rapamycin as either the benign or premalignant cells of this cell lineage.
Rapamycin inhibition of phospho-p70S6K (Ser424/ Thr421) and phospho-S6RP supports the analysis that p70S6K and S6RP phosphorylation are regulated by the rapamycin-sensitive mTOR, GβL and raptor complex and these data correlate with rapamycin inhibition of cell proliferation and cell cycle arrest. The phosphorylation of 4E-BP1, S6RP, p70S6K and STAT3 was effectively inhibited by rapamycin in MCF10A cell lineage, but only phospho-p70S6K (Ser424/Thr421) and, more strikingly, phospho-S6RP strongly correlated with rapamycin sensitivity. Premalignant cells are more responsive to rapamycin than tumor cells, suggesting that rapamycin, either alone or in combination with other therapies (e.g. tamoxifen) may have a role in the treatment of PBD and in the prevention of breast cancer or breast cancer recurrence. Rapamycin effectively inhibited phospho-STAT3 in the MCF10A cell lineage. These data suggest that rapamycin inhibition of mTOR signaling may achieve additional beneficial therapeutic effects in the treatment of breast cancer and prevention of tumorigenesis or tumor recurrence.
Acknowledgments
This work was supported by NIH grant ES10595 (RF Novak) from the National Institute of Environmental Health and Sciences and, in part, by EHS Center grant P30 ES06639, through the services of the Cell Culture and Gene Transfer Facility Core and the Imaging and Cytometry Core.
Abbreviations
- 10A
MCF10A
- 10AT
MCF10AT
- 10ATG3B
MCF10ATG3B
- 10CA1a
MCF10CA1a
- PBD
proliferative breast disease
- mTOR
mammalian target of rapamycin
- p70S6K
p70 S6 kinase
- eIF4E
eukaryotic initiation factor 4E
- 4E-BP1
eIF4E-binding protein 1
- STAT3
signal transducer and activator of transcription 3
- cdk
cyclin-dependent kinase
- S6RP
S6 ribosomal protein
- Rb
retinoblastoma
- FKBP12
FK-506 binding protein 12
- PI3K
phosphatidylinositol 3 kinase
- GAPDH
glyceraldehyde-3-phosphate dehydrogenase
References
- 1.Hidalgo M, Rowinsky EK. The rapamycin-sensitive signal transduction pathway as a target for cancer therapy. Oncogene. 2000;19:6680–6686. doi: 10.1038/sj.onc.1204091. [DOI] [PubMed] [Google Scholar]
- 2.Oshiro N, Yoshino K, Hidayat S, Tokunaga C, Hara K, Eguchi S, Avruch J, Yonezawa K. Dissociation of raptor from mTOR is a mechanism of rapamycin-induced inhibition of mTOR function. Genes Cells. 2004;9:359–366. doi: 10.1111/j.1356-9597.2004.00727.x. [DOI] [PubMed] [Google Scholar]
- 3.Mita MM, Mita A, Rowinsky EK. Mammalian target of rapamycin: a new molecular target for breast cancer. Clin Breast Cancer. 2003;4:126–137. doi: 10.3816/cbc.2003.n.018. [DOI] [PubMed] [Google Scholar]
- 4.Dufner A, Andjelkovic M, Burgering BM, Hemmings BA, Thomas G. Protein kinase B localization and activation differentially affect S6 kinase 1 activity and eukaryotic translation initiation factor 4E-binding protein 1 phosphorylation. Mol Cell Biol. 1999;19:4525–4534. doi: 10.1128/mcb.19.6.4525. [DOI] [PMC free article] [PubMed] [Google Scholar]
- 5.Jefferies HB, Fumagalli S, Dennis PB, Reinhard C, Pearson RB, Thomas G. Rapamycin suppresses 5’TOP mRNA translation through inhibition of p70s6k. EMBO J. 1997;16:3693–3704. doi: 10.1093/emboj/16.12.3693. [DOI] [PMC free article] [PubMed] [Google Scholar]
- 6.Yokogami K, Wakisaka S, Avruch J, Reeves SA. Serine phosphorylation and maximal activation of STAT3 during CNTF signaling is mediated by the rapamycin target mTOR. Curr Biol. 2000;10:47–50. doi: 10.1016/s0960-9822(99)00268-7. [DOI] [PubMed] [Google Scholar]
- 7.Clevenger CV. Roles and regulation of STAT family transcription factors in human breast cancer. Am J Pathol. 2004;165:1449–1460. doi: 10.1016/S0002-9440(10)63403-7. [DOI] [PMC free article] [PubMed] [Google Scholar]
- 8.Jemal A, Tiwari RC, Murray T, Ghafoor A, Samuels A, Ward E, Feuer EJ, Thun MJ. Cancer statistics. CA Cancer J Clin. 2004;54:8–29. doi: 10.3322/canjclin.54.1.8. [DOI] [PubMed] [Google Scholar]
- 9.Dawson PJ, Wolman SR, Tait L, Heppner GH, Miller FR. MCF10AT: a model for the evolution of cancer from proliferative breast disease. Am J Pathol. 1996;148:313–319. [PMC free article] [PubMed] [Google Scholar]
- 10.Starcevic SL, Elferink C, Novak RF. Progressive resistance to apoptosis in a cell lineage model of human proliferative breast disease. J Natl Cancer Institute. 2001;93:776–782. doi: 10.1093/jnci/93.10.776. [DOI] [PubMed] [Google Scholar]
- 11.Starcevic SL, Diotte NM, Zukowski KL, Cameron MJ, Novak RF. Oxidative DNA damage and repair in a cell lineage model of human proliferative breast disease (PBD) Toxicol Sci. 2003;75:74–81. doi: 10.1093/toxsci/kfg154. [DOI] [PubMed] [Google Scholar]
- 12.Soule HD, Maloney TM, Wolman SR, Peterson WD, Brenz R, McGrath CM, Russo J, Pauley RJ, Jones RF, Brooks SC. Isolation and characterization of a spontaneously immortalized human breast epithelial cell line, MCF-10. Cancer Res. 1990;50:6075–6086. [PubMed] [Google Scholar]
- 13.Russo J, Tait L, Russo IH. Morphological expression of cell transformation induced c-Ha-ras oncogene in human breast epithelial cells. J Cell Sci. 1991;99:453–463. doi: 10.1242/jcs.99.2.453. [DOI] [PubMed] [Google Scholar]
- 14.Miller FR, Soule HD, Tait L, Pauley RJ, Wolman SR, Dawson PJ, Heppner GH. Xenograft model of progressive human proliferative breast disease. J Natl Cancer Inst. 1993;85:1725–1732. doi: 10.1093/jnci/85.21.1725. [DOI] [PubMed] [Google Scholar]
- 15.Santner SJ, Dawson PJ, Tait L, Soule HD, Eliason J, Mohamed AN, Wolman SR, Heppner GH, Miller F. Malignant MCF10CA1 cell lines derived from premalignant human breast epithelial MCF10AT cells. Breast Cancer Res Treat. 2001;65:101–110. doi: 10.1023/a:1006461422273. [DOI] [PubMed] [Google Scholar]
- 19.Noh WC, Mondesire WH, Peng J, Jian W, Zhang H, Dong J, Mills GB, Hung MC, Meric-Bernstam F. Determinants of rapamycin sensitivity in breast cancer cells. Clin Cancer Res. 2004;10:1013–1023. doi: 10.1158/1078-0432.ccr-03-0043. [DOI] [PubMed] [Google Scholar]
- 20.Dilling MB, Germain GS, Dudkin L, Jayaraman AL, Zhang X, Harwood FC, Houghton PJ. 4E-binding proteins, the suppressors of eukaryotic initiation factor 4E, are down-regulated in cells with acquired or intrinsic resistance to rapamycin. J Biol Chem. 2002;277:13907–13917. doi: 10.1074/jbc.M110782200. [DOI] [PubMed] [Google Scholar]
- 21.Knudsen ES, Wang JY. Dual mechanisms for the inhibition of E2F binding to RB by cyclin-dependent kinase-mediated RB phosphorylation. Mol Cell Biol. 1997;17:5771–5783. doi: 10.1128/mcb.17.10.5771. [DOI] [PMC free article] [PubMed] [Google Scholar]
- 22.Sun SY, Rosenberg LM, Wang X, Zhou Z, Yue P, Fu H, Khuri FR. Activation of Akt and eIF4E survival pathways by rapamycin-mediated mammalian target of rapamycin inhibition. Cancer Res. 2005;65:7052–7058. doi: 10.1158/0008-5472.CAN-05-0917. [DOI] [PubMed] [Google Scholar]
- 23.O’Reilly KE, Rojo F, She QB, Solit D, Mills GB, Smith D, Lane H, Hofmann F, Hicklin DJ, Ludwig DL, Baselga J, Rosen N. mTOR inhibition induces upstream receptor tyrosine kinase signaling and activates Akt. Cancer Res. 2006;66:1500–1508. doi: 10.1158/0008-5472.CAN-05-2925. [DOI] [PMC free article] [PubMed] [Google Scholar]
- 24.Meric F, Hung MC, Hortobagyi GN, Hunt KK. HER2/neu in the management of invasive breast cancer. J Am Coll Surg. 2002;194:488–501. doi: 10.1016/s1072-7515(02)01121-3. [DOI] [PubMed] [Google Scholar]