

Abstract
Retinopathy of prematurity (ROP) is a disorder of the developing retina of preterm infants. ROP can lead to blindness because of abnormal angiogenesis that is the result of suspended vascular development and vaso-obliteration leading to severe retinal stress and hypoxia. We tested the hypothesis that the use of the human progenitor cell combination, bone marrow–derived CD34+ cells and vascular wall–derived endothelial colony–forming cells (ECFCs), would synergistically protect the developing retinal vasculature in a mouse model of ROP, called oxygen-induced retinopathy (OIR). CD34+ cells alone, ECFCs alone, or the combination thereof were injected intravitreally at either P5 or P12 and pups were euthanized at P17. Retinas from OIR mice injected with ECFCs or the combined treatment revealed formation of the deep vascular plexus (DVP) while still in hyperoxia, with normal-appearing connections between the superficial vascular plexus (SVP) and the DVP. In addition, the combination of cells completely prevented aberrant retinal neovascularization and was more effective anatomically and functionally at rescuing the ischemia phenotype than either cell type alone. We show that the beneficial effects of the cell combination are the result of their ability to orchestrate an acceleration of vascular development and more rapid ensheathment of pericytes on the developing vessels. Lastly, our proteomic and transcriptomic data sets reveal pathways altered by the dual cell therapy, including many involved in neuroretinal maintenance, and principal component analysis (PCA) showed that cell therapy restored OIR retinas to a state that was closely associated with age-matched normal retinas. Together, these data herein support the use of dual cell therapy as a promising preventive treatment for the development of ROP in premature infants.
Keywords: Angiogenesis, Stem cells
Keywords: Adult stem cells, hypoxia
Combined use of two human progenitor cell populations synergistically protected the developing retinal vasculature in a murine model of retinopathy of prematurity.
Introduction
Normal retinal vascular development is dependent on physiologic hypoxia that develops in utero and creates growth factor gradients that direct vascular sprouts to extend toward avascular regions of the retina (1). Retinopathy of prematurity (ROP), one of the most common causes of childhood blindness, occurs in severely preterm neonates treated with supplemental oxygen, which eliminates this physiologic hypoxia and thus disrupts normal retinal vascular development (2). As a result, the peripheral retina is rendered avascular and the density of the deep vascular plexuses is greatly reduced (3). On cessation of treatment with supplemental oxygen, the neonatal retina rapidly becomes pathologically hypoxic because it lacks the normal vessel structure required for function at atmospheric oxygen levels. Consequently, angiogenic pathways become activated and result in aberrant neovascularization that may lead to retinal detachment and permanent vision loss (3). To date, none of the current therapies serves to correct the underlying pathology (i.e., abnormal vessel development) and all have suboptimal efficacies that leave a substantial clinical need unmet (2).
Most preclinical studies on ROP have used neonatal rodents, which compared to humans, are naturally born “preterm.” This means that many of the developmental milestones that happen in utero in humans occur postgestationally in rodents; this includes retinal vascular development that begins around postnatal day 1 (P1) and is completed by P21 in mice (4). Similar to ROP in humans, OIR in rodents is induced by prolonged exposure to hyperoxia, which inhibits normal retinal vascular development and causes rapid growth of neovascularization on return to atmospheric oxygen (5). The OIR model recapitulates key phases of the human disease and represents an immature vascular system with inherent vascular plasticity, as is the case in human infants with ROP.
A growing body of evidence suggests that reparative vasculogenesis in the retina is a promising option for patients with ROP. Proangiogenic CD34+ cells have been extensively studied as progenitor cells capable of contributing to retinal revascularization and can be isolated from peripheral blood, bone marrow, and importantly, umbilical cord blood (6). Our group has shown that healthy CD34+ cells home to areas of injury in both diabetic retinas and ischemia/reperfusion-injured retinas of mice (7, 8), thus suggesting that these cells may represent a promising candidate for a cell therapy approach in infants with ROP because cord blood is an excellent source of these cells.
A second important population of cells possessing vascular reparative activity is endothelial colony–forming cells (ECFCs) (9). ECFCs, also called outgrowth endothelial cells, represent bona fide endothelial progenitor cells (10). ECFCs have a remarkably high proliferative capacity in comparison with CD34+ cells and maintain an endothelial phenotype throughout ex vivo long-term expansion (11). We have shown that ECFCs integrate with rat retinal endothelial cells in a monolayer culture and form capillary tubes in 3D culture (8, 12, 13). Moreover, various groups have demonstrated that ECFCs possess in vivo potential by directly aiding vascular repair and forming well-perfused vasculature in various in vivo models (14). ECFCs have been shown to correct retinal ischemia when delivered intravitreally into mouse models (8). In addition, ECFCs injected into the systemic circulation of SCID mice are able to home to and survive in 9 different vascular beds for up to 7 months without inducing thrombosis or infarcts (13). Interestingly, when an acute vascular injury was induced in the peripheral vasculature of nude mice, the combination of CD34+ cells and ECFCs enhanced vascular repair and regeneration and resulted in a significant synergistic effect on revascularization above the results measured with either cell population alone (15).
In this study, we expand on these findings and combine the use of CD34+ cells and ECFCs to rescue experimentally induced avascular ischemic retinas in the mouse model of human ROP. We show that the beneficial effect is the result of restoration of normal retinal vascular development and increased pericyte ensheathment. This observation has potential implications for the treatment of ROP and other ischemic retinopathies.
Results
Combined treatment with CD34+ cells and ECFCs reduces vaso-obliteration and neovascularization in OIR mice.
To test the hypothesis that combined use of CD34+ and ECFCs synergistically protect the developing retinal vasculature from hyperoxia-induced injury, CD34+ cells alone, ECFCs alone, or a combination of the 2 cell types were injected intravitreally at P12 following hyperoxia exposure and pups were euthanized at P17. CD31brightCD34+CD146+CD45−AC133− were used as the markers for ECFCs. Figure 1A shows representative images of flat-mounted retinas stained for collagen IV to visualize the retinal vessels. While isolectin B4 is the standard choice for staining the vasculature in the OIR model, we chose collagen IV since it gives similar results and no significant difference in determining percentage of vaso-obliteration while providing a stronger signal (Supplemental Figure 1; supplemental material available online with this article; https://doi.org/10.1172/jci.insight.129224DS1). Areas of vaso-obliteration (inset, yellow) and neovascularization (inset, blue) were quantified for each of the treatment groups (Figure 1B). All 3 conditions showed a significant decrease in vaso-obliteration and neovascularization compared with age-matched littermate controls injected with saline. With this injection timeframe (P12–P17), the combination treatment with CD34+/ECFCs did not provide additional protection compared with either cell type alone.
Figure 1. Reparative responses in the retina following injection of CD34+ cells, ECFCs, or the combination of both cell types at P12 and euthanized at P17.

(A) Flat-mounted retinas from OIR pups injected on P12 and euthanized on P17, stained for collagen IV to visualize the retinal vessels. Insets: areas of vaso-obliteration (yellow) and neovascularization (blue) are shown. (B) Summary of quantification of P12/P17 vaso-obliteration and neovascularization areas. Scale bar: 100 μm. All data were assessed using 1-way ANOVA. When the results were significant, we determined which means differed from each other using Tukey’s multiple-comparisons test. Values are expressed as percentage of total retina ± SEM, n = 10–12 mice for each data set. Only significant comparisons are shown in the figures.
We next tested the hypothesis that by altering the time of injection to before hyperoxia exposure, the CD34+/ECFCs combination would provide protection to the retinal vasculature in OIR mice. This hypothesis is based on the observation that retinal vascular development is stunted during hyperoxia. Thus, by delivering cell therapies immediately before this exposure, the retina may be better equipped to handle the stress of hyperoxia and subsequent hypoxia. OIR mice were injected at P5 with either CD34+ cells, ECFCs, or a combination of the 2 and euthanized at P12. Representative images of flat-mounted retinas stained for collagen IV to visualize the retinal vessels are shown in Figure 2A. Vaso-obliteration was significantly reduced only in the ECFCs group (Figure 2B) when compared with saline. However, at P17, the level of vaso-obliteration was significantly reduced in the ECFCs and the combination (ECFCs + CD34+ cells) groups (Figure 3, A and B).
Figure 2. Reparative responses in the retina following injection of CD34+ cells, ECFCs, or the combination of both cell types at P5 and euthanized at P12.

(A) Flat-mounted retinas from OIR pups injected on P5 and euthanized on P12 stained for collagen IV to visualize the retinal vessels. Insets: areas of vaso-obliteration (yellow) are shown. (B) Summary of quantification of P5/P12 vaso-obliteration areas. In this group, there is no neovascularization because mice were euthanized before the beginning of the neovascular phase of the model. Scale bar: 100 μm. All data were assessed using 1-way ANOVA. When the results were significant, we determined which means differed from each other using Tukey’s multiple-comparisons test. Values are expressed as percentage of total retina ± SEM, n = 10–12 mice for each data set. Only significant comparisons are shown in the figures.
Figure 3. Reparative responses in the retina following injection of CD34+ cells, ECFCs, or the combination of both cell types at P5 and euthanized at P17.

(A) Flat-mounted retinas from OIR pups injected on P5 and euthanized on P17 stained for collagen IV to visualize the retinal vessels. Insets: areas of vaso-obliteration (yellow) and neovascularization (blue) are shown. (B) Summary of quantification of P5/P17 vaso-obliteration and neovascularization areas. Scale bar: 100 μm. All data were assessed using 1-way ANOVA. When the results were significant, we determined which means differed from each other using Tukey’s multiple-comparisons test. Values are expressed as percentage of total retina ± SEM, n = 10–12 mice for each data set. Only significant comparisons are shown in the figures.
At P17 in pups injected at P5, neovascularization was not significantly reduced in the CD34+ or ECFC group (Figure 3, A and B). Remarkably, the combined injection of CD34+/ECFCs completely abolished neovascularization to nondetectable levels; this finding was replicated in 5 independent experiments (Figure 3, A and B). These findings support the notion that CD34+/ECFCs have synergistic properties that, when used together, provide robust protection to the developing retinal vasculature but only when delivered before the onset of hyperoxic stress.
Combined treatment with CD34+ cells and ECFCs restores normal retinal vascular development in OIR mice.
Because the vascular complications in infants with ROP and OIR mice are the result of abnormal retinal vascular development, we next tested the hypothesis that the observed synergistic protection from combined treatment with CD34+/ECFCs is the result of normalization of retinal vascular development. To test this hypothesis, OIR mice were again injected intravitreally at P5 with either CD34+ cells, ECFCs, or a combination of the 2 cell types. At P12, retinas were harvested, flat-mounted, and stained for vascular-specific collagen IV and human-specific histone H1. ECFCs were transduced ex vivo using a GFP containing lentivirus to facilitate visualization without the need for antibody-based staining. Remarkably, retinas from OIR mice injected with the combined treatment revealed formation of the deep vascular plexus (DVP) while still in hyperoxia, with normal-appearing connections between the superficial vascular plexus (SVP) and the DVP (Figure 4, A and B). GFP-labeled ECFCs appeared to integrate into the developing vasculature and form penetrating vascular sprouts, as evidenced by co-localization with collagen IV staining, whereas CD34+ cells were found in close association with the developing vasculature, as evidenced by blue human H1 staining. Conversely, the saline-injected and CD34+-injected eyes showed only development of the SVP (Figure 4, C and D), while injection of either ECFCs or the combination of ECFC and CD34+ cells demonstrates the presence of the DVP in the retina (Figure 4, E and F). This finding suggested that the beneficial effects of the CD34+ cells were the result of the paracrine functions of these cells, whereas the GFP+ ECFCs directly contributed to the vasculature of both the SVP and DVP.
Figure 4. Injection of ECFCs on P5 stimulates the development of the deep vascular plexus in the OIR pups prior to return to normoxic conditions on P12.

(A) Representative projection of Z-series confocal images from flat-mounted retinas from OIR pups injected with the combination of CD34+ cells and ECFCs on P5 and euthanized on P12. Retinas were stained for collagen IV (red), histone H1 (blue), and GFP (green). (B) Lateral view of A. (C–F) Paraffin cross sections of OIR retinas from pups treated with saline (C), CD34+ cells (D), ECFCs (E), or the combination of ECFCs and CD34+ cells (F). Sections were stained with mouse antibody to CD31 (red) and DAPI (blue). DVP, deep vascular plexus; INL, inner nuclear layer; ONL, outer nuclear layer; SVP, superficial vascular plexus. Scale bar (all panels): 50 μm.
Next, we explored the development of the retinal vasculature in OIR mice by studying pericyte ensheathment. In the retina, pericytes are tightly coupled to endothelial cells in a unique 1:1 ratio and are important in the production of collagen IV, which is a component of the vascular basement membrane. Hence, collagen IV staining is sufficient to identify retinal pericytes based on morphological distinction (Figure 5, A and B). OIR mice were intravitreally injected at P5 with either CD34+ cells, ECFCs, or their combination. Of the 3 treatment regimens, only the combination of CD34+/ECFCs significantly increased pericyte ensheathment in P17 retinas when compared with saline (Figure 5C). Remarkably, combined CD34+/ECFCs treatment resulted in twice as many pericytes per 100 μm of vessel length compared with saline-injected littermate controls.
Figure 5. The combination of ECFCs and CD34+ cells increases pericyte ensheathment in the OIR model.

(A) Representative fluorescence images showing retinal blood vessels stained for collagen IV (red). Pericytes (yellow arrowheads) are easily recognizable as they appear as areas that are “bulging out” of the blood vessels. Blue arrowhead: small vascular tuft. Scale bar: 50 μm. (B) Representative fluorescence high magnification image showing that collagen IV (red) allows the identification of pericytes (yellow arrowheads). Scale bar: 10 μm. Blue stain is DAPI. (C) Quantification of pericytes in retina blood vessels of OIR mouse pups injected at P5 and analyzed at P17. Values are expressed as average/100 μm ± SEM. All data were assessed using 1-way ANOVA. When the results were significant, we determined which means differed from each other using Tukey’s multiple-comparisons test. Only significant comparisons are shown in the figures. Vehicle, n = 9; CD34, n = 12; ECFC, n = 7; ECFC/CD34, n = 6.
Combined treatment with CD34+ and ECFCs has no effect on neural retinal function or anatomical structure in OIR mice.
OIR mice were injected with either saline or CD34+/ECFCs at P5 and then electroretinography was performed at 3 separate time points: P17, P24, and P31. At P17, a significant increase in scotopic a-wave was seen in the OIR-exposed retinas injected with saline and mice injected with the combination of CD34++ECFCs showed an a-wave similar to normoxia, suggesting some neural protection mediated by the cells. However, at P24 the retinas of the pups treated with the cell combination showed a reduction in the a-wave similar to the saline-injected mice (Figure 6A).
Figure 6. Combined treatment with CD34+ cells and ECFCs has no effect on neural retinal function in OIR mice.

(A) Scotopic a- and (B) scotopic b-waves and (C) photopic b-wave intensities were performed at P17, P24, and P31 in control (normoxia) mice, OIR mice injected with saline, or OIR mice injected with CD34+/ECFCs at P5. At P17, the combination of CD34+ cells and ECFCs resulted in a normalization of the a-wave. At P24, normoxia (control) mice showed significantly increased intensities of scotopic a- and b-waves and photopic b-wave compared with saline-injected or CD34+/ECFCs-injected OIR mice. Intensity measurements returned to baseline by P31 in all 3 experimental cohorts. All data were assessed using 1-way ANOVA. When the results were significant, we determined which means differed from each other using Tukey’s multiple-comparisons test. Only significant comparisons are shown in the figures. (D–G) H&E-stained ocular sections. (D) Saline-injected pups. (E) CD34+ cell–injected pups. (F) ECFC-injected pups. (G) CD34+/ECFC-injected pups. Scale bar: 50 μm. ILM, inner limiting membrane; INL, inner nuclear layer; ONL, outer nuclear layer.
The administration of the cell combination did not restore the b-wave (either scotopic or photopic) to the levels observed in the normoxia mice and the reductions were similar to those seen in the retinas of the saline-injected pups at P24 (Figure 6, B and C). At P31, there were no differences in the a-waves or b-waves in any of the cohorts, suggesting that at this late time point the neural retina was responding normally and had recovered from the OIR insult. Thus, our study would suggest that the combination of CD34+/ECFCs was potentially protective to neural retinal function in OIR-treated mice only at the early time point of P17.
Intraocular treatment with saline (Figure 6D), CD34+ cells (Figure 6E), ECFCs (Figure 6F), or the dual combination (Figure 6G) caused no overt structural damage to the neural retina as judged by ocular H&E sections. Taken together, these functional and anatomical data suggest that intravitreal injection of the aforementioned cell-based therapies are nontoxic and may provide some limited protection to the neural retina, specifically the rod and cones of the outer photoreceptor layer, based on the normalization of the a-wave at P17.
Combined use of CD34+ and ECFCs reduces oxidative stress.
We hypothesized that the structural benefits in the retina facilitated by the combined treatment would be the result of, in part, decreased oxidative stress and reduced retinal inflammation. This hypothesis is based on the observations that pericyte depletion promotes retinal inflammation (16) and oxidative stress in the ischemic retina augments retinal neovascularization (17). To test this hypothesis, OIR mice were injected intravitreally at P5 with either CD34+ cells, ECFCs, or a combination of the 2. At P12, whole eyes were harvested, sectioned, and stained for either 4-hydroxynonenal (4-HNE), which is a byproduct of lipid peroxidation, or ionized calcium-binding adapter molecule 1 (Iba1), which is a microglia-specific activation marker. In ocular sections from OIR mice injected with CD34+ cells or the combined cell-based treatment, 4-HNE staining was significantly reduced compared with saline-injected littermate controls, suggesting that CD34+ cells reduce retinal oxidative stress (Figure 7, A–D). Therefore, only the CD34+ and the CD34+/ECFC-injected mice showed significantly decreased oxidative damage (Figure 7E). Surprisingly, in ocular sections stained with Iba1, none of the treatment groups showed a significant reduction in Iba1+ cells (data not shown).
Figure 7. Combined treatment with CD34+ cells and ECFCs reduces oxidative stress.

OIR mice were injected at P5 with either CD34+ cells, ECFCs, or a combination of the 2 cells. (A–D) 4-Hydroxynonenal (4-HNE) detection in the retinas. (A) Saline-injected pups. (B) CD34+ cell–injected pups. (C) ECFC-injected pups. (D) CD34+/ECFC-injected pups. CD34+ cell treatment and the cell combination have the strongest effect on reduction of retinal oxidative stress. (E) Summary of quantification of all the tissue sections analyzed. All data were assessed using 1-way ANOVA. When the results were significant, we determined which means differed from each other using Tukey’s multiple-comparisons test. Only significant comparisons are shown in the figures.
Microarray analysis of gene expression in OIR retinas treated with combined CD34+ and ECFCs.
To further probe the molecular mechanisms influencing the synergistic effects of combined treatment with CD34+/ECFCs in OIR mice, we performed microarray analyses on whole retinal cDNA. When P17 OIR retinas were compared with age-matched normoxia controls, 550 differentially expressed genes (P < 0.05, fold change > |1.5|), were identified. Of these genes, 496 were upregulated and were associated with pathways involved in (a) angiogenesis and endothelial physiology; (b) inflammation (TGF-β and Hif1-α pathways); (c) extracellular matrix (ECM) remodeling; and (d) cell-matrix interaction (Figure 8, OIR versus Normoxia, and Supplemental Table 1). The most upregulated transcript was endothelial cell–specific molecule 1 (Esm1), also known as endocan. Interestingly, endocan protein levels are also increased in the vitreous of patients with proliferative diabetic retinopathy (18) and appear to play an important role in VEGF-A–induced tube formation, migration, and VEGFR2 phosphorylation (19).
Figure 8. Microarray analyses on whole retinal mRNA.

Validation study: P17 OIR retinas were compared with age-matched normoxia control retinas. A total of 894 genes were identified with significantly altered expression. A total of 640 genes were upregulated and included pathways involved in (i) angiogenesis, (ii) inflammation, (iii) extracellular matrix (ECM) remodeling, and (iv) endothelial-specific pathways, while 254 were downregulated and included (i) transporters and channels, (ii) neuronal-specific pathways, and (iii) cytochrome P450 genes.
Among the 54 downregulated genes were (a) neuronal- and retinal-specific pathways and (b) transporters and channels (Figure 8 and Supplemental Table 1). These data corroborated the differential gene expression with the structural and pathophysiological changes in the OIR model, thus validating our model.
We next explored retinal gene expression differences between OIR mice treated with either CD34+ or ECFCs alone, versus the combination. Again, the intravitreal injections were performed at P5, and retinas were collected for RNA analysis at P17. In the CD34+/ECFCs-treated retinas, we found 455 genes upregulated and 444 downregulated (P < 0.05, fold change > |1.5|) compared with CD34+ alone (Figure 8, CD34+/ECFCs versus CD34+, and Supplemental Table 2). Of these findings, 2 major groups of genes were upregulated: genes involved in neuronal structure and function and those related to the visual system, whereas extracellular matrix (ECM), WNT pathway, and stress response genes were downregulated. Interestingly, there were fewer differentially regulated genes in the ECFCs treatment compared with the combination cohort: 13 upregulated genes, most of these encoding myelin proteins, and 15 downregulated genes, involved in the immune response, neovascularization, and ECM (Figure 8, CD34+/ECFCs versus ECFCs). Several of these genes were common to both comparisons: Mbp, Mobp, Olig1, Cldn11 (all related to myelin structure and function), and Emid1 (ECM protein) (Supplemental Table 2).
Proteomic analysis of OIR retinas treated with CD34+ and ECFCs.
To further expand on the molecular mechanisms underlying the dual cell–based therapy, we next explored the proteomic level to better understand how the observed transcriptomic changes influence protein expression in the OIR retina. Whole retinas of OIR mice intravitreally injected at P5 with either CD34+ cells, ECFCs, or combined CD34+/ECFCs were evaluated at P17 using a functional proteomic array (Figure 9). Although the differences were less prominent, we found pathways in the OIR that were similar to those identified by the microarrays, including: upregulation of growth factor signaling (HGF, IGF-1, VEGF, and EGF pathways), inflammatory signaling (IL-11, TGF-β, IL-2, IL-23, and IL-6 pathways), cell-matrix interactions and downregulation of ErbB signaling (STAT5A, RAF1, and PAK4), and autophagy (BECN1, ATG3, and PTEN) (Supplemental Table 3). Interestingly, the CD34+/ECFCs combination specifically reversed some of these pathways compared with CD34+ alone: ErbB signaling and autophagy were upregulated (STAT5A and RAF1), whereas cytoskeletal signaling (essential for cell-matrix interaction) and some inflammatory mediators (UBAC1 and Zap70) were downregulated. The comparison between the combination and ECFCs alone showed an increase in stem cell signaling (SOX2) and a decrease in ERK signaling (SMAD3 and CDK1), which is known to mediate microglial activation in diabetic retinopathy (ref. 20 and Supplemental Table 3).
Figure 9. Retinal protein expression differences in OIR mice treated with dual cell therapy.

(A) Principal component analysis (PCA) from proteomic data sets demonstrates closer association of cell therapy–treated OIR retinas with control (normoxia) retinas. (B) Proteomic analysis of contralateral OIR retinas from the transcriptomic data set treated with CD34+, ECFCs, or CD34+/ECFCs. Shown are the proteins that were significantly changed in the OIR model (P < 0.05), and whose expression was reversed by either cell treatment. Some of these proteins are discussed in the text (STAT3, PDGFR, STAT5A, AIM1, BECN1, PTEN, PRKCA, MIF, PAK4). Data represent NormLog2-Median Centered expression data, averaged (Ave) per set. Red, upregulated; blue, downregulated. In each case, the intensity of the color and the length of the column is proportional to the level of expression. Stat3+p, phosphorylated STAT3.
We found several proteins that were differentially expressed in OIR compared with normoxia, and whose expression was reversed by the cellular treatments (Figure 9B). Consistent with this observation, 3D PCA of the proteomic data sets demonstrated closer association of cell therapy–treated retinas with normal age-matched retinas compared with OIR saline-injected retinas (Figure 9A). Among those proteins whose expression was downregulated in OIR and increased by the combination of cells were BECN1 (involved in autophagy; ref. 21); PRKCA (rod bipolar cell–specific PKC; ref. 22); AIM1 (23), also known as SLC45A2, (an actin-binding protein that suppresses cytoskeletal remodeling); MIF (known to delay neuroretinal degeneration after injury; ref. 24); PTEN (required for complete production of rod photoreceptors and amacrine cells; ref. 25); and PAK4 (involved in antiapoptosis; refs. 26, 27). STAT5A, which is expressed in the neuroretina (28), promotes neurite outgrowth via SOCS6 (29) and is involved in the ERbB signaling pathway, which functions, among others, in neural retina survival and development (30). Conversely, several proteins were upregulated in OIR and reduced by the cell combination (e.g., STAT3), a mediator of IL-6 inflammatory response in diabetic retinopathy (31) and PDGFR, known to be involved in pathological angiogenesis in the retina (32).
Discussion
The salient finding of this study is the demonstration that co-injection of CD34+ cells and ECFCs into the vitreous cavity facilitates normal vascular development during hyperoxia in OIR mice. We showed that the improved normalization of the retinal vasculature was the result of augmented pericyte ensheathment and increased vascular density of the DVP. Given the shared pathophysiology between OIR in mice and ROP in premature infants, these findings represent a possible therapeutic strategy that would treat the source of the disease: aberrant retinal vascular development. Moreover, combination cell therapy in premature infants is a feasible alternative to drug therapy because the infant’s own cord blood contains large numbers of both CD34+ cells and ECFCs, allowing autograft with minimal risk of rejection. Lastly, unlike current pharmacologic strategies, cells can adapt to the rapidly changing environment of the developing retina and are able to target multiple pathways simultaneously, thus providing a more dynamic and encompassing therapeutic approach. The combined use of CD34+ cells and ECFCs in OIR mice recapitulates what occurs in vivo during normal repair processes. When the vasculature is injured, vascular wall progenitors (ECFCs) proliferate and directly repair the injured vessel wall while CD34+ cells support this process by secretion of paracrine factors (33).
Although injury and development are teleologically distinct, the ROP retina clearly has a “hyperoxic injury” that thwarts normal vascular development. Our findings herein support this view by demonstrating that GFP-labeled ECFCs integrate into the damaged vasculature while CD34+ cells remain in close association to sites of injury. These findings agree with recent important studies demonstrating that similar dual cell therapies enhance stem cell engraftment by providing trophic support (34, 35). In addition, our proteomic and transcriptomic studies identify specific pathways that are activated by the combined use of these cells. These predominantly include pathways involved in neuroretinal development and maintenance, which may be of value for future pharmacologic targeting.
Interestingly, our results suggest differing effects of CD34+ cells and ECFCs on retinal vascular development. For vaso-obliteration, our results showed that injection of ECFCs, CD34+ cells, or the combination of both cell types at P12 resulted in a reduction in the total avascular area of the retina when examined at P17 (Figure 1B). However, when considering vascular regrowth, only the ECFCs showed benefit (P5/P12) (Figure 2B). Stahl et al. (36) demonstrated that in the OIR model, vascular regrowth begins around P9 while the mice are still under hyperoxic conditions. The level of vaso-obliteration for P5/P12 control pups injected with vehicle can be considered as a representation of the amount of vascular regrowth that occurs between P9 and P12; thus, our results suggested that only ECFCs stimulate vascular regrowth prior to return to normoxia. CD34+ cells alone failed to stimulate vascular regrowth.
In addition, our results showed that injection of ECFCs, CD34+ cells, or the combination of both cell types at P12 reduced neovascularization at P17. However, injection of either cell type alone on P5 did not reduce neovascularization at P17 (Figure 3B). Injection of both cell types at P5 completely eliminated neovascularization at P17, demonstrating a marked synergistic effect between these cell types (Figure 3B). Interestingly, this synergistic effect on neovascularization was lost when the combination of cell types was injected at P12 after hyperoxia. Thus, a possible interpretation is that hyperoxia stimulates the combination of cells to produce protective factors that prevent neovascularization. An additional possibility is that ECFCs respond to hyperoxia with release of factors or even that dying ECFCs release factors that stimulate the murine retina to form abnormal neovascularization. However, the situation is further complicated because injection of individual cell types or the combination of cells at P12 is protective, with reduction of pathological neovascularization (Figure 1B). Therefore, these cell types are behaving differently depending on whether they are injected before or after hyperoxia. Future studies will test whether injecting hyperoxia-preconditioned cells on P12 will lead to the same results observed herein by injection of cells at P5.
We also showed that injection of ECFCs or ECFCs plus CD34+ cells at P5 stimulated growth of the DVP with incorporation of the human ECFCs into the DVP observed by P12 (Figure 4). During normal retinal development, the DVP is complete in mice by approximately P12. However, in C57BL/6 OIR mice, formation of the DVP did not start until after return to normoxia with initiation at approximately P14 (36). We also observed that DVP formation only occurred at sites in which the SVP was present and not in areas of vaso-obliteration, which was the expected pattern in the OIR model following return to normoxia. Therefore, ECFCs were able to overcome this barrier to normal vascular formation under hyperoxic conditions. Our results are not in agreement with Sakimoto et al. (37), who showed that the subset of ECFCs expressing high levels of CD44 did not home to the ischemic lesion when injected intravitreally, but rather remained in the vitreous. However, we did not test for expression of this transmembrane glycoprotein in the ECFCs we injected.
Finally, both the genomic and proteomic analyses showed that the combination therapy promoted (or helped maintain) a healthier neuroretina, while simultaneously decreasing inflammation, ECM deposition (thus fibrosis), neovascularization, and oxidative stress response. The latter may seem in contradiction with our finding of decreased 4-HNE; however, 4HNE activates antioxidant gene expression (38), therefore the decrease in several antioxidant transcripts may be a consequence of a better retinal microenvironment. Functional data suggest that intravitreal injection of the cell combination may provide some protection to the neural retina, specifically the rod and cones of the outer photoreceptor layer, based on the normalization of the a-wave at P17. Improvements also occurred in the expression of neuronal signaling proteins.
For clinical application, the combination of ECFCs and CD34+ may represent a superior strategy to pharmacologic or mono-cell therapy for the prevention of ROP (Figure 10; prior to exposure to hyperoxia). Importantly, our study suggests that the timing of cell therapy administration in ROP is a critical determinant of efficacy. For interventions administered after hyperoxic exposure, either cell type appears satisfactory at reducing both vaso-obliteration and neovascularization to lower levels. However, for interventions administered before hyperoxic exposure, only the dual cell therapy is sufficient to completely eliminate neovascularization with a concomitant decrease in vaso-obliteration and increase in normalization of vascular development. In addition, future considerations include the use of conditioned medium from these cells, exosomes derived from these cells, overexpression of the bioactive molecules produced by these cells, and pharmacological strategies (that reduce FAK and STAT-pY705 or increase PTEN and PKCα-pS657) that would mimic the effect of the CD34+ cell/ECFC combination. These may represent targeted strategies to promote a microenvironment supportive of normal vascular development.
Figure 10. Schematic showing proposed mechanism for the beneficial effect of CD34+ cell and ECFC combination.

The combination of ECFCs and CD34+ cells may represent an improved strategy compared with either cell alone when used for prevention of ROP by reducing oxidative injury and inflammation, promoting pericyte ensheathment, and targeting critical proteins such as PDGF, FAK, STAT-pY705, PTEN, and PKCα-pS657.
Methods
Animals.
C57BL/6J timed pregnant mice were obtained from Jackson Laboratories. The mice were housed in the Indiana University Purdue University at Indianapolis Laboratory Animal Research Center (LARC).
Preparation of cells.
Whole human umbilical cord blood was anonymously collected in heparin-coated 60-mL syringes. A 1:2 dilution of whole blood/PBS was made, then overlaid on top of 10 mL of Ficoll-Paque PLUS (GE Healthcare Life Sciences). The diluted blood and Ficoll-Paque were centrifuged at 400 g for 30 minutes at room temperature with brakes off. The layer of mononuclear cells was harvested, washed with PBS, and expanded to confluence in Endothelial Growth Media (EGM-2) (Lonza) with 10% defined FBS (Hyclone, GE Healthcare Life Sciences) and 1.5% Antibiotic-Antimycotic (Life Technologies) on tissue culture plates precoated with rat tail collagen I (Corning Incorporated). ECFCs were expanded in a humidified 5% CO2 incubator. ECFCs were transduced with GFP using the puc2CL6IEGwo lentiviral vector. CD34+ cells were acquired from the IU Simon Cancer Center Angio BioCore. Human CD34+AC133+VEGFR-2+ cells are not endothelial progenitor cells but distinct, primitive hematopoietic progenitors (39).
Intraocular injection into the mouse model of OIR using C57BL/6 mice.
In the neonatal mouse model of OIR, 7-day-old mice are placed with their nursing dams in a 75% oxygen atmosphere for 5 days. Pups were intravitreally injected with either CD34+ cells (10,000 cells), ECFCs (100,000 cells), or a combination thereof (110,000 cells). The injections were done either on P5, before placing in 75% oxygen, or on P12, on return to normoxic conditions. The mice were euthanized on either P12 or P17.
Determination of retinal vaso-obliteration and neovascularization in the OIR model.
High resolution TIF images of the FITC-labeled dextran retinal flat mounts were used to determine the relative levels of vaso-obliteration and neovascularization. Areas of neovascularization and vaso-obliteration and the total retinal area were delineated on the images using ImageJ (NIH Research Service Branch, http://rsb.info.nih.gov/ij/index.html). The formula of area of total vaso-obliteration/total retinal area × 100% was used to determine the total area of vaso-obliteration per retina. The formula of area of total neovascularization/total retinal area × 100% was used to determine the total area of neovascularization per retina. The results were determined relative to SEM, and 6 mice (12 retinas) were used to determine each value.
Tissue preparation for retinal flat mounts.
The mouse eyes were enucleated, pierced 1 mm posterior to the limbus with a 27-gauge needle, immersed in buffered 4% (w/v) paraformaldehyde for 1 hour at room temperature, and then washed by immersion in 2 changes of PBS before dissection. Neural retinas were isolated intact and permeabilized overnight at 4°C in permeabilization/blocking buffer (0.3% [v/v] Triton X-100, 10% [v/v] goat serum, and 0.2% [w/v] BSA in PBS) (Sigma-Aldrich). Retinas were then incubated overnight at 4°C with rabbit anti-collagen IV (Abcam, catalog ab19808) 1:400 in PBS, followed by 2 washes in PBS and incubation in mouse anti-human histone H1 conjugated to AlexaFluor 405 (Novus Biologicals, catalog NB100-65220AF405) (1:200); goat anti-GFP conjugated to DyLight 488 (Novus, catalog NBP1-69969) (1:200) and goat anti-rabbit IgG conjugated to AlexaFluor 568 (Thermo Fisher Scientific, catalog A-11011) (1:200), for 4 hours at 4°C. After performing 5 radial incisions, retinas were flat-mounted on a glass slide in antifade medium (Vectashield; Vector Laboratories).
Image capture and analysis of retinal flat mounts.
The entire retina was visualized using an Imager D2 Microscope and Zeiss Blue Edition software (Carl Zeiss Microscopy) to capture ×5 images. These images were then combined using Adobe Photoshop and areas of vaso-obliteration and neovascularization were measured using ImageJ. Selected regions of the retinas were also imaged using a Zeiss LSM 700 laser scanning confocal microscope. Z-series captures were made through the entire retinal thickness (~3 μm Z-depth) with the ×40 objective, and ImageJ was used to produce Z-projections and 3D projections.
Quantification of pericytes.
The previously described retinas were further used for pericytes quantification. Vessels to be analyzed were selected based on similar diameter and orientation (spanning across the field of view) and free of obstructions (neovascular tufts) for consistency. The examiner was masked to the identity of the treatment groups. The pericytes, clearly identifiable by morphology, were counted manually using ImageJ. Retinas from 2 to 4 animals per group and 3 to 5 vessels per retina were analyzed for a total of vessels as follows: Vehicle, n = 9; CD34, n = 12; ECFC, n = 7; ECFC/CD34, n = 6. Values were expressed as average number of pericytes/100 μm ± SEM.
Immunohistochemistry of retinal cross sections.
Five-micron-thick paraffin cross sections underwent several 5-minute deparaffinization and rehydration steps: 3 times in xylene; 3 times in 100% ethanol; 2 times in 95% ethanol; 1 time in 70% ethanol; 1 time in 50% ethanol; and, finally, 1 time in distilled water. Sections were then washed 3 times with PBS and permeabilized with 0.3% Triton X-100 for 10 minutes at room temperature.
For oxidative stress assessment.
Nonspecific binding was blocked by incubating tissue sections in 10% normal goat serum plus 1% BSA in PBS followed by incubation in rabbit anti-4HNE, (Abcam, catalog ab20953) diluted at 1:25 for 2 hours at room temperature, followed by incubation in Cy3-conjugated goat anti-rabbit (Abcam, catalog ab6939) 1:500, for 50 minutes. Five fluorescence microscopy images from 3 mice/condition were obtained and used to measure fluorescence intensity in the transverse retina sections. Fluorescence intensity was assessed using ImageJ. All microscopic images were acquired with identical exposure settings.
For inflammation assessment.
Nonspecific binding was blocked by incubating tissue sections in 10% normal goat serum + 1% BSA in PBS followed by incubation in rabbit anti-Iba1 (Wako, catalog 019-19741) 1:150 for 2 hours at room temperature, followed by incubation in Cy3-conjugated goat anti-rabbit (Abcam, catalog ab6939) 1:500, for 50 minutes. Five to 10 fluorescence microscopy images/mouse/condition were analyzed. Iba-1–positive cell bodies were manually counted by a masked examiner in the transverse retina sections.
For blood vessel detection.
Nonspecific binding was blocked by incubating tissue sections in 10% normal donkey serum for 1 hour at room temperature. Samples were then incubated in rat anti-CD31 (Novus Biologicals, catalog NB100-1642) 1:100 for 16 hours at 4°C. After primary antibody incubation, tissues were washed in PBS and incubated in donkey anti-rat IgG DyLight 594 (Thermo Fisher Scientific, catalog SA5-10028) 1:200 at 4°C overnight. After washing, specimens were mounted in aqueous mounting medium (VectaShield; Vector Laboratories, Inc.) and coverslipped for observation by fluorescence microscopy. All microscopic images were acquired with identical exposure settings.
Electroretinography.
Electroretinographies (ERGs) were recorded using the Espion E2 system (Diagnosys LLC) as described previously (40). Briefly, pups were dark-adapted overnight and anesthetized by an i.p. injection of a ketamine/xylazine mixture (85/10 mg/kg). Pupils were dilated with 1% cyclopentolate-HCl and 2.5% phenylephrine, and the mouse body temperature was maintained at 37°C using a water-based warming pad. ERG responses under dark-adapted (“scotopic”) conditions were evoked by a series of 9 flashes ranging from 0.0001 cd·s/m2 to 100 cd·s/m2. For flashes up to 0.1 cd·s/m2, responses of 10 trials were averaged. For 0.5 and 1 cd·s/m2 flash responses, 3 trials were averaged. For brighter stimuli, responses to single flashes were recorded without averaging. Light-adapted (“photopic”) ERGs were evoked by a series of 6 flashes ranging from 0.2 cd·s/m2 to 2000 cd·s/m2, whereas rod inputs were suppressed with a steady background illumination of 50 cd/m2. Up to 10 trials were averaged for all flash responses.
Analysis of ERG recordings.
Rod-driven a-waves were measured at 8 ms after the flash stimulus was applied, and cone-driven a-waves were measured at 14 ms after the flash to exclude postreceptoral contribution from the analysis (40). For b-wave amplitude determination, the oscillatory potentials were removed from the signals by 55-Hz low-pass frequency filtering, and the b-wave amplitude was calculated from the bottom of the a-wave response to the b-wave peak. Averaged b-wave amplitudes were plotted as a function of flash intensity. The resulting stimulus-response curves were fitted to Equation 1 using a least-square fitting procedure (Scientist Software; MicroMath):
(Equation 1)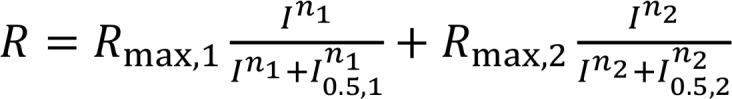
The first and second terms of Equation 1 describe rod- and cone-driven responses, respectively, usually observed at flash intensities ≥ ~0.5 cd·s/m2 for dark-adapted mice. Rmax,1 and Rmax,2 are maximal response amplitudes, n1 and n2 are Hill coefficients, and I0.5,1 and I0.5,2 are the half-saturating flash intensities. Stimulus-response curves were obtained under photopic conditions, and the data points from a-wave stimulus-response curves were fitted to a single term of Equation 1, as described in Hu et al. (40).
Microarray analysis of gene expression.
For total RNA isolation, we used the RNeasy Mini Kit (Qiagen). Briefly, we used 3 pups per experimental condition, and 1 retina from each pup was disrupted in 350 μL of lysis buffer with the TissueLyser LT (Qiagen) for 2 times 1 minute, using three to five 1-mm and one to two 3-mm zirconium oxide/yttria–stabilized beads (Union Process). The supernatants were further processed in a QiaCube (Qiagen), with the RNA_RNeasyMini_AnimalTissuesAndCells_Standard_V3 program. RNA quantity and quality were determined with NanoDrop 2000C (Thermo Fisher Scientific). One hundred nanograms total RNA was further used for cDNA synthesis and labeling, using Ovation PicoSL WTA System V2 and Encore Biotin Module, respectively (NuGEN Technologies, Inc.), according to manufacturer’s protocols. Three Mouse Genome 430A v2 (Affymetrix) per experimental condition were hybridized, stained, and scanned in the Center for Medical Genomics at Indiana University School of Medicine using standard protocols, in the Hybridization Oven 645, Fluidics station 450 and GeneChip Scanner 3000 7G (Affymetrix), respectively. After passing the quality controls, CEL files were analyzed with Partek Genomic Suite (Partek Inc.). We performed PCA followed by ANOVA. The genes that had a P value < 0.05 and absolute value of the fold-change ≥ 1.5 in at least 1 comparison were further analyzed by hierarchical clustering (Euclidean algorithm, average linkage, done on standardized values: means = 0, SD = 1) and partitioning clustering (Coefficient of Shape Difference algorithm, with a choice of 7 clusters after checking a range of numbers, also done after standardization of expression values). To explore the functional coordinates of these genes, Ingenuity Pathway Analysis (IPA; Qiagen) and GeneAnalytics (geneanalytics.genecards.org) (41) were used. Microarray data were submitted to NCBI’s Gene Expression Omnibus (GEO) repository under the accession number GSE135844.
Proteomic analysis.
For protein expression assays, the remaining retina from each pup was disrupted in the TissuLyzer LT in 200 μL lysis buffer provided by the Functional Proteomics Reverse Phase Protein Array (RPPA) Core Facility (MD Anderson Cancer Center): 1% Triton X-100, 50 mM HEPES, pH 7.4, 150 mM NaCl, 1.5 mM MgCl2, 1 mM EGTA, 100 mM NaF, 10 mM Na pyrophosphate, 1 mM Na3VO4, 10% glycerol, and freshly added protease and phosphatase inhibitors (Roche Diagnostics Corporation). After pelleting the debris, the protein concentration was determined with the Pierce BCA microplate procedure (Thermo Fisher Scientific) on a Synergy H1 plate reader (BioTek), adjusted to approximately 1 μg/μL and sent to RPPA Core for proteomic analysis using their standard procedures (https://www.mdanderson.org/research/research-resources/core-facilities/functional-proteomics-rppa-core.html). Data were analyzed as described for gene expression.
Statistics.
All experiments were repeated at least 3 times. All data were assessed using 1-way ANOVA. When the results were significant, we determined which means differed from each other using Tukey’s multiple-comparisons test. Results are expressed as mean ± SEM. Statistical analysis was performed using GraphPad Prism, with P < 0.05 considered statistically significant. Only significant comparisons are shown in the figures. All the examiners were blinded to the identity of the samples they were analyzing.
Study approval.
All animals were treated in accordance with the ARVO statement for the use of animals in Ophthalmic and Vision Research and with the NIH Guide for the Care and Use of Laboratory Animals (National Academies Press, 2011). All protocols were approved by the IACUC of Indiana University Purdue University at Indianapolis.
Author contributions
SLC, LCS, and LM designed and performed the studies, prepared figures, and wrote the manuscript. WCS, XQ, and JLQ performed studies. SDF edited the manuscript. LR reviewed the statistical analysis of the data. MEB, MCY, and MBG conceived the experiments, analyzed data, and wrote the manuscript.
Supplementary Material
Acknowledgments
NIH grants EY0126001, EY007739, HL110170, EY025383, EY028858, EY028037, and Research to Prevent Blindness unrestricted grant awarded to the Department of Ophthalmology at IUPUI. The microarray studies were carried out using the facilities of the Center for Medical Genomics at Indiana University School of Medicine. The Center for Medical Genomics is supported in part by the Indiana Genomics Initiative at Indiana University (INGEN), which is supported in part by the Lilly Endowment, Inc. The proteomics assays were done at the Reverse Phase Protein Array (RPPA) Core Facility, at the University of Texas MD Anderson Cancer Center, Houston, Texas, USA, which is supported by the NCI grant CA16672.
Version 1. 11/01/2019
Electronic publication
Footnotes
Conflict of interest: The authors have declared that no conflict of interest exists.
Copyright: © 2019, American Society for Clinical Investigation.
Reference information: JCI Insight. 2019;4(21):e129224.https://doi.org/10.1172/jci.insight.129224.
Contributor Information
Sergio Li Calzi, Email: scalzi@uabmc.edu.
Lynn C. Shaw, Email: lshaw1957@gmail.com.
Leni Moldovan, Email: lmoldova@iupui.edu.
William C. Shelley, Email: wshelley@iu.edu.
Xiaoping Qi, Email: xqi@uabmc.edu.
Lyne Racette, Email: lracette@uabmc.edu.
Judith L. Quigley, Email: judi.quigley13@gmail.com.
Seth D. Fortmann, Email: sfortma2@uab.edu.
Michael E. Boulton, Email: meboulton@uabmc.edu.
Mervin C. Yoder, Email: myoder@iu.edu.
Maria B. Grant, Email: mariagrant@uabmc.edu.
References
- 1.Alon T, Hemo I, Itin A, Pe’er J, Stone J, Keshet E. Vascular endothelial growth factor acts as a survival factor for newly formed retinal vessels and has implications for retinopathy of prematurity. Nat Med. 1995;1(10):1024–1028. doi: 10.1038/nm1095-1024. [DOI] [PubMed] [Google Scholar]
- 2.Hartnett ME, Penn JS. Mechanisms and management of retinopathy of prematurity. N Engl J Med. 2012;367(26):2515–2526. doi: 10.1056/NEJMra1208129. [DOI] [PMC free article] [PubMed] [Google Scholar]
- 3.Hellström A, Smith LE, Dammann O. Retinopathy of prematurity. Lancet. 2013;382(9902):1445–1457. doi: 10.1016/S0140-6736(13)60178-6. [DOI] [PMC free article] [PubMed] [Google Scholar]
- 4.Selvam S, Kumar T, Fruttiger M. Retinal vasculature development in health and disease. Prog Retin Eye Res. 2018;63:1–19. doi: 10.1016/j.preteyeres.2017.11.001. [DOI] [PubMed] [Google Scholar]
- 5.Connor KM, et al. Quantification of oxygen-induced retinopathy in the mouse: a model of vessel loss, vessel regrowth and pathological angiogenesis. Nat Protoc. 2009;4(11):1565–1573. doi: 10.1038/nprot.2009.187. [DOI] [PMC free article] [PubMed] [Google Scholar]
- 6.Park SS, et al. Advances in bone marrow stem cell therapy for retinal dysfunction. Prog Retin Eye Res. 2017;56:148–165. doi: 10.1016/j.preteyeres.2016.10.002. [DOI] [PMC free article] [PubMed] [Google Scholar]
- 7.Caballero S, et al. Ischemic vascular damage can be repaired by healthy, but not diabetic, endothelial progenitor cells. Diabetes. 2007;56(4):960–967. doi: 10.2337/db06-1254. [DOI] [PMC free article] [PubMed] [Google Scholar]
- 8.Medina RJ, et al. Ex vivo expansion of human outgrowth endothelial cells leads to IL-8-mediated replicative senescence and impaired vasoreparative function. Stem Cells. 2013;31(8):1657–1668. doi: 10.1002/stem.1414. [DOI] [PubMed] [Google Scholar]
- 9.Yoder MC, Ingram DA. The definition of EPCs and other bone marrow cells contributing to neoangiogenesis and tumor growth: is there common ground for understanding the roles of numerous marrow-derived cells in the neoangiogenic process? Biochim Biophys Acta. 2009;1796(1):50–54. doi: 10.1016/j.bbcan.2009.04.002. [DOI] [PMC free article] [PubMed] [Google Scholar]
- 10.Yoder MC, et al. Redefining endothelial progenitor cells via clonal analysis and hematopoietic stem/progenitor cell principals. Blood. 2007;109(5):1801–1809. doi: 10.1182/blood-2006-08-043471. [DOI] [PMC free article] [PubMed] [Google Scholar]
- 11.Ingram DA, et al. Clonogenic endothelial progenitor cells are sensitive to oxidative stress. Stem Cells. 2007;25(2):297–304. doi: 10.1634/stemcells.2006-0340. [DOI] [PubMed] [Google Scholar]
- 12.Ingram DA, et al. Identification of a novel hierarchy of endothelial progenitor cells using human peripheral and umbilical cord blood. Blood. 2004;104(9):2752–2760. doi: 10.1182/blood-2004-04-1396. [DOI] [PubMed] [Google Scholar]
- 13.Milbauer LC, et al. Blood outgrowth endothelial cell migration and trapping in vivo: a window into gene therapy. Transl Res. 2009;153(4):179–189. doi: 10.1016/j.trsl.2008.12.009. [DOI] [PMC free article] [PubMed] [Google Scholar]
- 14.Medina RJ, et al. Molecular analysis of endothelial progenitor cell (EPC) subtypes reveals two distinct cell populations with different identities. BMC Med Genomics. 2010;3:18. doi: 10.1186/1755-8794-3-18. [DOI] [PMC free article] [PubMed] [Google Scholar]
- 15.Yoon CH, et al. Synergistic neovascularization by mixed transplantation of early endothelial progenitor cells and late outgrowth endothelial cells: the role of angiogenic cytokines and matrix metalloproteinases. Circulation. 2005;112(11):1618–1627. doi: 10.1161/CIRCULATIONAHA.104.503433. [DOI] [PubMed] [Google Scholar]
- 16.Ogura S, et al. Sustained inflammation after pericyte depletion induces irreversible blood-retina barrier breakdown. JCI Insight. 2017;2(3):e90905. doi: 10.1172/jci.insight.90905. [DOI] [PMC free article] [PubMed] [Google Scholar]
- 17.Dong A, et al. Oxidative stress promotes ocular neovascularization. J Cell Physiol. 2009;219(3):544–552. doi: 10.1002/jcp.21698. [DOI] [PMC free article] [PubMed] [Google Scholar]
- 18.Abu El-Asrar AM, et al. The angiogenic biomarker endocan is upregulated in proliferative diabetic retinopathy and correlates with vascular endothelial growth factor. Curr Eye Res. 2015;40(3):321–331. doi: 10.3109/02713683.2014.921312. [DOI] [PubMed] [Google Scholar]
- 19.Roudnicky F, et al. Endocan is upregulated on tumor vessels in invasive bladder cancer where it mediates VEGF-A-induced angiogenesis. Cancer Res. 2013;73(3):1097–1106. doi: 10.1158/0008-5472.CAN-12-1855. [DOI] [PubMed] [Google Scholar]
- 20.Altmann C, Schmidt MHH. The role of microglia in diabetic retinopathy: inflammation, microvasculature defects and neurodegeneration. Int J Mol Sci. 2018;19(1):E110. doi: 10.3390/ijms19010110. [DOI] [PMC free article] [PubMed] [Google Scholar]
- 21.Ashkenazi A, et al. Polyglutamine tracts regulate beclin 1-dependent autophagy. Nature. 2017;545(7652):108–111. doi: 10.1038/nature22078. [DOI] [PMC free article] [PubMed] [Google Scholar]
- 22.Peng YW, Hao Y, Petters RM, Wong F. Ectopic synaptogenesis in the mammalian retina caused by rod photoreceptor-specific mutations. Nat Neurosci. 2000;3(11):1121–1127. doi: 10.1038/80639. [DOI] [PubMed] [Google Scholar]
- 23.Haffner MC, et al. AIM1 is an actin-binding protein that suppresses cell migration and micrometastatic dissemination. Nat Commun. 2017;8(1):142. doi: 10.1038/s41467-017-00084-8. [DOI] [PMC free article] [PubMed] [Google Scholar]
- 24.Thanos S, Mey J, Wild M. Treatment of the adult retina with microglia-suppressing factors retards axotomy-induced neuronal degradation and enhances axonal regeneration in vivo and in vitro. J Neurosci. 1993;13(2):455–466. doi: 10.1523/JNEUROSCI.13-02-00455.1993. [DOI] [PMC free article] [PubMed] [Google Scholar]
- 25.Tachibana N, et al. Pten regulates retinal amacrine cell number by modulating Akt, Tgfβ, and Erk signaling. J Neurosci. 2016;36(36):9454–9471. doi: 10.1523/JNEUROSCI.0936-16.2016. [DOI] [PMC free article] [PubMed] [Google Scholar]
- 26.Gnesutta N, Qu J, Minden A. The serine/threonine kinase PAK4 prevents caspase activation and protects cells from apoptosis. J Biol Chem. 2001;276(17):14414–14419. doi: 10.1074/jbc.M011046200. [DOI] [PubMed] [Google Scholar]
- 27.Belmonte MA, Santos MF, Kihara AH, Yan CY, Hamassaki DE. Light-Induced photoreceptor degeneration in the mouse involves activation of the small GTPase Rac1. Invest Ophthalmol Vis Sci. 2006;47(3):1193–1200. doi: 10.1167/iovs.05-0446. [DOI] [PubMed] [Google Scholar]
- 28.Zhang SS, Wei JY, Li C, Barnstable CJ, Fu XY. Expression and activation of STAT proteins during mouse retina development. Exp Eye Res. 2003;76(4):421–431. doi: 10.1016/S0014-4835(03)00002-2. [DOI] [PubMed] [Google Scholar]
- 29.Gupta S, Mishra K, Surolia A, Banerjee K. Suppressor of cytokine signalling-6 promotes neurite outgrowth via JAK2/STAT5-mediated signalling pathway, involving negative feedback inhibition. PLoS ONE. 2011;6(11):e26674. doi: 10.1371/journal.pone.0026674. [DOI] [PMC free article] [PubMed] [Google Scholar]
- 30.Bermingham-McDonogh O, McCabe KL, Reh TA. Effects of GGF/neuregulins on neuronal survival and neurite outgrowth correlate with erbB2/neu expression in developing rat retina. Development. 1996;122(5):1427–1438. doi: 10.1242/dev.122.5.1427. [DOI] [PubMed] [Google Scholar]
- 31.Yun JH, et al. Endothelial STAT3 activation increases vascular leakage through downregulating tight junction proteins: implications for diabetic retinopathy. J Cell Physiol. 2017;232(5):1123–1134. doi: 10.1002/jcp.25575. [DOI] [PubMed] [Google Scholar]
- 32.Hou X, et al. PDGF-CC blockade inhibits pathological angiogenesis by acting on multiple cellular and molecular targets. Proc Natl Acad Sci U S A. 2010;107(27):12216–12221. doi: 10.1073/pnas.1004143107. [DOI] [PMC free article] [PubMed] [Google Scholar]
- 33.Urbich C, Dimmeler S. Endothelial progenitor cells: characterization and role in vascular biology. Circ Res. 2004;95(4):343–353. doi: 10.1161/01.RES.0000137877.89448.78. [DOI] [PubMed] [Google Scholar]
- 34.Lin RZ, Moreno-Luna R, Li D, Jaminet SC, Greene AK, Melero-Martin JM. Human endothelial colony-forming cells serve as trophic mediators for mesenchymal stem cell engraftment via paracrine signaling. Proc Natl Acad Sci U S A. 2014;111(28):10137–10142. doi: 10.1073/pnas.1405388111. [DOI] [PMC free article] [PubMed] [Google Scholar]
- 35.Kang KT, Lin RZ, Kuppermann D, Melero-Martin JM, Bischoff J. Endothelial colony forming cells and mesenchymal progenitor cells form blood vessels and increase blood flow in ischemic muscle. Sci Rep. 2017;7(1):770. doi: 10.1038/s41598-017-00809-1. [DOI] [PMC free article] [PubMed] [Google Scholar]
- 36.Stahl A, et al. The mouse retina as an angiogenesis model. Invest Ophthalmol Vis Sci. 2010;51(6):2813–2826. doi: 10.1167/iovs.10-5176. [DOI] [PMC free article] [PubMed] [Google Scholar]
- 37.Sakimoto S, et al. CD44 expression in endothelial colony-forming cells regulates neurovascular trophic effect. JCI Insight. 2017;2(2):e89906. doi: 10.1172/jci.insight.89906. [DOI] [PMC free article] [PubMed] [Google Scholar]
- 38.Siow RC, Ishii T, Mann GE. Modulation of antioxidant gene expression by 4-hydroxynonenal: atheroprotective role of the Nrf2/ARE transcription pathway. Redox Rep. 2007;12(1):11–15. doi: 10.1179/135100007X162167. [DOI] [PubMed] [Google Scholar]
- 39.Case J, et al. Human CD34+AC133+VEGFR-2+ cells are not endothelial progenitor cells but distinct, primitive hematopoietic progenitors. Exp Hematol. 2007;35(7):1109–1118. doi: 10.1016/j.exphem.2007.04.002. [DOI] [PubMed] [Google Scholar]
- 40.Hu P, et al. Aryl hydrocarbon receptor deficiency causes dysregulated cellular matrix metabolism and age-related macular degeneration-like pathology. Proc Natl Acad Sci U S A. 2013;110(43):E4069–E4078. doi: 10.1073/pnas.1307574110. [DOI] [PMC free article] [PubMed] [Google Scholar]
- 41.Ben-Ari Fuchs S, et al. GeneAnalytics: an integrative gene set analysis tool for next generation sequencing, RNAseq and microarray data. OMICS. 2016;20(3):139–151. doi: 10.1089/omi.2015.0168. [DOI] [PMC free article] [PubMed] [Google Scholar]
Associated Data
This section collects any data citations, data availability statements, or supplementary materials included in this article.