

SUMMARY
Fecal transfer from healthy donors is being explored as a microbiome modality. MicroRNAs (miRNA, miR) have been found to affect the microbiome. Multiple sclerosis (MS) patients have been shown to have an altered gut microbiome. Here, we unexpectedly found that transfer of feces from the experimental autoimmune encephalomyelitis (EAE) model of MS harvested at peak disease ameliorates disease in recipients in a miR-dependent manner. Specifically, we show miR-30d is enriched in the feces of peak EAE and untreated MS patients. Synthetic miR-30d given orally ameliorates EAE through expansion of regulatory T cells (Tregs). Mechanistically, miR-30d regulates the expression of a lactase in Akkermansia muciniphila, which increases Akkermansia abundance in the gut. The expanded Akkermansia in turn increases Tregs to suppress EAE symptoms. Our findings report the mechanistic underpinnings of a miR-microbiome axis, and suggests that the feces of diseased subjects may be enriched for miRNAs with therapeutic properties.
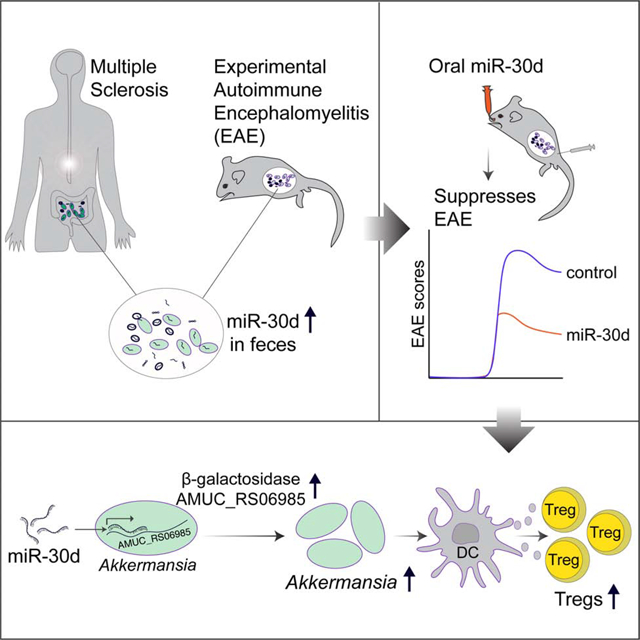
Graphical Abstract
eTOC Blurb:
Liu et al. show that feces of subjects with multiple sclerosis (MS) and animals with EAE are enriched for microRNAs, including miR-30d, with therapeutic properties. MiR-30d suppresses EAE when given orally by expanding the commensal Akkermansia muciniphila through upregulation of a β-galactosidase, which increases regulatory T cells to suppress disease.
INTRODUCTION
Multiple sclerosis (MS) is an autoimmune disease directed against the central nervous system (CNS) myelin, and is associated with demyelination, oligodendrocyte loss, reactive gliosis, and axonal degeneration (Stadelmann et al. 2011; Ransohoff et al. 2015). MS is a heterogeneous, multifactorial disease influenced by both genetic (Dyment et al. 2004; Sawcer et al. 2011; Gianfrancesco et al. 2017) and environmental factors (Belbasis et al. 2015). Pathologically, activated autoreactive CD4+ T cells in the periphery migrate to the CNS and initiate the MS process. Interferon gamma (IFN-γ)-producing Th1 and interleukin-17 (IL-17)-secreting Th17 CD4+ T cells play a central role in the pathogenesis of MS (Baecher-Allan et al. 2018; Frisullo et al. 2008). These responses can be regulated in the periphery and/or in the CNS by FoxP3+ regulatory T cells (Tregs) (Lu & Rudensky 2009; Oukka 2007; Dombrowski et al. 2017).
The gut microbiome plays an important role in the development of immune system (An et al. 2014; Hooper et al. 2012; Belkaid & Hand 2014). Different commensals in the gut promote the differentiation of subsets of lymphocytes. In mice, segmented filamentous bacteria induce intestinal Th17 cells (Ivanov et al. 2009); Bacteroides fragilis (B. fragilis) colonization of germ-free (GF) mice preferentially induces Th1 cells (Mazmanian et al. 2005); and polysaccharide A of B. fragilis suppresses Th17 cells in conventional mice (Round et al. 2011). Clusters IV and XIVa of Clostridium promotes a transforming growth factor-β (TGF-β)-rich environment in the gut and Treg accumulation (Atarashi et al. 2011). The human symbiont Clostridium ramosum was also demonstrated to induce Treg (Sefik et al. 2015; Yissachar et al. 2017).
The gut microbiome has been linked to many disorders including inflammatory bowel disease (Ott et al. 2004), obesity (Turnbaugh et al. 2008), diabetes (Qin et al. 2012), and autism (Hsiao et al. 2013) and modulation of gut microbiome is being explored as a therapeutic modality. One such approach is fecal microbiome transplantation (FMT) for which there are more than 200 registered clinical trials (Schmidt et al. 2018).
We and others have detected an altered gut microbiome in MS (Jangi et al. 2016; J. Chen et al. 2016; Tremlett et al. 2016; Cekanaviciute et al. 2017; Berer et al. 2017) and we have previously identified microRNAs (miRNA, miR) in the feces and found that fecal miRNAs shape the gut microbiome (S. Liu et al. 2016). In line with this, a recent study found that ginger-derived miRNAs can be taken up by the gut microbes, alter the microbial composition, and modulate the host physiology (Teng et al. 2018). Here, in order to investigate how the altered gut microbiome affects the course of MS, and whether fecal miRNA may be involved, we studied the gut microbiome and miRNA in the experimental autoimmune encephalomyelitis (EAE) model of MS. We unexpectedly found that transfer of feces from EAE peak disease was protective when EAE was induced in recipient animals. We found that miR-30d, rather than live microbes, was responsible for the disease amelioration following fecal transfer. Furthermore, we found that miR-30d increased the abundance of the gut commensal Akkermansia muciniphila (A. muciniphila), which in turn induced cytokines in dendritic cells (DCs) that drove Treg differentiation and ameliorated EAE. Our findings raise the possibility that the feces of diseased subjects may be enriched for miRNAs and microbes with therapeutic properties.
RESULTS
Gut Microbiome Changes during EAE
Commensals are essential for the development and function of the host immune system (Belkaid & Hand 2014). EAE is a primary animal model of MS (Robinson et al. 2014). Mouse model of spontaneous relapsing-remitting MS does not develop EAE when raised under GF condition (Berer et al. 2011) and mice orally treated with antibiotics have less severe EAE (Ochoa-Repáraz et al. 2009). We and others have detected an altered gut microbiome in MS (Jangi et al. 2016; J. Chen et al. 2016; Tremlett et al. 2016; Cekanaviciute et al. 2017; Berer et al. 2017). To investigate the microbiome composition in EAE, we induced EAE in mice by immunization with myelin oligodendrocyte glycoprotein (MOG) emulsified with Freund’s complete adjuvant (CFA). Control mice were immunized with ovalbumin (OVA)/CFA emulsion. Fecal specimens were collected at the time of immunization, prior to onset of EAE, and peak EAE disease; we performed 16S rDNA sequencing to analyze the microbiome. An unweighted (Figure 1A) and a weighted (Figure 1B) UniFrac beta-diversity metric assessment of overall microbial structure did not reveal significant difference between MOG-induced EAE and OVA-immunized control. We next investigated whether the relative abundances of microbes differed between MOG- and OVA- immunized mice at a species-level. We found that A. muciniphila was increased in the feces from MOG-induced EAE mice, but not from OVA-immunized mice (Figure 1C and Table S1), which we confirmed by quantitative PCR (qPCR) (Figure 1D). Of note, A. muciniphila was also found to be increased in the stool of untreated MS patients from multiple studies including ours (Jangi et al. 2016; Tremlett et al. 2016; Cekanaviciute et al. 2017; Berer et al. 2017). We also found an increase in the genus Turicibacter and a decrease in the genus Lactobacillus both in MOG- and in OVA- immunized mice, but we did not find changes at a species level. We did not find other bacterial changes during MOG-induced EAE (Figure 1C and Table S1).
Figure 1. Analysis of Gut Microbiome Changes During MOG-induced EAE.

(A-D) Mice were immunized with OVA or MOG and feces were collected at day 0 (0-day post immunization, 0 d.p.i., naïve), 8 d.p.i. (prior to EAE symptom onset for MOG-immunized mice), and 15 d.p.i. (peak EAE for MOG-immunized mice). (A-C) Bacterial 16S rDNA sequence-based microbiome surveys were performed. (A) Principal coordinates analysis (PCoA) based on unweighted UniFrac metrics. (B) PCoA based on weighted UniFrac metrics. (C) Relative abundance of bacteria classified at a species-level taxonomy. OVA n=5, MOG n=10. One-way ANOVA with Dunnett’s post hoc test comparing with day 0 non-immunized mice. Arrow highlights species that were increased at EAE peak; MOG 15 d.p.i. vs MOG 0 d.p.i. P= 0.0001, MOG 15 d.p.i. vs MOG 8 d.p.i. P= 0.0099. (D) qPCR quantification of the relative abundance of Akkermansia muciniphila (A. muciniphila) by measuring 16S rDNA, referenced to universal bacterial 16S rDNA. Naïve n=27, 15 d.p.i. of OVA n=19, 15 d.p.i. of MOG n=23. Error bars denote mean ± SEM, One-way ANOVA with Tukey’s post hoc test.
Related to Table S1.
Oral Transfer of Feces and Fecal miRNA from Peak EAE Ameliorates EAE
To investigate whether the gut microbiome from mice with EAE had pathogenic properties, we transplanted feces from EAE mice into naïve animals that were then immunized with MOG for EAE induction (Figure 2A). We found that transfer of feces obtained during peak EAE ameliorated disease in recipient mice as compared to transfer of feces from healthy naïve mice (Figure 2B). A similar trend was observed using feces obtained from EAE animals prior to disease onset (Figure 2B). To determine whether live bacteria in peak EAE feces were responsible for the effects, we heat-inactivated feces from peak EAE prior to transfer (Figure 2C). We found that both intact and heat-inactivated peak EAE feces ameliorated EAE in a similar fashion (Figure 2D), indicating that live microbes were not required and a heat-resistant component in the peak EAE feces improved EAE. No effect was observed when feces from OVA-immunized mice were transferred (Figure 2D). We and others have reported that host miRNAs can modulate bacterial transcripts and growth (S. Liu et al. 2016; Teng et al. 2018). MicroRNAs are heat resistant (Jung et al. 2010); thus to determine whether fecal miRNAs were responsible for the effects we observed, we purified fecal RNA from peak EAE feces and administered it orally to recipient mice prior to immunization for EAE (Figure 2E). We found that the purified peak EAE fecal RNA ameliorated EAE similarly to peak EAE feces (Figure 2F). No effect was observed with fecal RNA from non-immunized animals or OVA-immunized animals (Figure 2F). Furthermore, we also observed a disease ameliorating effect, as indicated by decreased clinical EAE score, less demyelination and axonal loss as measured by Luxol Fast Blue (LFB) and silver staining, when fecal RNA was administered at the onset of EAE (Figure 2G–I) rather than being given prophylactically.
Figure 2. Both Fecal Transfer and Fecal RNA Transfer from Peak EAE Donor Ameliorate EAE in Recipients.

(A-B) The effect of transfer of feces from different stages of EAE on EAE in recipient mice. (A) Schematic design. Donor mice were immunized with MOG/CFA to induce EAE. Feces were collected at day 0 (naïve), day 8 post immunization (8 d.p.i., prior to symptom onset), and 15 d.p.i. (peak) and orally gavaged to recipient mice 6 days-, 4 days- and 2 days- prior to the induction of EAE in the recipients. (B) Clinical scores of EAE in recipient mice. 0 d.p.i. n=12, 8 d.p.i. n=5, and 15 d.p.i. n=12. Error bars denote mean ± SEM; Friedman test based on scores from the first onset of EAE (7 d.p.i.) until the end of experiment followed by Dunn’s multiple comparison test as compared with group of naïve feces recipients. (C-D), Analysis of the role of live bacteria in the EAE fecal transfer. (C) Experimental scheme. Donor mice were immunized with MOG or OVA. Feces were collected at 15 d.p.i. (EAE peak), heat-inactivated or kept intact, and orally gavaged to recipient mice 6 days-, 4 days- and 2 days- prior to EAE induction in the recipients. (D) Clinical scores of EAE in recipients. n=7 each group; Error bars denote mean ± SEM; Friedman test based on scores from the onset of EAE (11 d.p.i.) until the end of experiment followed by Dunn’s multiple comparison test as compared with the naïve feces-gavaged mice. (E-F) Effect of oral administration of MOG-induced EAE peak fecal RNA on EAE. (E) Experimental scheme. Donor mice were immunized with MOG or OVA. Feces were collected at 15 d.p.i. when the MOG-immunized mice were at peak of EAE. Fecal RNA was isolated from donor feces and orally gavaged 6 days-, 4 days- and 2 days- prior to induction of EAE in the recipients. (F) Clinical scores of EAE in the recipients. n=10 each group; Error bars denote mean ± SEM; Friedman test based on scores from the onset of EAE (11 d.p.i.) until the end of experiment followed by Dunn’s multiple comparison test as compared with the H2O-gavaged group. (G-I) Therapeutic effect of oral administration of EAE peak fecal RNA on established EAE. Fecal RNA isolated from EAE peak or OVA-immunized mice was orally gavaged to EAE recipients at the dose of 10 μg RNA /mouse daily for 7 consecutive days starting when recipients had a disease score = 1. (G) Clinical scores of EAE in the recipient mice, representative data of three independent experiments, H2O (vehicle) n=13, OVA-induced n=12, MOG-induced n=13; Error bars denote mean ± SEM; Friedman test based on scores from the onset of EAE (11 d.p.i.) until the end of experiment followed by Dunn’s multiple comparison test as compared with the H2O-gavaged group. (H) Histopathological evaluation of demyelination with Luxol Fast Blue (LFB) and axonal loss with Bielschowsky’s silver (Silver) staining of representative spinal cord sections from naïve mice and EAE mice treated with feces from H2O (vehicle) or EAE peak EAE feces. Arrows denote demyelination (LFB) and axonal lost (Silver) in H2O (vehicle) treated EAE, scale bars, 500 μm. (I) Quantification of demyelination and axonal loss based on LFB and Silver staining for individual mice. Representative data of three independent experiments with n=6 mice/group, Error bars denote mean ± SEM, one-way ANOVA Dunnett’s multiple comparisons test. All panels: n.s.= not significant, * P<0.05, ** P<0.01, *** P<0.001, **** P<0.0001.
miR-30d is Enriched in Feces from EAE Animals at Peak Disease and in Feces from Untreated MS Patients
We have previously shown that the majority of RNA components found in the feces are small RNAs, and predominantly miRNAs (S. Liu et al. 2016). To identify which fecal miRNAs were generated during EAE, we performed small RNA sequencing in which we measured fecal RNA from peak EAE, OVA-immunized and non-immunized mice. We found that peak EAE mice had an increased level of miR-30d-5p (miR-30d) compared to OVA-immunized and non-immunized mice (Figure 3A and Table S2). We confirmed the increase of miR-30d in peak EAE feces by qPCR (Figure 3B). We also show in Figure 3A miRNAs other than miR-30d that changed in the groups immunized with MOG or OVA. We then asked whether specific fecal miRNAs were increased in subjects with MS. We investigated untreated relapsing-remitting MS subjects and compared them to age- and sex-matched controls. Using small RNA sequencing followed by qPCR confirmation we found that miR-30d, miR-7706 and miR-1246 were higher in untreated MS vs. healthy control (Figure 3C–D and Table S3). Thus, fecal miR-30d was increased in both peak EAE and subjects with MS.
Figure 3. miR-30d Is Enriched in Feces from EAE Animals at Peak Disease and in Feces from Untreated MS Patients.

(A-B), RNA was isolated from feces of non-immunized (naïve) mice, mice immunized with OVA or mice immunized with MOG at 15 days post immunization (peak EAE). (A) Fold change of the changed miRNAs in top 20 abundant miRNAs by small RNA-Seq. Data were normalized to total reads. * P<0.05, ** P<0.01, n=5 each group, Error bars denote mean ± SEM, two-way ANOVA two-stage step-up method of Benjamini, Krieger and Yekutieli multiple comparing to MOG-immunized mice. (B) higher expression of miR-30d-5p in MOG-immunized EAE peak was verified by qPCR; Non-immunized n=9, OVA-immunized n=12, MOG-immunized n=12, Error bars denote mean ± SEM, one-way ANOVA Dunnett’s multiple comparisons comparing to MOG-immunized mice. (C-D), RNA was isolated from feces of non-treated relapsing-remitting MS patients and healthy controls (HC). (C) Fold change of the top 25 miRNAs by small RNA-Seq. Data were normalized to total reads. * P<0.05, **** P<0.0001, n=10 each group; Error bars denote mean ± SEM, two-way ANOVA two-stage step-up method of Benjamini, Krieger and Yekutieli. (D) higher expressions of miR-30d-5p, miR-7706 and miR-1246 in MS patients were verified by qPCR, n=12 each group, Error bars denote median ± 95%CI, Mann Whitney test. n.s.= not significant, * P<0.05, ** P<0.01, *** P<0.001.
To determine which cells were responsible for the upregulation of miR-30d and whether this upregulation was specific for MOG immunization, we immunized mice with either MOG or OVA emulsified in CFA and measured miR-30d in DCs, epithelial cells, macrophages, αβ T cells and γδ T cells in the colon. We found that only DCs upregulated miR-30d and that this effect was dependent on MOG immunization, as non-immunized mice or OVA-immunized mice did not show increased miR-30d expression (Supplementary Figure 1). Thus, colonic DCs are responsible for miR-30d upregulation upon MOG immunization.
Oral Administration of Synthetic miR-30d Ameliorates EAE in a Recipient Gut Microbiome-dependent Manner
To investigate whether miR-30d could affect EAE, we synthesized miR-30d and administered it orally for 7 consecutive days to mice with established EAE. We found that oral administration of synthetic miR-30d at the dose of 250 pmol, but not scrambled sequence, ameliorated EAE (Figure 4A, B). We then performed a dose response experiment (25, 250, 1000, and 2500 pmol) and found an effect at both 250 pmol and 1000 pmol with the optimal dose to be 1000 pmol. No effect was observed at 25 pmol; and 2500 pmol was equivalent to 1000 pmol (Supplementary Figure 2A, B). The protective role of miR-30d at doses of 250, 1000 and 2500 pmol was also observed by immunohistochemistry with antibodies to MBP and neurofilaments (Supplementary Figure 2B), which is consistent with the results obtained using LFB and Silver staining.
Figure 4. Oral Administration of Synthetic miR-30d Ameliorates EAE in a Recipient Gut Microbiome-dependent Manner.

(A-B) synthetic miR-30d or scramble control was orally gavaged to EAE recipients starting at disease onset (day 11, disease score=1) daily at a dose of 250 pmol for 7 consecutive days. (A) Clinical scores of EAE in the recipient mice. Representative data of two independent experiments; H2O(vehicle) n=8, scrambled miR-30d n=13, miR-30d n=11, Error bars denote mean ± SEM, Friedman test based on scores after the beginning of treatment (12 d.p.i) until the end of experiment followed by Dunn’s multiple comparison test as compared with the H2O-gavaged group. (B) Quantification of demyelination and axonal loss for individual mice. Data combined from two independent experiments with n=8 mice/group; Error bars denote mean ± SEM, one-way ANOVA Dunnett’s multiple comparisons test. (C-D) Mice were immunized with MOG and orally administered synthetic miR-30d or scramble control daily at a dose of 1000 pmol for 7 consecutive days. Foxp3+ T cells in the total CD4+ T cell population (C) and in the Vβ11+ CD4+ T cell population (D) in the spleen were analyzed by FACS. Left panel: Representative FACS plots of Foxp3+ CD4+ T cells; Right panel: % of CD4+ Foxp3+ T cells in individual animals (n=4 per group). Error bars denote mean ± SEM; one-way ANOVA Tukey’s multiple comparisons test. (E-G) Effect on EAE of transfer of fecal microbiome from synthetic miR-30d treated mice. Donor mice were immunized with MOG and orally treated with H2O (vehicle), scrambled miR-30d, or miR-30d for 7 consecutive days. Feces were collected and used to colonize mice that were pre-treated with antibiotics (ABX) for 7 days prior to colonization. Recipient mice were then induced for EAE. (E) Experimental scheme. (F) Clinical scores of EAE in the recipient mice. Combined data of two experiments with H2O (vehicle) n=19, scramble n=21, miR-30d n=24; Error bars denote mean ± SEM; Friedman test based on scores from the onset of disease (11 d.p.i) until the end of experiment with Dunn’s multiple comparisons as compared with the H2O-treated donor feces-colonized group. (G) Quantification of demyelination and axonal loss. Values for individual mice are shown, combined from 2 independent experiments with H2O (vehicle) n=19, scramble n=19, miR-30d n=20; Error bars denote mean ± SEM, one-way ANOVA Dunnett’s multiple comparisons test. (H-I) Antibiotics abrogated therapeutic effect of oral miR-30d on EAE. Synthetic miR-30d, scramble control, or H2O (vehicle) was orally gavaged to EAE recipients starting at the onset of disease (day 11, disease score =1) at a dose of 250 pmol daily for 7 consecutive days. Mice were simultaneously gavaged with an antibiotics mixture (ABX). (H) Clinical scores of EAE, Combined data from two independent experiments, H2O (vehicle) n=10, Scramble n=11, miR-30d n=11, Error bars denote mean ± SEM, Friedman test based on scores from the start of the treatment (11 d.p.i) until the end of experiment followed by Dunn’s multiple comparison test as compared with the ABX+H2O-gavaged group. (I) Quantification of demyelination and axonal loss for individual mice from two independent experiments (n=6 mice/group); Error bars denote mean ± SEM, one-way ANOVA Dunnett’s multiple comparisons test. All panels: n.s.= not significant, ** P<0.01, *** P<0.001, **** P<0.0001.
To address potential cellular mechanisms by which oral miR-30d ameliorated EAE, we measured antigen specific Foxp3+ Tregs in the spleen using an anti-Vβ11 antibody which identifies MOG-specific T cells (Bettelli, Baeten, et al. 2006). We found a clear increase in both total CD4+ Foxp3+ Treg population and in MOG-specific Foxp3+ Tregs (Vβ11+ Foxp3+ CD4+ T cells) following oral miR-30d administration (Figure 4C–D, Supplementary Figure 3). No change was observed in Th1 or Th17 populations (not shown). We then asked whether the Treg-promoting effect of oral miR-30d was a result from a direct effect of miR-30d on T cell differentiation. We differentiated naïve CD4+ T cells into Treg, Th1 and Th17 cells in the presence of miR-30d, and found no effect (Supplementary Figure 4A). In addition, we measured the level of miR-30d in the sera of synthetic miR-30d orally-treated mice and found no increase (Supplementary Figure 4B), suggesting that the orally administered synthetic miR-30d did not enter the circulation. Thus, it appears that miR-30d indirectly induces Treg expansion.
The existence of miRNA in the gut lumen and feces has been reported by ourselves and others (Link et al. 2012; S. Liu et al. 2016; Teng et al. 2018; Mohan et al. 2016; Viennois et al. 2019). MiRNAs are stable (Jung et al. 2010) and they can exist in the form of microvesicles/exosomes, which provides further protection from digestion and degradation. In addition, miRNAs may bind to vesicle-free high-density lipoproteins or argonaute proteins which also provide protection (Creemers et al. 2012). To determine whether oral delivered miR-30d can survive gastric acidity and reach the colon intact, we orally delivered miR-30d to GF mice and used a specific LNA miRNA PCR assay to dynamically measure miR-30d in the feces. We found that miR-30d reached the colon intact by 6 hours post gavage and that the orally delivered miR-30d existed both in microvesicles and in a vesicle-free state (Supplementary Figure 5). We used GF mice as they have a more acidic gastric environment than SPF mice (Takahashi et al. 2011) and thus are a more stringent test of microRNA stability when administered orally.
We have previously shown that orally administered miRNAs can shape the microbiome (S. Liu et al. 2016). To determine whether oral synthetic miR-30d administration induced a protective microbiome phenotype, we orally administered synthetic miR-30d or a scrambled control for 7 consecutive days, starting at the time of MOG-immunization. Feces were collected on day 7 post immunization and transferred to naïve recipient mice that had been pre-treated with antibiotics for microbiome depletion and then immunized with MOG/CFA for EAE induction (Figure 4E). We found that microbiome transferred from miR-30d-treated donor mice ameliorated EAE in recipients as compared to transferred from water-treated or scramble-treated donors (Figure 4F, G), suggesting that miR-30d treatment enriched microbes that were of regulatory effect for EAE. To further establish that the therapeutic effect of oral miR-30d required the microbiome, we administered antibiotics at the time of oral gavage with synthetic miR-30d and found that antibiotic administration abrogated the protective effect of oral miR-30d on EAE (Figure 4H, I).
miR-30d Upregulates AMUC_RS06985, a β-galactosidase that Is Essential for the Growth of A. muciniphila
We next investigated which components of the microbiome in the recipient mice were involved in the amelioration of EAE by orally administered miR-30d. We and others have previously reported that host fecal miRNA is able to regulate bacterial gene transcription and growth (S. Liu et al. 2016; Teng et al. 2018). Our data showed above suggest that it was microbe that was increased by miR-30d or increased in the EAE feces that mediated the EAE-improving effect; and we showed that A. muciniphila was increased in the feces of EAE and MS. Thus, we asked whether miR-30d could regulate A. muciniphila. We blasted the miR-30d sequence against the whole genome sequence of A. muciniphila and found that three genes (Locus tags: AMUC_RS06985, AMUC_RS07700, and AMUC_RS10850) were potential targets of miR-30d (Figure 5A). We then cultured A. muciniphila in the presence of synthetic miR-30d or scramble sequence and found that miR-30d promoted the expression of two of these candidate genes (Locus tag: AMUC_RS06985, AMUC_RS07700) (Figure 5B). The function of these genes or their protein products has not been reported. Gene bank sequence annotations suggest that these genes encode putative phosphate-binding protein and putative glycosyl hydrolase family protein, respectively, indicating that these genes may be involved in the utilization of glucose (dextrose). We then asked whether A. muciniphila uses glucose for its survival and growth. As previously reported, A. muciniphila grows well on complete brain heart infusion (BHI) agar which contains 0.2% glucose (Derrien et al. 2004). Deprivation of glucose from BHI (BHI without dextrose) resulted in an impaired bacterial growth (Supplementary Figure 6A), suggesting that glucose is essential for A. muciniphila survival. When we replaced glucose with the disaccharide lactose (can be cleaved by β-galactosidase, also called lactase, into glucose and galactose) in culture, A. muciniphila was able to grow. The use of another disaccharide, sucrose, which requires α-galactosidase to cleave into glucose and fructose, did not support the growth of A. muciniphila (Supplementary Figure 6A). Thus, these data suggest that A. muciniphila has β-galactosidase, which converts lactose to glucose. To test this hypothesis, we used another BHI agar without glucose, but contains mucin, which is favored by A. muciniphila (Derrien et al. 2004), and added X-gal to ascertain the β-galactosidase activity. X-gal is an organic substrate for β-galactosidase that is hydrolyzed to the blue-color product 5,5’-dibromo-4,4’-dichloro-indigo (Kiernan 2007) (Supplementary Figure 6B). We found that A. muciniphila colonies turned blue (Supplementary Figure 6C), confirming that A. muciniphila has β-galactosidase to hydrolyze mucin. This is consistent with a study in which β-galactosidase was found to be among mucin-degrading enzymes in A. muciniphila (Ottman et al. 2017). To determine whether the protein products of either AMUC_RS06985 or AMUC_RS07700 are the β-galactosidase in A. muciniphila, we aligned the protein sequences of AMUC_RS06985 or AMUC_RS07700 with the protein sequences of different β-galactosidases. We found that AMUC_RS06985 was homologous to β-galactosidases of several species including Ktedonobacter racemifer (Figure 5C), Bifidobacterium bifidum, Pectobacterium parmentieri, Streptomyces pratensis, and Rattus norvegicus (not shown). We did not find homology between AMUC_RS07700 and any β-galactosidases. To verify the β-galactosidase activity of AMUC_RS06985, we cloned AMUC_RS06985 into a β-galactosidase-deficient Escherichia coli (E. coli) strain (lacZ M15) and tested the β-galactosidase activity on an agar containing X-gal. We found that introduction of AMUC_RS06985, but not a truncated AMUC_RS06985, conferred β-galactosidase activity in the β-galactosidase-deficient E. coli strain (Figure 5D). These data identified AMUC_RS06985 as a β-galactosidase in A. muciniphila.
Figure 5. miR-30d Enhances β-galactosidase of A. muciniphila and Expands A. muciniphila in vivo.

(A) A. muciniphila genes (AMUC_RS06985, AMUC_RS07700, AMUC_RS10850) were predicted to be targeted by miR-30d by sequence blast and predicted for secondary structure property (minimum free energy, mfe) by RNAhybrid. (B) A. muciniphila was grown in the presence of synthetic miR-30d, scramble or H2O (vehicle). Transcripts of the predicted targeting genes at logarithmic phase were quantified by qPCR normalized to 16S rRNA. H2O (vehicle) n=13, scramble n=15, miR-30d n=15, Error bars denote mean ± SEM, one-way ANOVA Dunnett’s multiple comparisons test. (C) Alignment protein sequence of AMUC_RS06985 of A. muciniphila and β-galactosidase of Ktedonobacter racemifer (K. racemifer). (D) AMUC_RS06985 of A. muciniphila or its truncated sequence was cloned into a β-galactosidase-deficient (lacZΔM15) E. coli. The cloned E. coli colonies were grown on an X-gal-containing agar. (E) A. muciniphila was grown on BHI agar containing lactose and β-galactosidase activity indicator X-gal, and was treated with synthetic miR-30d or scramble. β-galactosidase activity was quantified according to the color change, n=5 each group, Error bars denote mean ± SEM, paired t test. (F-I) The effect of oral administration of synthetic miR-30d on the gut microbiome. Mice were immunized with MOG and orally gavaged with 250 pmol synthetic miR-30d, scramble or H2O (vehicle) for 7 days. Feces were collected at day 7 and bacterial 16S rDNA sequence-based microbiome surveys were performed. (F) Experimental scheme. (G) Principal coordinates analysis (PCoA) based on weighted UniFrac metrics and (H) Relative abundance of bacteria by 16S sequencing was classified at a species-level taxonomy. H2O (vehicle) n=14, scramble n=13, miR-30d n=13. One-way ANOVA Dunnett’s multiple comparisons test. Arrow identifies species that were significantly higher in miR-30d group compared to the other two groups. H2O (vehicle) vs miR-30d P= 0.0129, scramble vs miR-30d P= 0.0087. (I) qPCR quantification of the relative abundance of A. muciniphila by measuring the 16S rDNA gene, referenced to universal 16S rDNA. H2O (vehicle) n=14, scramble n=14, miR-30d n=13. Error bars denote mean ± SEM, One-way ANOVA Tukey’s multiple comparisons test.
We and others have shown that miRNAs can enter bacteria as measured by confocal microscopy and flow cytometry, and regulate the gene expression and growth of bacteria (S. Liu et al. 2016; Teng et al. 2018). To specifically determine whether A. muciniphila could take up miR-30d, we co-cultured A. muciniphila with miR-30d and measured bacterial internalization of miR-30d by in situ hybridization and transmission electron microscopy and found internalization of miR-30d in A. muciniphila co-cultured with miR-30d (Supplementary Figure 7A). To determine whether miR-30d could increase the Akkermansia population in vitro, we co-cultured miR-30d with a culture of A. muciniphila/E. coli and found that miR-30d significantly increased the ratio of A. muciniphila to E. coli (Supplementary Figure 7B). We next asked whether miR-30d affected β-galactosidase in A. muciniphila. We cultured A. muciniphila on agar containing lactose and X-gal, and treated them with miR-30d. We found that miR-30d-treated A. muciniphila exhibited a significant enhanced β-galactosidase activity, compared to scramble-treated A. muciniphila (Figure 5E). Thus, miR-30d can promote A. muciniphila growth by enhancing bacterial β-galactosidase.
We then asked whether oral administration of synthetic miR-30d could affect the abundance of A. muciniphila in mouse gut. We gavaged mice with synthetic miR-30d for 7 days starting at the time of MOG-immunization and then analyzed the fecal microbiome by 16S sequencing (Figure 5F). We found that oral administration of synthetic miR-30d did not change the overall microbial structure, as suggested by weighted UniFrac (Figure 5G). However, we found an increase of A. muciniphila in miR-30d-treated mice as compared to animals given a scrambled sequence or vehicle (Figure 5H and Table S4). We confirmed this result by qPCR (Figure 5I). Thus, it appears that oral miR-30d administration acts by expanding A. muciniphila.
A. muciniphila Ameliorates EAE by Stimulating Treg-driving Cytokines in Dendritic Cells
To directly investigate whether there was an ameliorating effect of A. muciniphila on EAE, we orally treated established EAE with A. muciniphila for 7 consecutive days. We observed a decrease in disease score associated with reduced demyelination and axonal loss (Figure 6A, B). As observed with synthetic oral miR30d (Figure 4C, D), A. muciniphila treatment increased both MOG-specific Foxp3+ Tregs and total Tregs in the spleen (Figure 6C, D).
Figure 6. A. muciniphila Promotes Tregs by Stimulating the Expression of Treg-driving Cytokines in Dendritic Cells and Suppresses EAE.

(A-B) Effect of orally gavaged A. muciniphila on established EAE. Fresh cultured A. muciniphila, E. coli at logarithmic phase, or Brain Heart Infusion broth (Medium) was orally administered to EAE recipients in culture medium daily starting at the onset of disease (day 11, disease score=1) for 7 consecutive days. (A) Clinical scores of EAE in the recipient mice. Combined data of 3 experiments. Medium n=23, E. coli n=27, A. muciniphila n=28, Error bars denote mean ± SEM, Friedman test based on scores from the start of the treatment (11 d.p.i) until the end of experiment followed by Dunn’s multiple comparison test comparing A. muciniphila-treated mice with other groups. (B) Quantification of demyelination and axonal loss for individual mice. Combined data of three independent experiments (n=6 mice/group); Error bars denote mean ± SEM, one-way ANOVA Dunnett’s multiple comparisons test. (C-D) Freshly cultured A. muciniphila, E. coli at logarithmic phase, or Medium was orally administered to MOG-immunized mice daily for 7 consecutive days. Foxp3+ T cells in the total CD4+ T cell population (C) and in the CD4+ Vβ11+ T cell population (D) in the spleen were analyzed by FACS. Left panel: Representative FACS plots of CD4+ Foxp3+ T cells; Right panel: % of CD4+ Foxp3+ T cells in individual animals (n=4 per group). Error bars denote mean ± SEM, One-way ANOVA Tukey’s multiple comparisons test. (E) Sorted naive CD4+ T cells from Foxp3-GFP reporter mice were induced toward Treg cell differentiation for 3 days in the presence of TGF-β plus IL-2 and either A. muciniphila or E. coli. (F) CD11c+ dendritic cells were sorted from the mesenteric lymph nodes (MLN) of naïve mice and stimulated with A. muciniphila or E. coli. Sorted naive CD4+ T cells from Foxp3-GFP reporter mice were added 24 hours after and were induced toward Treg cell differentiation for 3 days in the presence of TGF-β and IL-2. (E-F) 72 h after Treg induction, live CD4+ cells were gated and determined for Foxp3+ (GFP+) T cells. Left panel: Representative FACS plots of CD4+ Foxp3+ T cells; Right panel: % of CD4+ Foxp3+ T cells in individual replicates. Data represent the mean ± SEM, (E) n=4 and (F) n=9, one-way ANOVA Dunnett’s multiple comparisons test. (G) CD11c+ dendritic cells were sorted from the MLN of naïve mice and stimulated with E. coli or A. muciniphila for 24 hours. RNA was isolated and quantified for Tgfb, Il6, and Il1b by qPCR. Data represent the mean ± SEM, n=7, one-way ANOVA Dunnett’s multiple comparisons test. All panels: n.s.= not significant, * P<0.05, ** P<0.01, *** P<0.001, **** P<0.0001.
To explore the potential mechanism by which A. muciniphila induces Foxp3+ Tregs, we first investigated whether A. muciniphila had a direct effect on Treg differentiation by co-culturing inactivated A. muciniphila or E. coli (as a control) with naïve CD4+ T cells. We found that both bacteria minimally induced Foxp3+ Tregs (Figure 6E), suggesting that A. muciniphila does not directly induce more Tregs as compared to E. coli. DCs from mesenteric lymph node (MLN) are known to play a crucial role in Treg induction (Cording et al. 2014; Coombes et al. 2007; Pezoldt et al. 2018). We then isolated DCs from MLN, pulsed them with inactivated A. muciniphila or E. coli, and co-cultured them with naïve CD4+ T cells. We found that A. muciniphila-pulsed DCs induced significantly more Foxp3+ Tregs (Figure 6F). Thus, DCs are important for the induction of Foxp3+ Tregs by A. muciniphila. We next investigated how A. muciniphila increased the ability of DCs to induce Foxp3+ Tregs. We measured mRNAs of cytokines involved in CD4+ T cell differentiation, including Tgfb, Il6 and Il1b. We found that both A. muciniphila and E. coli induced Tgfb expression to a similar extent; however, the expression of Il6 and Il1b, known to inhibit Foxp3+ Tregs generation (Bettelli, Carrier, et al. 2006; Sutton et al. 2006; Lee et al. 2012), was significantly lower in A. muciniphila-stimulated DCs as compared to E. coli-stimulated DCs (Figure 6G), suggesting that A. muciniphila preferentially stimulates Treg-inducing cytokines. Taken together, these data suggest that miR-30d promotes A. muciniphila growth in the gut that in turn induce Tregs in a mechanism dependent on increased TGF-β and decreased IL-6 and IL-1β production by DCs.
DISCUSSION
We and others have found that miRNAs are present in the gut lumen and feces of humans and animals (Link et al. 2010; S. Liu et al. 2016; Viennois et al. 2019). MiRNAs are generally stable (Jung et al. 2010) due to several mechanisms which include being protected in extracellular vesicles (EV) and being associated with high-density lipoproteins or argonaute proteins (Creemers et al. 2012). We have previously found that fecal miRNA exists both in extracellular vesicles and in an extracellular vesicle-free form (S. Liu et al. 2016). MiRNAs derived from plants have been found in the EV-form and oral delivery of the EV-form of miRNAs to animals modulates the gut microbiome (Teng et al. 2018). We have reported that synthetic miRNA given orally modulates microbes (S. Liu et al. 2016). Here we found that orally delivered synthetic miR-30d remains intact in the feces and exists in the forms of microvesicles and vesicle-free, confirming that miRNAs survive the digestive system. The mechanism underlying the integration of orally delivered miRNAs into microvesicles in the gut remains to be determined. An evolutionary conserved self-assembly mechanism (I. A. Chen & Walde 2010; Gudlur et al. 2012; Budin et al. 2009) may be involved, in which nucleotides are passively translocated across the vesicle membrane, mediated by electrostatic and hydrophobic interactions between the fatty acids and nucleotides (I. A. Chen et al. 2005; Mansy & Szostak 2008). We (S. Liu et al. 2016) and others (Teng et al. 2018) have found that miRNAs can be taken up by the gut microbes and subsequently alter bacterial gene expression. Here we used in situ hybridization and transmission electron microscopy to demonstrate that exogenous miR-30d can be internalized by A. muciniphila. We used qPCR to demonstrate that miR-30d modulates bacterial gene expression of A. muciniphila. Thus, it is also possible that the horizontal gene transfer (HGT), a widespread naturally occurring mechanism evolutionary important for the transmission of genetic material, including RNAs, between organisms and cells, may play a role in this process (Ochman et al. 2000; Kirschbaum et al. 2015; H. Liu et al. 2010; Dunning Hotopp 2011; Kim et al. 2019). However, the mechanisms by which HGT regulates gene expression in the recipient cells are not clear.
A. muciniphila is a mucin-degrading bacterium (Derrien et al. 2004) that has been reported to have anti-inflammatory properties. It has been shown that A. muciniphila improved diet-induced obesity (Everard et al. 2013) in a mechanism likely dependent on a specific outer membrane protein (Amuc_1100) (Plovier et al. 2017). Furthermore, oral administration of A. muciniphila was shown to enhance glucose tolerance and attenuate adipose tissue inflammation by inducing Foxp3+ Tregs in the visceral adipose tissue (Shin et al. 2014). Of note, treatment with metformin increases A. muciniphila (Wu et al. 2017), and metformin treatment has been shown to attenuate EAE (Nath et al. 2009). Consistent with these studies, Hansen et al. reported that early life treatment with vancomycin propagates A. muciniphila and reduces diabetes incidence in the NOD mouse (Hansen et al. 2012). Furthermore, A. muciniphila has been shown to be associated with the anti-seizure effects of a ketogenic diet (Olson et al. 2018) and to improve disease in the SOD1-Tg model of amyotrophic lateral sclerosis (Blacher et al. 2019). Decreased A. muciniphila is associated with progeria in humans and transplantation of A. muciniphila enhanced healthspan and lifespan in progeroid mouse models (Barcena et al. 2019). Several groups, including ours have reported an increase of A. muciniphila in the gut microbiome of MS subjects (Jangi et al. 2016; Tremlett et al. 2016; Cekanaviciute et al. 2017; Berer et al. 2017). In this study, we found that cell-mediated autoimmune diseases such as EAE in mice and MS in humans induced miR-30d upregulation in intestinal DCs. Although the mechanisms underlying this miRNA upregulation remains to be elucidated, we found that oral administration of miR-30d expanded A. muciniphila in the EAE mouse gut by upregulating the gene expression of AMUC_RS06985, which we identified to be a β-galactosidase in A. muciniphila. A. muciniphila in turn upregulated TGF-β and downregulated IL-6 and IL-1β in MLN DCs, favoring Treg expansion that control effector T cells during EAE (Koutrolos et al. 2014).
It was unexpected and perhaps counter-intuitive that the microbiome from diseased animals would provide protection to naïve mice. We believe that the increase in Akkermansia that occurs at the peak of disease and that we and others observed in MS patients (Jangi et al. 2016; Cekanaviciute et al. 2017) represents a protective mechanism associated with recovery from the disease and is not part of the pathogenic mechanism that induces or maintains the disease. Most patients with MS spontaneously recover from acute attacks without treatment (Ransohoff et al. 2015). Furthermore, in the acute EAE model of MS, recovery from attacks also occurs without treatment (Mayo et al. 2014; Rothhammer et al. 2018; Rojas et al. 2019) and is associated with the development of regulatory T cells (O’Connor et al. 2007; Oukka 2007). We thus hypothesize that the increased miR-30d and A. muciniphila in the gut/stool of EAE mice and MS patients is a protective response triggered by the disease. Consistent with our findings that elevated Akkermansia in the gut can have a protective function in the EAE model, a recent study shows that pretreatment of mice by intragastric administration of norfloxacin increases Akkermansia, induces Tregs and reduces EAE (H. Chen et al. 2019).
Given that the microbiome plays an important role in health and disease (An et al. 2014; Honda & Littman 2016; Hooper et al. 2012; Qin et al. 2012; Tremaroli & Bäckhed 2012; Fung et al. 2017; Jangi et al. 2016), a major unmet need is to find approaches by which the microbiome can be specifically manipulated (Schmidt et al. 2018). FMT has been shown to be effective in the treatment of recurrent Clostridium difficile infection (van Nood et al. 2013), and is being investigated as a potential treatment for a number of diseases (Schmidt et al. 2018). Although promising, FMT is a complex biologic intervention without well-defined targets (Ianiro et al. 2014). More importantly, in practice, only feces from “Healthy” donor are currently used in most FMTs (Schmidt et al. 2018). While their effects on diseases have not been fully evaluated, feces from patients and diseased models have been excluded from FMT trials. Here, we have made the unexpected finding that feces from peak diseased donors improved the disease. We further identified a synthetic miRNA that can specifically modulate the microbiome and ameliorate an inflammatory autoimmune disease. Of note, we identified the miRNA in the feces of both EAE mice and untreated MS patients, which suggests that fecal miRNAs may represent a previously unrecognized process by which the host regulates the microbiome. Our findings identify an avenue for modulating the microbiome and raise the possibility that the feces of animals with disease and patients may be enriched for miRNAs with therapeutic properties.
STAR★METHODS
LEAD CONTACT AND MATERIALS AVAILABILITY
Further information and requests for resources and reagents should be directed to and will be fulfilled by the Lead Contact, Shirong Liu (sliu22@bwh.harvard.edu).
EXPERIMENTAL MODEL AND SUBJECT DETAILS
Human Fecal Specimens
Human fecal specimens were collected from 12 healthy volunteers (9 females, average 49 years of age) and 12 untreated relapsing-remitting multiple sclerosis patients (11 females, average 47 years of age). All subjects gave written consent according to a protocol approved by the Institutional Review Board at Brigham and Women’s Hospital. All subjects were excluded for GI disorders, antibiotics, or probiotic use in the last 2 months and during the sampling period. All stool samples were collected using Commode specimen collection system (Fisher Scientific) and stored at −80 °C until further processing.
Mice and Fecal Specimen Collection
Animal procedures were approved by the Harvard Medical Area (HMA) Standing Committee on Animals. C57BL/6J mice and Foxp3GFP+ mice (Stock No. 023800) were from The Jackson Laboratory and acclimated in the local animal facility for at least two weeks prior to study initiation. Otherwise specified, all mice used were 6–8 weeks old at the initiation of study. For all experiments (fecal transplantation, fecal RNA transplantation, synthetic microRNA administration, bacteria administration), mice of same age and gender were ear-tagged and randomly allocated into groups and co-housed. Mice were housed under specific pathogen-free conditions at the Harvard Institutes of Medicine and the Hale Building for Transformative Medicine at Brigham and Women’s Hospital. Mice that received oral administration of Akkermansia muciniphila (A. muciniphila) or E. coli were housed in BSL-2N facility. In some experiments, germ-free C57BL/6 mice (Taconic Biosciences, Inc) were kept in the germ-free container at the Hale Building for Transformative Medicine at Brigham and Women’s Hospital and were used immediately upon arrival. Fecal specimens were collected immediately upon defecation, snap frozen, and stored at −80 °C for analysis.
EAE Induction
EAE was induced by injecting 6- to 8-week-old female C57BL/6J mice with 150 μg MOG35–55 peptide (Genemed Synthesis) emulsified in complete Freund’s adjuvant (CFA) (BD™ Difco™) per mouse subcutaneously in the flanks, followed by intraperitoneal administration of 150 ng pertussis toxin (List biological laboratories, Inc.) per mouse on days 0 and 2 as described (Mayo et al. 2014). In some experiments, as an immunization control, 150 μg ovalbumin (OVA, Cat#A5503–25G, Sigma) was used to replace MOG35–55. Clinical signs of EAE were assessed according to the following score: 0, no signs of disease; 1, loss of tone in the tail; 2, hind limb paresis; 3, hind limb paralysis; 4, tetraplegia; 5, moribund.
Bacteria Strains, Growth, and Administration
Akkermansia muciniphila Derrien et al. (ATCC® BAA-835™) and E. coli K-12 (Strain #: 7296, The Coli Genetic Stock Center at Yale) were grown anaerobically in Brain Heart Infusion (BHI) medium (SKU 53286, Sigma Aldrich). For mice treatment, 5×10⁸ freshly cultured bacteria at logarithmic phase in 200 μl BHI medium were given by oral gavage daily for 7 consecutive days. For in vitro stimulation of cultured cells (Figure 6E–G), A. muciniphila and E. coli K-12 were cultured to a logarithmic phase and harvested by spinning down at 12600 rpm. Bacteria were resuspended in sterile PBS to a density of OD600 =1. The bacteria suspensions were inactivated by eight cycles of freezing at −80 °C and thawing at 37 °C. The inactivation was confirmed by culturing the suspension to find no growing clone.
In experiments testing β-galactosidase activity in A. muciniphila (Supplementary Figure 6), freshly cultured A. muciniphila at logarithmic phase was spread or streaked over the surface of agar (1.5%) containing one of the following broth: BHI (with 0.2% dextrose), BHI w/o Dextrose (Ordering code: B2701–09, United States Biological), BHI w/o Dextrose plus 0.2% lactose (Catalog No. L6–500, Fisher Scientific), BHI w/o Dextrose plus 0.2% sucrose (SKU S0389, Sigma Aldrich), BHI w/o Dextrose plus 0.2% mucin from porcine stomach (SKU M1778, Sigma Aldrich), or BHI w/o Dextrose plus 0.2% mucin from porcine stomach and plus 400 μg/ml X-Gal (Catalog No. X4281, Gold Biotechnology), and incubated at 37°C anaerobically for 5 days.
In experiments investigating the effect of miR-30d on A. muciniphila β-galactosidase (Figure 5E), 10 μl of freshly cultured A. muciniphila at logarithmic phase was inoculated to a Ø10 mm sterile disk (Item ID: 74146, Millipore Sigma) on BHI w/o Dextrose plus 0.2% lactose and plus 400 μg/ml X-Gal, and incubated at 37°C anaerobically for 5 days, during which 30 μl of 100 μM synthetic miR-30d, or scrambled miR-30d was added at 24 h and 48 h after inoculation. β-galactosidase activity was quantified by measuring the color changed (blue) area around the disk with A. muciniphila using ImageJ.
METHOD DETAILS
Histopathology
Mice were euthanized at the termination of experiments and were intracardially perfused with PBS. Lumbosacral spinal cords were fixed with Bouin’s Fixative solution (RICCA Chemical). Tissue was processed and stained as previously described (Mayo et al. 2014). Paraffin embedded serial sections were stained with Luxol Fast Blue for myelin, Bielschowsky silver for axons. In dose response experiments, additional evaluation of demyelination and neuronal loss was carried out using rabbit anti-MBP (1:1000; Dako) and neurofilament (1:3000; Abcam) respectively and with secondary biotinylated antibodies. Avidin-peroxidase and 3,4-Diaminobenzidine was used as the color substrate (Reuter et al. 2015). The demyelinated area and axonal/neuronal loss were determined using ImageJ software (National Institutes of Health, USA) and the percentages of demyelinated and axonal/neuronal lost area out of total area were calculated.
Fecal RNA Isolation
Total RNA (including miRNA) was extracted from stool specimens using mirVana™ miRNA isolation kit (catalog number: AM1560, Ambion®) following the established protocol (S. Liu et al. 2016). Briefly, mouse or human stool was homogenized in sterile PBS. RNA was extracted with acid Acid-Phenol: Chloroform. Aqueous phase precipitation was performed by mixing with 1.25 volumes of 100% ethanol, followed by purification on a glass fiber filter cartridge. Following elution, RNA quality was assessed by A260/A280 ratios using ND-1000 Nanodrop and Agilent 2100 Bioanalyzer (Agilent Technologies). The purity of RNA was A260/A280: 1.8~2.0, A260/A230: ≥1.3. RNA isolates were stored at −80 °C until use.
Fecal Transplantation, Fecal RNA Treatment
For mouse fecal transplantation, 5 mg per mouse of feces from donor mice was suspended in 200 μl sterile PBS and was administered to recipient C57BL/6J mice by orally gavage at the time showed in the figures. In some cases, feces were inactivated by heating at 80 °C for 60 min to kill bacteria while keeping miRNA in the feces (Jung et al. 2010). To investigate the effect of fecal RNA on EAE, 10 μg of RNA isolated from feces which is about 1/5 of total RNA in one fecal pellet, as described above, was eluted in 200 μl nuclease-free water and administered to mouse by orally gavage at the time as indicated in the figures.
Small RNA Sequencing
Small RNA-seq libraries were constructed from fecal RNA isolates using NEXTflex™ Small RNA-Seq Kit (Bioo Scientific Corporation., USA). 500 ng of RNA was used as input material. The library was prepared with a unique indexed primer so that libraries could be pooled into one sequencing flow cell. Multiplex adaptor ligations, primer hybridization, reverse transcription reaction and PCR amplification were performed according to the manufacturer’s protocol. Libraries were further purified with a gel size selection using Blue Pippin (Sage Science, Inc. USA). The obtained libraries were checked for quality with Agilent 2200 TapeStation and were sequenced with the Illumina NextSeq 500 System (50 nt, single read) at the Biopolymers Facility at Harvard Medical School. Data were analyzed following the exceRpt small RNA-seq pipeline V4.6.2 (Subramanian et al. 2015). Normalization and differential expression were performed with the R package DESeq2 v.1.10.1 (R version 3.3.2) (Love et al. 2014). Sequencing data are available at Sequence Read Archive (SRA)(https://www.ncbi.nlm.nih.gov/sra).
MiRNA Measurement by qPCR
Quantitative PCR (qPCR) was performed to verify the relative level of miRNAs that were identified in small RNA-Seq. 200 ng of total fecal RNA was input for miRNA cDNA synthesis using TaqMan™ Advanced miRNA cDNA Synthesis kit (Applied Biosystems). MiRNA cDNAs were then quantified by real-time PCR using TaqMan® Fast Advanced Master Mix and TaqMan Advanced MiRNA Assays (Applied Biosystems) on QuantStudio™ 7 Flex Real-Time PCR System (Applied Biosystems) following the manufacturer’s protocol: hsa-miR-21–5p/mmu-miR-21a-5p (Assay ID: mmu482709_mir), mmu-miR-30d-5p/ hsa-miR-30d-5p (Assay ID: mmu478606_mir), hsa-miR-7706 (Assay ID: 480578_mir), hsa-miR-1246 (Assay ID: 477881_mir). A reference gene for quantifying fecal miRNA using qPCR has not been established. MiR-21 has been detected in both mouse and human feces (S. Liu et al. 2016; Link et al. 2010; Schönauen et al. 2018; Johnston et al. 2018). Our small RNA-seq data suggested that miR-21 was highly presented in mouse and human feces and was not distinguishable between healthy and MS patient and between naïve and immunized mice. We thus used miR-21 as a reference to measure the relative level of miR-30d, miR-1246 and miR-7706 using comparative CT method (Schmittgen & Livak 2008).
Antibiotic Treatment
In order to investigate the involvement of gut microbiome in the effect of miRNA, to deplete bacteria, mice were given a mixture of antibiotics (ampicillin 1 mg/ml, vancomycin 0.5 mg/ml, neomycin 1 mg/ml, metronidazole 1 mg/ml, and streptomycin 1 mg/ml (Fisher Scientific)), following an established protocol (Benjamin et al. 2013) in drinking water (Figure 4E–G) or in 200μl nuclease-free water by orally gavage (Figure 4H–I), for 7 consecutive days. Bacteria depletion was confirmed by culturing the colonic luminal content anaerobically on BHI agar and aerobically on LB agar.
16S rDNA Analyses of Gut Microbiome
16S rDNA sequence survey was performed following our established procedure (S. Liu et al. 2016; Tankou et al. 2018). Briefly, DNA in the mouse feces was extracted using a QIAamp Fast DNA Stool Mini Kit (Qiagen). Amplicons spanning variable region 4 (V4) of the bacterial 16S rRNA gene were generated with primers containing barcodes (515F, 806R) from the Earth Microbiome project (Caporaso et al. 2012) using HotMaster Taq and HotMaster Mix (QuantaBio) and paired-end sequenced on an Illumina MiSeq platform at the Harvard Medical School Biopolymer Facility. Data was processed using the QIIME 2 software following an established protocol (Caporaso, Kuczynski, Stombaugh, Bittinger, Bushman, Costello, Fierer, Pena, Goodrich, Gordon, Huttley, Kelley, Knights, Koenig, Ley, Lozupone, McDonald, Muegge, Pirrung, Reeder, Sevinsky, Turnbaugh, Walters, Widmann, Yatsunenko, Zaneveld & Knight 2010a; Caporaso et al. 2012). Briefly, sequences were de-multiplexed and quality filtered in which reads were truncated if two consecutive bases fall below a quality score of Q20 (1% error), and reads that were <75% of full length were discarded (Caporaso et al. 2012). OTUs were picked using the open reference method sumaclust (http://metabarcoding.org/sumatra) and sortmeRNA (Kopylova et al. 2012). Taxonomy was picked against the Greengenes database (http://greengenes.secondgenome.com) using a 97% similarity threshold. Sequencing data accompanying this study are available at Sequence Read Archive (SRA)(https://www.ncbi.nlm.nih.gov/sra).
Fecal Microbe Quantification by qPCR
DNA extracted from fecal pellets as above described was verified for specific bacteria abundance. Quantitative PCR (qPCR) analysis was conducted using a QuantStudio™ 7 Flex Real-Time PCR System (Applied Biosystems). A. muciniphila was quantified by Taqman amplification reactions consisting of DNA, TaqMan® Universal PCR Master Mix (Applied Biosystems), and primer pairs as follows: All bacteria (universal 16S rDNA, reference): Forward: TCCTACGGGAGGCAGCAGT, Reverse: GGACTACCAGGGTATCTAATCCTGTT, Probe: CGTATTACCGCGGCTGCTGGCAC (Nadkarni et al. 2002); A. muciniphila 16S rRNA gene: Forward: CGGTGGAGTATGTGGCTTAAT, Reverse: CCATGCAGCACCTGTGTAA, probe: CGCCTCCGAAGAGTCGCATG. In some experiment, E. coli 16S rRNA gene was detected using the primers and probe: Forward: AGGCCTTCGGGTTGTAAAGT, Reverse: CGGGGATTTCACATCTGACT, Probe: CAGAAGAAGCACCGGCTAAC (S. Liu et al. 2016). The relative quantity was calculated using the comparative CT method normalizing to the amount of all bacteria in the sample (Schmittgen & Livak 2008).
MiRNA Target Prediction
The sequence of miR-30d-5p (uguaaacauccccgacuggaag) was blasted against whole genome sequence of A. muciniphila using the NCBI blast tool for sequence pairing. RNAhybrid was used to characterize the minimum free energy of secondary structure binding between miR-30d and potential targeting A. muciniphila RNA (Rehmsmeier et al. 2004; Krüger & Rehmsmeier 2006).
Synthetic MiRNA Treatment and Dosing
Synthetic mission® miRNA mimics of miR-30d-5p (uguaaacauccccgacuggaag) and scramble sequence (guggaugaaccgcaacuaccau) were from Sigma-Aldrich. We were able to isolate ~50 μg RNA including ~300 ng (~20 pmol) miR-30d from a mouse fecal pellet (~25 mg) at EAE peak. Thus, in the dose response experiment in which animals were orally dosed with miR-30d, we used doses of 25 pmol, 250 pmol, 1000 pmol, and 2500 pmol which are within dose range of miR-30d in the dynamic mouse gut. We found that a dose of 250 pmol and higher was able to ameliorate EAE (Supplementary Figure 2). Therefore, unless specified, in experiments where synthetic miRNA was orally given to animals as a treatment, a dose of 250 pmol was administered daily in 200 μl nuclease-free water for 7 consecutive days. Feces were collected 24 hours post last synthetic miRNA administration for bacteria abundance detection. The concentration of miR-30d in the serum was ~40 nM both in miR-30d-treated mice and in untreated mice. Thus, for in vitro experiments in which we investigated the direct effect of miR-30d on T cells (Supplementary Figure 4A), a concentration of miR-30d of 40 nM was chosen.
Dynamics of Oral Administered miR-30d in the Gut
Synthetic miR-30d was orally administered to germ-free mice and fecal specimen were collected at the gavage (0 hour), and every 2 hours post administration. Fecal sample was soaked in 2 ml cold PBS for 5 min, and dissociated with PowerLyzer®24 homogenizer (Mo Bio Laboratories, CA). The suspension was centrifuged at 300 ×g, 4 °C for 10 min, followed by the additional centrifugation at 2000×g, 4 °C for 15 min. The supernatant was collected and filtered through a 0.8 μm filter (EMD Millipore, MA) to further remove debris. Microvesicle (MV), exosome and vesicle-free fractions were sequentially separated from the filtrate with 0.22 μm filter (EMD Millipore), 0.02 μm filter (GE Healthcare) and 3 kDa Amicon Ultra Centrifugal Filters (EMD Millipore), as previously described (Wei et al. 2017). Total RNA was isolated from each fraction using Total RNA Purification Kit (Norgen Biotek, Canada). The RNA concentrations were determined using Quant-iT RiboGreen RNA Assay Kit (Thermo Fisher Scientific). Two nanogram of total RNA was used in 10 μl reverse transcription reaction with Universal cDNA Synthesis kit II (Exiqon). The qPCR reaction was performed using the ExiLENT SYBR Green master mix and pre-designed LNA primers (Exiqon) and miR-21 as reference. In experiment of determine miRNAs in serum (Supplementary Figure 4B), serum RNA was isolated using Plasma/Serum RNA Purification Kit (Norgen Biotek Corporation). The levels of miRNA were quantified with qPCR using the approach described in this section.
Bacterial Gene Transcript Quantification
A. muciniphila was cultured in the presence of H2O (vehicle), 3 μM miRNA mimics miR-30d, and scrambled miR-30d to a logarithmic phase and stopped by chilling on ice and stabilized with RNAlater® Solutions (Ambion). Total bacterial RNA from cultured bacterial was extracted using TRIzol® Max™Bacterial RNA isolation Kit (Ambion) following the manufacturer’s protocol. cDNA was prepared using High Capacity cDNA Reverse Transcription Kit (Applied biosystems). QPCR was performed using Taqman Universal PCR Master Mix and TaqMan® Gene Expression Assay primer pairs as following: A. muciniphila AMUC_RS06985: Forward: CCATTTACGGCAGAAACAGC, Reverse: GCCAGGGAGAGGGTTTTTAC, probe: CGTGAAGGAAATAGCCCTGA. A. muciniphila AMUC_RS07700: Forward: TGAAAGGGAGGGTTCATCTG, Reverse: ATCCACACGGGCAGAGTAAT, probe: TTTATAGAAATGCGGGTGGC. A. muciniphila AMUC_RS10850: Forward: CAACATGGAAACCTCCATCC, Reverse: GACCAGTTCCTGGGTGACAT, probe: AGACTTTTGTGGACATGGGG. The relative quantity of each bacterial gene transcripts was calculated by the ΔCt method and referenced to A. muciniphila 16S rRNA: Forward: CGGTGGAGTATGTGGCTTAAT, Reverse: CCATGCAGCACCTGTGTAA, probe: CGCCTCCGAAGAGTCGCATG.
β-galactosidase Activity of AMUC_RS06985
The genes AMUC_RS06985, truncated AMUC_RS06985, and AMUC_RS07700 were amplified by PCR using the following primers (with restriction sequences underlined): AMUC_RS06985 (XbaIAMUC_RS06985Fwd: 5’-GCTCTAGAGCATGAAATTTGTCGCCAAAATCCTG-3’, KpnIAUMC_RS06985Rev: 5’-GGGGTACCCCTTATTCAATGCTCTTGAGCACTTC-3’), truncated AMUC_RS06985 (XbaITruncatedAMUC_RS06985Fwd:5’-GCTCTAGAGCATGAAATTTGTCGCCTAATAATCCTGACCATCGCCGC −3’, KpnITruncatedAUMC_RS06985Rev:5’-GGGGTACCCCTTATTCAATGCTCTTGAGCACTTC-3’), and AMUC_RS07700 (XbaIAMUC_RS07700Fwd:5’-GCTCTAGAGCATGAATGTTATGTCGAAACGTTTTTTTGCC-3’, KpnIAUMC_RS07700Rev:5’-GGGGTACCCCATTTACCGGGTCAGCATGCCGTTGGCTAT-3’).
PCR products of the genes containing XbaI and KpnI restriction sites were cloned into pUC18 (a gift from Joachim Messing, Addgene plasmid # 50004) (Norrander et al. 1983) between the XbaI and KpnI sites of the vector. TOP10 competent E. coli cells (Genotype: F− mcrA (mrr-hsdRMS-mcrBC) Φ80lacZΔM15 ΔlacX74 recA1 araD139 Δ(araleu)7697 galU galK λ− rpsL (StrR) endA1 nupG) (Invitrogen) were transformed with constructed plasmids by heat shock. Cells with ampicillin resistance were selected by plating the transformed cells on LB agar containing 100 μg/ml Ampicillin. E. coli strains expressing the intended inserts were confirmed by sequencing using primers: M13pUC-Fwd 5’-CCCAGTCACGACGTTGTAAAACG-3’ and M13pUC-Rev 5’-AGCGGATAACAATTTCACACAGG-3’. To detect β-galactosidase activity of the constructed strains, bacteria were streaked on LB agar containing 100 μg/ml ampicillin and 400 μg/ml X-gal, and grew at 37°C for 3 days.
Protein Sequence Alignment
The sequence of protein product of A. muciniphila gene AMUC_RS06985 (Accession ID: WP_012420345) was aligned to sequences of beta-galactosidases of different species available at UniProt (https://www.uniprot.org) using Protein BLAST tool from NCBI. Typical positive blast hit, the beta-galactosidase of Ktedonobacter racemifer DSM 44963 (Accession ID: EFH89096) (E value: 0.023) was further aligned using T-Coffee (Notredame et al. 2000) and viewed with Jalview (Waterhouse et al. 2009).
Flow Cytometry and Cell Isolation
To investigate the effect of miRNA or bacteria on immune cells in vivo, mice were immunized with MOG and simultaneously orally administered with synthetic miRNA or bacteria for 7 consecutive days as indicated in results. On day 8 post immunization, cells were collected from the spleen and measured T lymphocytes following established approach (Rezende et al. 2015). Briefly, intracellular cytokine staining was performed by first stimulating cells for 4 h with PMA (Phorbol 12-myristate 13-acetate; 50 ng/ml; Sigma-Aldrich) and ionomycin (1 μM; Sigma-Aldrich) and a protein-transport inhibitor containing monensin (1 μg/ml GolgiStop; BD Biosciences) before detection by staining with antibodies. Surface markers were stained for 25 min at 4°C in Mg2+ and Ca2+ free HBSS with 2% FCS, 0.4% EDTA (0.5 M) and 2.5% HEPES (1 M) then were fixed in Cytoperm/Cytofix (eBioscience), permeabilized with Perm/Wash Buffer (eBiosciences). Flow-cytometric acquisition was performed on a Fortessa (BD Biosciences) by using DIVA software (BD Biosciences) and data were analyzed with FlowJo software versions 10.4.1 (TreeStar). Surface staining antibodies included: Alexa Fluor® 700 anti-CD3 (17A2; 1:100; Biolegend), BV605-anti-CD4 (RM4.5; 1:300; BD Biosciences). Intracellular staining antibodies used: FITC-anti-FoxP3 (FJK-16s; 1:100; eBioscience), BV421-anti-IFN-γ (XMG1.2; 1:300; Biolegend), PE-Cy7-IL-17A (eBio17B7; 1:100; eBioscience). In some experiment, to count the absolute cell numbers, CountBright™ Absolute Counting Beads (Ref. C36950, Molecular Probes) were added to the flow cytometry and acquired. Cell numbers were counted according to the manufacturer’s instruction. To stain for MOG35–55-specific CD4+Foxp3+ Tregs, we used the PE-anti-Vβ11 mAb (KT11; 1:200; Biolegend).
To investigate which intestinal cells expressed miR-30d during EAE-induction (Supplementary Figure 1), colonic tissue was collected 10 days post MOG/CFA or OVA/CFA immunization. Colonic epithelial cells and lamina propria cells were isolated following the established protocol(Moreira et al. 2019). Colonic homogenates were incubated with DTT as described(Moreira et al. 2019) and were separated into CD45− and CD45+ fractions using CD45 Microbeads (Order number: 130-052-301, Miltenyi Biotec). Epithelial cells from the CD45− fraction were further sorted out by staining with 7-AAD for dead cell exclusion and FITC-anti-CD3 (500A2; 1:100; Biolegend), APC-anti-CD326 (Ep-CAM) (G8.8; 1:100; Biolegend), APC-anti-CD324 (E-Cadherin) (DECMA-1; 1:100; Biolegend) and APC-anti-pan Cytokeratin (C-11; 1:100; Invitrogen). CD45+ fraction was further sorted for αβ+ T cells (7-AAD−, CD3+, TCRγδ−, TCRβ+) and γδ+ T cells (7-AAD−, CD3+, TCRβ−, TCRγδ+) by staining with 7-AAD for dead cell exclusion and FITC-anti-CD3 (500A2; 1:100; Biolegend), PE-anti-TCRγδ (GL3; 1:100; Biolegend) and Brilliant Violet 605-anti-TCR-β (H57–597; 1:100; Biolegend). CD45+ fraction was separated from the colonic lamina propria isolates using CD45 Microbeads and was further stained with 7-AAD and APC-conjugated epithelium dump channel (anti-CD326 (Ep-CAM) (G8.8; 1:100; Biolegend), anti-CD324 (E-Cadherin) (DECMA-1; 1:100; Biolegend), anti-pan Cytokeratin (C-11; 1:100; Invitrogen)), PerCP-conjugated dump channel (anti-NK1.1 (PK136; 1:100; Biolegend), anti-Ly-6G (1A8; 1:100; Biolegend), anti-B220 (RA3–6B2; 1:100; Biolegend), anti-CD317 (927; 1:100; Biolegend), anti-CD3 (145–2C11; 1:100; Biolegend)), FITC-anti-CD45 (30-F11;1:100; Biolegend), PE-anti-CX3CR1 (SA011F11; 1:100; Biolegend), BV605-anti-F4/80 (BM8; 1:100; Biolegend), BV605-anti-CD64 (X54–5/7.1; 1:100; Biolegend), PE/Cy7-anti-CD11c (N418; 1:100; Biolegend) and AF700-anti-I-A/I-E (MHCII) (M5/114.15.2; 1:100; Biolegend) to sort for macrophages (7-AAD− APC−PerCP− CD45+ F4/80+ CD64+ CX3CR1+) and dendritic cells (7-AAD− APC− PerCP− CD45+ F4/80− CD64− MHCII hi+ CD11c+).
To investigate the effect of A. muciniphila on Foxp3+ Treg induction (Figure 6E–G), CD11c+ dendritic cells (DCs) isolated from the mesenteric lymph nodes (MLNs) of naive mice were first enriched with UltraPure CD11c MicroBeads (order No. 130-108-338, Miltenyi Biotec), and then sorted by gating 7-AAD− PerCP− CD45+ F4/80− CD64− CD11c+ cells. Antibodies used for sorting were: PerCP-conjugated dump channel (anti-TER-119 (TER-119), anti-NK1.1(PK136), anti-CD19(6D5), anti-Ly-6G (1A8), anti-CD3ε (145–2C11), all at 1:300 dilutions; Biolegend), APC-anti-CD45 (30-F11; 1:300; Biolegend), FITC-anti-F4/F80 (BM8; 1:100; Biolegend), FITC-anti-CD64 (X54–5/7.1; 1:100; Biolegend) and PE-anti-CD11c (N418; 1:200; Biolegend). Naive CD4+ T cells were isolated from the spleen of Foxp3GFP+ mice using Naïve CD4+ T cell Isolation Kit (Order No. 130-104-453, Miltenyi Biotec).
In vitro Induction of Foxp3+ Treg with A. muciniphila
To investigate the effect of A. muciniphila on Foxp3+ Treg induction (Figure 6E–G), Foxp3+ Tregs were induced from naïve CD4+ T cells that were purified from the splenocytes of Foxp3GFP+ mice as described above in the presence of TGF-β1 (2 ng/ml, R&D Systems) and IL-2 (10 ng/ml, R&D Systems) for 3 days. In some experiments (Figure 6E), 1 μl/well (200 μl) of the inactivated OD600=1 A. muciniphila or E. coli were added to directly stimulate naïve CD4 T cells. In some experiments (Figure 6F–G), 1 μl/well of the inactivated OD600=1 A. muciniphila or E. coli were added to DCs isolated from MLN of naïve mice, described above, for 24 hours. Stimulated DCs were harvested for RNA quantification (Figure 6G), or co-cultured with naïve CD4 T cells to expand Tregs for additional 3 days by adding naïve CD4+ T from Foxp3GFP+ mice to the stimulated DCs, at a DC: naïve CD4+ T cell ratio of 1:10 (Figure 6F).
Quantification of Cellular miRNA and Cytokine
To determine miR-30d changes in different cells (epithelial cells, macrophages, dendritic cells, TCRαβ+IELs, TCRγδ+IELs) in the gut of MOG/CFA- or OVA/CFA- immunized mice (Supplementary Figure 1), and to determine the expression of Tgfb, Il6 and Il1b mRNAs in A. muciniphila-treated DCs (Figure 6G), total RNA (including miRNA) was extracted from sorted cells or cultured DCs using mirVana™ miRNA isolation kit (catalog number: AM1560, Ambion®) following manufacturer’s protocol. qPCR was performed to detect miR-30d using TaqMan® MiRNA Reverse Transcription (Applied Biosystems) and Taqman Universal PCR Master Mix according to the manufacturer’s protocol. The input of total RNA per sample was 5 ng. The TaqMan® MiRNA Assay IDs (Applied Biosystems) were: snoRNA135 (inner control, assay ID: 001230), the hsa-miR-30d-5p (assay ID: 000420). The TaqMan™Gene Expression Assay IDs (Applied Biosystems) were: Gapdh (Assay ID: Mm99999915_g1, reference gene), Tgfb1 (Assay ID: Mm01178820_m1), Il6 (Assay ID: Mm00446190_m1), Il1beta (Assay ID: Mm00434228_ml).
In Situ Hybridization Detection of miR-30d
A. muciniphila was cultured in 1 ml medium of BHI w/o dextrose plus 0.2% mucin in the presence of 5 μM synthetic miR-30d mimics or scramble for 18 hours to an exponential phase. Bacterial cells were spin down at 12,000 rpm and washed twice with ice cold PBS. The cells were then fixed in 4% PFA/0.25% Glutaraldehyde. 100 nm cryosections were proceeded on nickel grids and carried out for in situ hybridization using a 5’-DIG and 3’-DIG dual labeled probe for miR-30d (Cat#YD00613716-BEG, Product#339112, Qiagen) and 10 nm immuno gold-conjugated anti-Digoxigenin antibody (Cat#25399, Electron Microscopy Sciences) following the manufacturer’s protocol. Sections on grids were imaged using Tecnai G2 Spirit BioTWIN Transmission Electron Microscope.
QUANTIFICATION AND STATISTICAL ANALYSIS
All graphs, calculations, and statistical analyses were performed using the GraphPad Prism software version 8.0 for Mac (GraphPad Software, San Diego, CA, USA). Datasets were tested for normality. Comparisons between two groups following a normal distribution were performed using a Student’s t-test, and comparisons of three or more groups following a normal distribution were performed using one-way ANOVA followed by Dunnett’s test or Tukey’s test as specified in figures. For datasets of non-normal distributions, the Mann Whitney test and Kruskal-Wallis test were used for comparisons between two groups and three or more groups, respectively. To compare individual miRNA changes during EAE and MS using the sequencing data, a two-way ANOVA two-stage step-up method of Benjamini, Krieger and Yekutieli was used as indicated in the figures. EAE clinical scores were analyzed over time with the non-parametric Friedman test for repeated measurements or Kruskal-Wallis test followed by post-hoc test as specified in figures (Baker et al. 2014; Moore et al. 2014). Exact statistical instruments, sample sizes, and P values are indicated in each figure. A two-sided P-value of ≤0.05 was considered as significant. Except for specified in the context, results are expressed as mean ± SEM. We did not use statistical methods to determine sample size; we used sample sizes that were similar to those in our previous publications and those of others (Mayo et al. 2014; Ponomarev et al. 2011; Cignarella et al. 2018; Rothhammer et al. 2018; Muramatsu et al. 2011).
DATA AND CODE AVAILABILITY
Small RNA sequencing data and 16S rDNA sequencing data were deposited in Sequence Read Archive (SRA) (https://www.ncbi.nlm.nih.gov/sra) and are available under the following BioProject IDs: PRJNA563061 (small RNA sequencing of fecal RNA samples from MOG-induced EAE mice), PRJNA563097 (small RNA sequencing of fecal RNA samples from multiple sclerosis patients), PRJNA563122 (V4 16S rDNA sequencing of MOG-induced EAE mice), PRJNA576265 (V4 16S rDNA sequencing of oral miR-30d treated mice).
Supplementary Material
Supplementary Table 1. Gut Microbiome during EAE, 16S rDNA Seq. Related to Figure 1C.
Supplementary Table 2. Fecal miRNA in OVA- and MOG-immunized Mice, small RNA-Seq. Related to Figure 3A.
Supplementary Table 3. Fecal miRNA in MS Patients and Healthy Subjects, Small RNA-Seq. Related to Figure 3C.
Supplementary Table 4. Gut Microbiome Modulated by Oral miR-30d Administration, 16S rDNA Seq. Related to Figure 5F–H.
Supplementary Table 5. Oligonucleotide sequences used in the study. Related to STAR Methods.
Highlights.
Fecal transfer from the MS EAE model at peak disease prevents disease in susceptible mice
miR-30d and Akkermansia are increased in the feces of peak EAE and untreated MS patients
miR-30d upregulates the expression of β-galactosidase AMUC_RS06985 in Akkermansia
miR-30d expands Akkermansia and regulatory T cells to ameliorate EAE
ACKNOWLEDGEMENTS
We received technical assistance from the Biopolymers Facility at Harvard Medical School for sequencing. We thank Brian Lawney and Yaoyu E. Wang from Center for Cancer Computational Biology (Dana-Farber Cancer Institute) for small RNAseq data analysis, the Rodent Histopathology Core at Dana-Farber/Harvard Cancer Center for histopathology, Electron Microscopy Facility at Harvard Medical School for electron microscopy, Brian C. Healy for statistic discussion, Francisco J. Quintana and Vijay K. Kuchroo for helpful discussions. This work was supported by National Multiple Sclerosis Society research grant RG-1707–28516 (H.L.W. and S.L.) and National Institutes of Health grant R01NS087226 (H.L.W.)
Footnotes
Publisher's Disclaimer: This is a PDF file of an unedited manuscript that has been accepted for publication. As a service to our customers we are providing this early version of the manuscript. The manuscript will undergo copyediting, typesetting, and review of the resulting proof before it is published in its final form. Please note that during the production process errors may be discovered which could affect the content, and all legal disclaimers that apply to the journal pertain.
DECLARATION OF INTERESTS
S.L. and H.L.W. are inventors on a patent application dealing with oral administration of microRNA in modulating microbiome and in the treatment of autoimmune disorders.
REFERENCES:
- An D et al. , 2014. Sphingolipids from a Symbiotic Microbe Regulate Homeostasis of Host Intestinal Natural Killer T Cells. Cell, 156(1–2), pp.123–133. [DOI] [PMC free article] [PubMed] [Google Scholar]
- Atarashi K et al. , 2011. Induction of colonic regulatory T cells by indigenous Clostridium species. Science (New York, NY), 331(6015), pp.337–341. [DOI] [PMC free article] [PubMed] [Google Scholar]
- Baecher-Allan C, Kaskow BJ & Weiner HL, 2018. Multiple Sclerosis: Mechanisms and Immunotherapy. Neuron, 97(4), pp.742–768. [DOI] [PubMed] [Google Scholar]
- Baker D et al. , 2014. Two years later: journals are not yet enforcing the ARRIVE guidelines on reporting standards for pre-clinical animal studies. PLoS biology, 12(1), p.e1001756. [DOI] [PMC free article] [PubMed] [Google Scholar]
- Barcena C et al. , 2019. Healthspan and lifespan extension by fecal microbiota transplantation into progeroid mice. Nature medicine, 25(8), pp.1234–1242. [DOI] [PubMed] [Google Scholar]
- Belbasis L et al. , 2015. Environmental risk factors and multiple sclerosis: an umbrella review of systematic reviews and meta-analyses. Lancet Neurology, 14(3), pp.263–273. [DOI] [PubMed] [Google Scholar]
- Belkaid Y & Hand TW, 2014. Role of the Microbiota in Immunity and Inflammation. Cell, 157(1), pp.121–141. [DOI] [PMC free article] [PubMed] [Google Scholar]
- Benjamin JL et al. , 2013. Intestinal Epithelial Autophagy Is Essential for Host Defense against Invasive Bacteria. Cell Host Microbe, 13(6), pp.723–734. [DOI] [PMC free article] [PubMed] [Google Scholar]
- Berer K et al. , 2011. Commensal microbiota and myelin autoantigen cooperate to trigger autoimmune demyelination. Nature, 479(7374), pp.538–541. [DOI] [PubMed] [Google Scholar]
- Berer K et al. , 2017. Gut microbiota from multiple sclerosis patients enables spontaneous autoimmune encephalomyelitis in mice. Proceedings of the National Academy of Sciences, 114(40), pp.10719–10724. [DOI] [PMC free article] [PubMed] [Google Scholar]
- Bettelli E, Baeten D, et al. , 2006. Myelin oligodendrocyte glycoprotein-specific T and B cells cooperate to induce a Devic-like disease in mice. The Journal of clinical investigation, 116(9), pp.2393–2402. [DOI] [PMC free article] [PubMed] [Google Scholar]
- Bettelli E, Carrier Y, et al. , 2006. Reciprocal developmental pathways for the generation of pathogenic effector TH17 and regulatory T cells. Nature, 441(7090), pp.235–238. [DOI] [PubMed] [Google Scholar]
- Blacher E et al. , 2019. Potential roles of gut microbiome and metabolites in modulating ALS in mice. Nature, 572(7770), pp.474–480. [DOI] [PubMed] [Google Scholar]
- Budin I, Bruckner RJ & Szostak JW, 2009. Formation of protocell-like vesicles in a thermal diffusion column. Journal of the American Chemical Society, 131(28), pp.9628–9629. [DOI] [PMC free article] [PubMed] [Google Scholar]
- Caporaso JG et al. , 2012. Ultra-high-throughput microbial community analysis on the Illumina HiSeq and MiSeq platforms. The ISME Journal, 6(8), pp.1621–1624. [DOI] [PMC free article] [PubMed] [Google Scholar]
- Caporaso JG, Kuczynski J, Stombaugh J, Bittinger K, Bushman FD, Costello EK, Fierer N, Pena AG, Goodrich JK, Gordon JI, Huttley GA, Kelley ST, Knights D, Koenig JE, Ley RE, Lozupone CA, McDonald D, Muegge BD, Pirrung M, Reeder J, Sevinsky JR, Turnbaugh PJ, Walters WA, Widmann J, Yatsunenko T, Zaneveld J & Knight R, 2010a. QIIME allows analysis of high-throughput community sequencing data. Nature methods, 7(5), pp.335–336. [DOI] [PMC free article] [PubMed] [Google Scholar]
- Caporaso JG, Kuczynski J, Stombaugh J, Bittinger K, Bushman FD, Costello EK, Fierer N, Pena AG, Goodrich JK, Gordon JI, Huttley GA, Kelley ST, Knights D, Koenig JE, Ley RE, Lozupone CA, McDonald D, Muegge BD, Pirrung M, Reeder J, Sevinsky JR, Turnbaugh PJ, Walters WA, Widmann J, Yatsunenko T, Zaneveld J & Knight R, 2010b. QIIME allows analysis of high-throughput community sequencing data. Nat Meth, 7(5), pp.335–336. [DOI] [PMC free article] [PubMed] [Google Scholar]
- Cekanaviciute E et al. , 2017. Gut bacteria from multiple sclerosis patients modulate human T cells and exacerbate symptoms in mouse models. Proceedings of the National Academy of Sciences, 114(40), pp.10713–10718. [DOI] [PMC free article] [PubMed] [Google Scholar]
- Chen H et al. , 2019. Gut Microbiota Interventions With Clostridium butyricum and Norfloxacin Modulate Immune Response in Experimental Autoimmune Encephalomyelitis Mice. Frontiers in immunology, 10, p.1662. [DOI] [PMC free article] [PubMed] [Google Scholar]
- Chen IA & Walde P, 2010. From self-assembled vesicles to protocells. Cold Spring Harbor Perspectives in Biology, 2(7), p.a002170. [DOI] [PMC free article] [PubMed] [Google Scholar]
- Chen IA, Salehi-Ashtiani K & Szostak JW, 2005. RNA catalysis in model protocell vesicles. Journal of the American Chemical Society, 127(38), pp.13213–13219. [DOI] [PMC free article] [PubMed] [Google Scholar]
- Chen J et al. , 2016. Multiple sclerosis patients have a distinct gut microbiota compared to healthy controls. Scientific reports, 6, p.28484. [DOI] [PMC free article] [PubMed] [Google Scholar]
- Cignarella F et al. , 2018. Intermittent Fasting Confers Protection in CNS Autoimmunity by Altering the Gut Microbiota. Cell metabolism, 27(6), pp.1222–1235.e6. [DOI] [PMC free article] [PubMed] [Google Scholar]
- Coombes JL et al. , 2007. A functionally specialized population of mucosal CD103+ DCs induces Foxp3+ regulatory T cells via a TGF-beta and retinoic acid-dependent mechanism. The Journal of Experimental Medicine, 204(8), pp.1757–1764. [DOI] [PMC free article] [PubMed] [Google Scholar]
- Cording S et al. , 2014. The intestinal micro-environment imprints stromal cells to promote efficient Treg induction in gut-draining lymph nodes. Mucosal Immunol, 7(2), pp.359–368. [DOI] [PubMed] [Google Scholar]
- Creemers EE, Tijsen AJ & Pinto YM, 2012. Circulating microRNAs: novel biomarkers and extracellular communicators in cardiovascular disease? Circulation research, 110(3), pp.483–495. [DOI] [PubMed] [Google Scholar]
- Derrien M et al. , 2004. Akkermansia muciniphila gen. nov., sp. nov., a human intestinal mucin-degrading bacterium. International journal of systematic and evolutionary microbiology, 54(Pt 5), pp.1469–1476. [DOI] [PubMed] [Google Scholar]
- Dombrowski Y et al. , 2017. Regulatory T cells promote myelin regeneration in the central nervous system. Nature Neuroscience, 20(5), pp.674–680. [DOI] [PMC free article] [PubMed] [Google Scholar]
- Dunning Hotopp JC, 2011. Horizontal gene transfer between bacteria and animals. Trends in genetics : TIG, 27(4), pp.157–163. [DOI] [PMC free article] [PubMed] [Google Scholar]
- Dyment DA, Ebers GC & Sadovnick AD, 2004. Genetics of multiple sclerosis. The Lancet Neurology, 3(2), pp.104–110. [DOI] [PubMed] [Google Scholar]
- Everard A et al. , 2013. Cross-talk between Akkermansia muciniphila and intestinal epithelium controls diet-induced obesity. Proceedings of the National Academy of Sciences, 110(22), pp.9066–9071. [DOI] [PMC free article] [PubMed] [Google Scholar]
- Frisullo G et al. , 2008. IL17 and IFNgamma production by peripheral blood mononuclear cells from clinically isolated syndrome to secondary progressive multiple sclerosis. Cytokine, 44(1), pp.22–25. [DOI] [PubMed] [Google Scholar]
- Fung TC, Olson CA & Hsiao EY, 2017. Interactions between the microbiota, immune and nervous systems in health and disease. Nature Neuroscience, 20(2), pp.145–155. [DOI] [PMC free article] [PubMed] [Google Scholar]
- Gianfrancesco MA et al. , 2017. Genetic risk factors for pediatric-onset multiple sclerosis. Multiple sclerosis (Houndmills, Basingstoke, England), p.1352458517733551. [DOI] [PMC free article] [PubMed] [Google Scholar]
- Gudlur S et al. , 2012. Peptide nanovesicles formed by the self-assembly of branched amphiphilic peptides. PLoS ONE, 7(9), p.e45374. [DOI] [PMC free article] [PubMed] [Google Scholar]
- Hansen CHF et al. , 2012. Early life treatment with vancomycin propagates Akkermansia muciniphila and reduces diabetes incidence in the NOD mouse. Diabetologia, 55(8), pp.2285–2294. [DOI] [PubMed] [Google Scholar]
- Honda K & Littman DR, 2016. The microbiota in adaptive immune homeostasis and disease. Nature, 535(7610), pp.75–84. [DOI] [PubMed] [Google Scholar]
- Hooper LV, Littman DR & Macpherson AJ, 2012. Interactions between the microbiota and the immune system. Science (New York, NY), 336(6086), pp.1268–1273. [DOI] [PMC free article] [PubMed] [Google Scholar]
- Hsiao EY et al. , 2013. Microbiota modulate behavioral and physiological abnormalities associated with neurodevelopmental disorders. Cell, 155(7), pp.1451–1463. [DOI] [PMC free article] [PubMed] [Google Scholar]
- Ianiro G et al. , 2014. Fecal microbiota transplantation in inflammatory bowel disease: beyond the excitement. Medicine (Baltimore), 93(19), pp.e97–e97. [DOI] [PMC free article] [PubMed] [Google Scholar]
- Ivanov II et al. , 2009. Induction of Intestinal Th17 Cells by Segmented Filamentous Bacteria. Cell, 139(3), pp.14–14. [DOI] [PMC free article] [PubMed] [Google Scholar]
- Jangi S et al. , 2016. Alterations of the human gut microbiome in multiple sclerosis. Nature communications, 7(1), p.12015. [DOI] [PMC free article] [PubMed] [Google Scholar]
- Johnston DGW et al. , 2018. Loss of MicroRNA-21 Influences the Gut Microbiota, Causing Reduced Susceptibility in a Murine Model of Colitis. Journal of Crohn’s & colitis, 12(7), pp.835–848. [DOI] [PubMed] [Google Scholar]
- Jung M et al. , 2010. Robust microRNA stability in degraded RNA preparations from human tissue and cell samples. Clinical chemistry, 56(6), pp.998–1006. [DOI] [PubMed] [Google Scholar]
- Kiernan JA, 2007. Indigogenic substrates for detection and localization of enzymes. Biotechnic & histochemistry : official publication of the Biological Stain Commission, 82(2), pp.73–103. [DOI] [PubMed] [Google Scholar]
- Kim WJ et al. , 2019. Commensal Neisseria Kill Neisseria gonorrhoeae through a DNA-Dependent Mechanism. Cell Host \& Microbe. [DOI] [PMC free article] [PubMed] [Google Scholar]
- Kirschbaum M et al. , 2015. Horizontal RNA transfer mediates platelet-induced hepatocyte proliferation. Blood, 126(6), pp.798–806. [DOI] [PubMed] [Google Scholar]
- Kopylova E, Noé L & Touzet H, 2012. SortMeRNA: fast and accurate filtering of ribosomal RNAs in metatranscriptomic data. Bioinformatics (Oxford, England), 28(24), pp.3211–3217. [DOI] [PubMed] [Google Scholar]
- Koutrolos M et al. , 2014. Treg cells mediate recovery from EAE by controlling effector T cell proliferation and motility in the CNS. Acta neuropathologica communications, 2(1), p.163. [DOI] [PMC free article] [PubMed] [Google Scholar]
- Krüger J & Rehmsmeier M, 2006. RNAhybrid: microRNA target prediction easy, fast and flexible. Nucleic Acids Research, 34(Web Server issue), pp.W451–4. [DOI] [PMC free article] [PubMed] [Google Scholar]
- Lee Y et al. , 2012. Induction and molecular signature of pathogenic TH17 cells. Nature immunology, 13(10), pp.991–999. [DOI] [PMC free article] [PubMed] [Google Scholar]
- Link A et al. , 2012. Feasibility of fecal microRNAs as novel biomarkers for pancreatic cancer. PLoS ONE, 7(8), p.e42933. [DOI] [PMC free article] [PubMed] [Google Scholar]
- Link A et al. , 2010. Fecal MicroRNAs as novel biomarkers for colon cancer screening. Cancer epidemiology, biomarkers & prevention : a publication of the American Association for Cancer Research, cosponsored by the American Society of Preventive Oncology, 19(7), pp.1766–1774. [DOI] [PMC free article] [PubMed] [Google Scholar]
- Liu H et al. , 2010. Widespread horizontal gene transfer from double-stranded RNA viruses to eukaryotic nuclear genomes. Journal of virology, 84(22), pp.11876–11887. [DOI] [PMC free article] [PubMed] [Google Scholar]
- Liu S et al. , 2016. The Host Shapes the Gut Microbiota via Fecal MicroRNA. Cell Host \& Microbe, 19(1), pp.32–43. [DOI] [PMC free article] [PubMed] [Google Scholar]
- Love MI, Huber W & Anders S, 2014. Moderated estimation of fold change and dispersion for RNA-seq data with DESeq2. Genome Biology, 15(12), p.550. [DOI] [PMC free article] [PubMed] [Google Scholar]
- Lu L-F & Rudensky A, 2009. Molecular orchestration of differentiation and function of regulatory T cells. Genes \& Development, 23(11), pp.1270–1282. [DOI] [PMC free article] [PubMed] [Google Scholar]
- Mansy SS & Szostak JW, 2008. Thermostability of model protocell membranes. Proceedings of the National Academy of Sciences, 105(36), pp.13351–13355. [DOI] [PMC free article] [PubMed] [Google Scholar]
- Mayo L et al. , 2014. Regulation of astrocyte activation by glycolipids drives chronic CNS inflammation. Nature medicine, 20(10), pp.1147–1156. [DOI] [PMC free article] [PubMed] [Google Scholar]
- Mazmanian SK et al. , 2005. An immunomodulatory molecule of symbiotic bacteria directs maturation of the host immune system. Cell, 122(1), pp.107–118. [DOI] [PubMed] [Google Scholar]
- Mohan M et al. , 2016. Dietary Gluten-Induced Gut Dysbiosis Is Accompanied by Selective Upregulation of microRNAs with Intestinal Tight Junction and Bacteria-Binding Motifs in Rhesus Macaque Model of Celiac Disease. Nutrients, 8(11). [DOI] [PMC free article] [PubMed] [Google Scholar]
- Moore SM et al. , 2014. Multiple functional therapeutic effects of the estrogen receptor β agonist indazole-Cl in a mouse model of multiple sclerosis. Proceedings of the National Academy of Sciences, 111(50), pp.18061–18066. [DOI] [PMC free article] [PubMed] [Google Scholar]
- Moreira TG et al. , 2019. CLA-supplemented diet accelerates experimental colorectal cancer by inducing TGF-β-producing macrophages and T cells. Mucosal Immunol, 12(1), pp.188–199. [DOI] [PubMed] [Google Scholar]
- Muramatsu R et al. , 2011. RGMa modulates T cell responses and is involved in autoimmune encephalomyelitis. Nature medicine, 17(4), pp.488–494. [DOI] [PubMed] [Google Scholar]
- Nadkarni MA et al. , 2002. Determination of bacterial load by real-time PCR using a broad-range (universal) probe and primers set. Microbiology (Reading, England), 148(Pt 1), pp.257–266. [DOI] [PubMed] [Google Scholar]
- Nath N et al. , 2009. Metformin attenuated the autoimmune disease of the central nervous system in animal models of multiple sclerosis. Journal of immunology (Baltimore, Md : 1950), 182(12), pp.8005–8014. [DOI] [PMC free article] [PubMed] [Google Scholar]
- Norrander J, Kempe T & Messing J, 1983. Construction of improved M13 vectors using oligodeoxynucleotide-directed mutagenesis. Gene, 26(1), pp.101–106. [DOI] [PubMed] [Google Scholar]
- Notredame C, Higgins DG & Heringa J, 2000. T-Coffee: A novel method for fast and accurate multiple sequence alignment. Journal of molecular biology, 302(1), pp.205–217. [DOI] [PubMed] [Google Scholar]
- O’Connor RA, Malpass KH & Anderton SM, 2007. The inflamed central nervous system drives the activation and rapid proliferation of Foxp3+ regulatory T cells. The Journal of Immunology, 179(2), pp.958–966. [DOI] [PubMed] [Google Scholar]
- Ochman H, Lawrence JG & Groisman EA, 2000. Lateral gene transfer and the nature of bacterial innovation. Nature, 405(6784), pp.299–304. [DOI] [PubMed] [Google Scholar]
- Ochoa-Repáraz J et al. , 2009. Role of gut commensal microflora in the development of experimental autoimmune encephalomyelitis. Journal of immunology (Baltimore, Md : 1950), 183(10), pp.6041–6050. [DOI] [PubMed] [Google Scholar]
- Olson CA et al. , 2018. The Gut Microbiota Mediates the Anti-Seizure Effects of the Ketogenic Diet. Cell, 173(7), pp.1728–1741.e13. [DOI] [PMC free article] [PubMed] [Google Scholar]
- Ott SJ et al. , 2004. Reduction in diversity of the colonic mucosa associated bacterial microflora in patients with active inflammatory bowel disease. Gut, 53(5), pp.685–693. [DOI] [PMC free article] [PubMed] [Google Scholar]
- Ottman N et al. , 2017. Pili-like proteins of Akkermansia muciniphila modulate host immune responses and gut barrier function. PLoS ONE, 12(3), p.e0173004. [DOI] [PMC free article] [PubMed] [Google Scholar]
- Oukka M, 2007. Interplay between pathogenic Th17 and regulatory T cells. Annals of the rheumatic diseases, 66 Suppl 3(suppl 3), pp.iii87–90. [DOI] [PMC free article] [PubMed] [Google Scholar]
- Pezoldt J et al. , 2018. Neonatally imprinted stromal cell subsets induce tolerogenic dendritic cells in mesenteric lymph nodes. Nature communications, 9(1), p.3903. [DOI] [PMC free article] [PubMed] [Google Scholar]
- Plovier H et al. , 2017. A purified membrane protein from Akkermansia muciniphila or the pasteurized bacterium improves metabolism in obese and diabetic mice. Nature medicine, 23(1), pp.107–113. [DOI] [PubMed] [Google Scholar]
- Ponomarev ED et al. , 2011. MicroRNA-124 promotes microglia quiescence and suppresses EAE by deactivating macrophages via the C/EBP-α-PU.1 pathway. Nature medicine, 17(1), pp.64–70. [DOI] [PMC free article] [PubMed] [Google Scholar]
- Qin J et al. , 2012. A metagenome-wide association study of gut microbiota in type 2 diabetes. Nature, 490(7418), pp.55–60. [DOI] [PubMed] [Google Scholar]
- Ransohoff RM, Hafler DA & Lucchinetti CF, 2015. Multiple sclerosis-a quiet revolution. Nature reviews. Neurology, 11(3), pp.134–142. [DOI] [PMC free article] [PubMed] [Google Scholar]
- Rehmsmeier M et al. , 2004. Fast and effective prediction of microRNA/target duplexes. RNA (New York, N.Y.), 10(10), pp.1507–1517. [DOI] [PMC free article] [PubMed] [Google Scholar]
- Reuter E et al. , 2015. Cross-recognition of a myelin peptide by CD8+ T cells in the CNS is not sufficient to promote neuronal damage. The Journal of neuroscience : the official journal of the Society for Neuroscience, 35(12), pp.4837–4850. [DOI] [PMC free article] [PubMed] [Google Scholar]
- Rezende RM et al. , 2015. Identification and characterization of latency-associated peptide-expressing γδ T cells. Nature communications, 6, p.8726. [DOI] [PMC free article] [PubMed] [Google Scholar]
- Robinson AP et al. , 2014. The experimental autoimmune encephalomyelitis (EAE) model of MS: utility for understanding disease pathophysiology and treatment. Handbook of clinical neurology, 122, pp.173–189. [DOI] [PMC free article] [PubMed] [Google Scholar]
- Rojas OL et al. , 2019. Recirculating Intestinal IgA-Producing Cells Regulate Neuroinflammation via IL-10. Cell, 176(3), pp.610–624.e18. [DOI] [PMC free article] [PubMed] [Google Scholar]
- Rothhammer V et al. , 2018. Microglial control of astrocytes in response to microbial metabolites. Nature, 557(7707), pp.724–728. [DOI] [PMC free article] [PubMed] [Google Scholar]
- Round JL et al. , 2011. The Toll-like receptor 2 pathway establishes colonization by a commensal of the human microbiota. Science (New York, NY), 332(6032), pp.974–977. [DOI] [PMC free article] [PubMed] [Google Scholar]
- Sawcer SS et al. , 2011. Genetic risk and a primary role for cell-mediated immune mechanisms in multiple sclerosis. Nature, 476(7359), pp.214–219. [DOI] [PMC free article] [PubMed] [Google Scholar]
- Schmidt TSB, Raes J & Bork P, 2018. The Human Gut Microbiome: From Association to Modulation. Cell, 172(6), pp.1198–1215. [DOI] [PubMed] [Google Scholar]
- Schmittgen TD & Livak KJ, 2008. Analyzing real-time PCR data by the comparative C(T) method. Nature protocols, 3(6), pp.1101–1108. [DOI] [PubMed] [Google Scholar]
- Schönauen K et al. , 2018. Circulating and Fecal microRNAs as Biomarkers for Inflammatory Bowel Diseases. Inflammatory Bowel Diseases, 142, p.46. [DOI] [PubMed] [Google Scholar]
- Sefik E et al. , 2015. Individual intestinal symbionts induce a distinct population of RORγ⁺ regulatory T cells. Science (New York, NY), 349(6251), pp.993–997. [DOI] [PMC free article] [PubMed] [Google Scholar]
- Shin N-R et al. , 2014. An increase in the Akkermansia spp. population induced by metformin treatment improves glucose homeostasis in diet-induced obese mice. Gut, 63(5), pp.727–735. [DOI] [PubMed] [Google Scholar]
- Stadelmann C, Wegner C & Brück W, 2011. Inflammation, demyelination, and degeneration - recent insights from MS pathology. Biochimica et biophysica acta, 1812(2), pp.275–282. [DOI] [PubMed] [Google Scholar]
- Subramanian SL et al. , 2015. Integration of extracellular RNA profiling data using metadata, biomedical ontologies and Linked Data technologies. Journal of extracellular vesicles, 4(1), p.27497. [DOI] [PMC free article] [PubMed] [Google Scholar]
- Sutton C et al. , 2006. A crucial role for interleukin (IL)-1 in the induction of IL-17–producing T cells that mediate autoimmune encephalomyelitis. The Journal of Experimental Medicine, 203(7), pp.1685–1691. [DOI] [PMC free article] [PubMed] [Google Scholar]
- Takahashi H et al. , 2011. Role of indigenous lactobacilli in gastrin-mediated acid production in the mouse stomach. Applied and Environmental Microbiology, 77(19), pp.6964–6971. [DOI] [PMC free article] [PubMed] [Google Scholar]
- Tankou SK et al. , 2018. A probiotic modulates the microbiome and immunity in multiple sclerosis. Annals of Neurology, 83(6), pp.1147–1161. [DOI] [PMC free article] [PubMed] [Google Scholar]
- Teng Y et al. , 2018. Plant-Derived Exosomal MicroRNAs Shape the Gut Microbiota. Cell Host \& Microbe, 24(5), pp.637–652.e8. [DOI] [PMC free article] [PubMed] [Google Scholar]
- Tremaroli V & Bäckhed F, 2012. Functional interactions between the gut microbiota and host metabolism. Nature, 489(7415), pp.242–249. [DOI] [PubMed] [Google Scholar]
- Tremlett H et al. , 2016. Gut microbiota in early pediatric multiple sclerosis: a case-control study. European journal of neurology, 23(8), pp.1308–1321. [DOI] [PMC free article] [PubMed] [Google Scholar]
- Turnbaugh PJ et al. , 2008. A core gut microbiome in obese and lean twins. Nature, 457(7228), pp.480–484. [DOI] [PMC free article] [PubMed] [Google Scholar]
- van Nood E et al. , 2013. Duodenal infusion of donor feces for recurrent Clostridium difficile. The New England journal of medicine, 368(5), pp.407–415. [DOI] [PubMed] [Google Scholar]
- Viennois E et al. , 2019. Host-derived fecal microRNAs can indicate gut microbiota healthiness and ability to induce inflammation. Theranostics, 9(15), pp.4542–4557. [DOI] [PMC free article] [PubMed] [Google Scholar]
- Waterhouse AM et al. , 2009. Jalview Version 2--a multiple sequence alignment editor and analysis workbench. Bioinformatics (Oxford, England), 25(9), pp.1189–1191. [DOI] [PMC free article] [PubMed] [Google Scholar]
- Wei Z et al. , 2017. Coding and noncoding landscape of extracellular RNA released by human glioma stem cells. Nature communications, 8(1), pp.1145–15. [DOI] [PMC free article] [PubMed] [Google Scholar]
- Wu H et al. , 2017. Metformin alters the gut microbiome of individuals with treatment-naive type 2 diabetes, contributing to the therapeutic effects of the drug. Nature medicine, 23(7), pp.850–858. [DOI] [PubMed] [Google Scholar]
- Yissachar N et al. , 2017. An Intestinal Organ Culture System Uncovers a Role for the Nervous System in Microbe-Immune Crosstalk. Cell, 168(6), pp.1135–1148.e12. [DOI] [PMC free article] [PubMed] [Google Scholar]
Associated Data
This section collects any data citations, data availability statements, or supplementary materials included in this article.
Supplementary Materials
Supplementary Table 1. Gut Microbiome during EAE, 16S rDNA Seq. Related to Figure 1C.
Supplementary Table 2. Fecal miRNA in OVA- and MOG-immunized Mice, small RNA-Seq. Related to Figure 3A.
Supplementary Table 3. Fecal miRNA in MS Patients and Healthy Subjects, Small RNA-Seq. Related to Figure 3C.
Supplementary Table 4. Gut Microbiome Modulated by Oral miR-30d Administration, 16S rDNA Seq. Related to Figure 5F–H.
Supplementary Table 5. Oligonucleotide sequences used in the study. Related to STAR Methods.
Data Availability Statement
Small RNA sequencing data and 16S rDNA sequencing data were deposited in Sequence Read Archive (SRA) (https://www.ncbi.nlm.nih.gov/sra) and are available under the following BioProject IDs: PRJNA563061 (small RNA sequencing of fecal RNA samples from MOG-induced EAE mice), PRJNA563097 (small RNA sequencing of fecal RNA samples from multiple sclerosis patients), PRJNA563122 (V4 16S rDNA sequencing of MOG-induced EAE mice), PRJNA576265 (V4 16S rDNA sequencing of oral miR-30d treated mice).