Abstract
Bile acids are abundant in the mammalian gut where they undergo bacteria-mediated transformation, generating a large pool of bioactive molecules. Although bile acids are known to affect host metabolism, cancer progression and innate immunity, it is unknown whether they affect adaptive immune cells such as T helper cells expressing IL-17a (Th17 cells) and regulatory T cells (Tregs). By screening a library of bile acid metabolites, we identified two distinct derivatives of lithocholic acid (LCA), 3-oxoLCA and isoalloLCA, as T cell regulators. 3-oxoLCA inhibited Th17 cell differentiation by directly binding to its key transcription factor RORγt (retinoid-related orphan receptor γt) and isoalloLCA enhanced Treg differentiation through the production of mitochondrial reactive oxygen species (mitoROS), leading to increased FoxP3 expression. IsoalloLCA-mediated Treg enhancement required an intronic FoxP3 enhancer, the conserved noncoding sequence 3 (CNS3), a distinct mode of action from previously-identified Treg enhancing metabolites that require CNS1. Administration of 3-oxoLCA and isoalloLCA to mice reduced Th17 and increased Treg cell differentiation in the intestinal lamina propria. Our data suggest novel mechanisms by which bile acid metabolites control host immune responses by directly modulating the Th17 and Treg balance.
Bile acids are cholesterol-derived natural surfactants, produced in the liver and secreted into the duodenum. They are critical for lipid digestion, antibacterial defense and glucose metabolism1. Although 95% of bile acids are re-absorbed through the terminal ileum of the small intestine and recirculated to the liver, bacteria transform hundreds of milligrams of bile acids to secondary bile acids with unique chemical structures2,3. In the healthy human gut, the concentrations of secondary bile acids are in the hundreds of micromolar range2,4. While some bile acids disrupt cellular membranes due to their hydrophobic nature5, other bile acids protect the gut epithelium6 and confer resistance to pathogens such as Clostridium difficile7. Bile acids also influence gut-associated inflammation, suggesting their potential to regulate gut mucosal immune cells8,9. The immune-modulatory effects of bile acids have mostly been studied in the context of innate immunity10–12. A recent study reported the cytotoxic effects of bile acids on gut-residing T cells13; however, whether they modulate T cell function directly has not been thoroughly examined. Since the identification of digoxin, a plant-derived molecule harboring a sterol-like core, as the first Th17 cell inhibitor that binds to RORγt and inhibits its activity14, other structurally similar cholesterol derivatives have been identified as RORγt modulators15–17. Because bile acids belong to a family of cholesterol metabolites and exist in the gut where many Th17 cells reside18, we reasoned that bile acids control Th17 cell function by modulating RORγt activity.
Screen for T cell modulatory bile acids
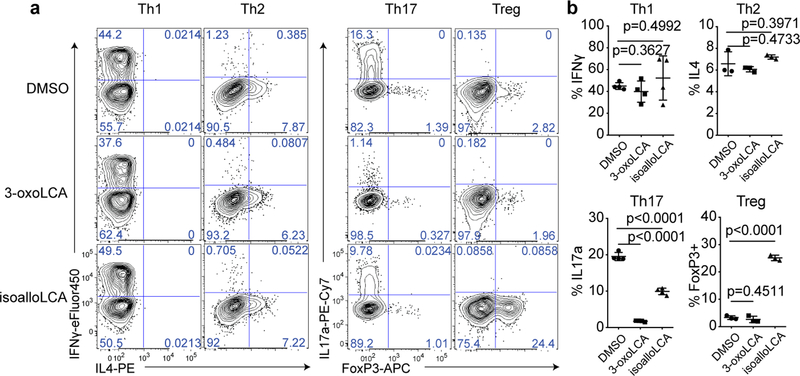
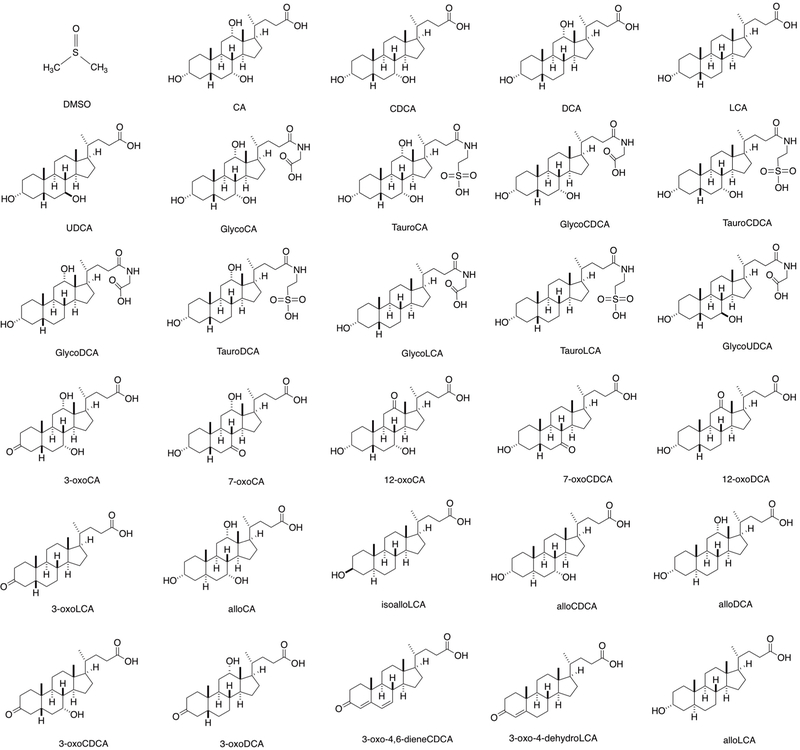
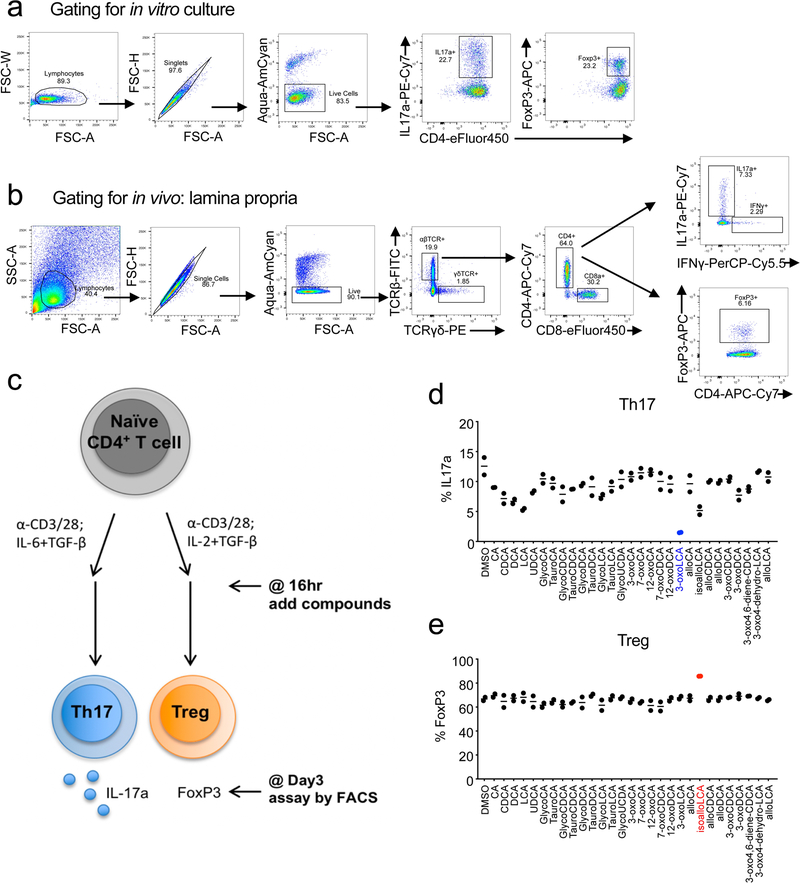
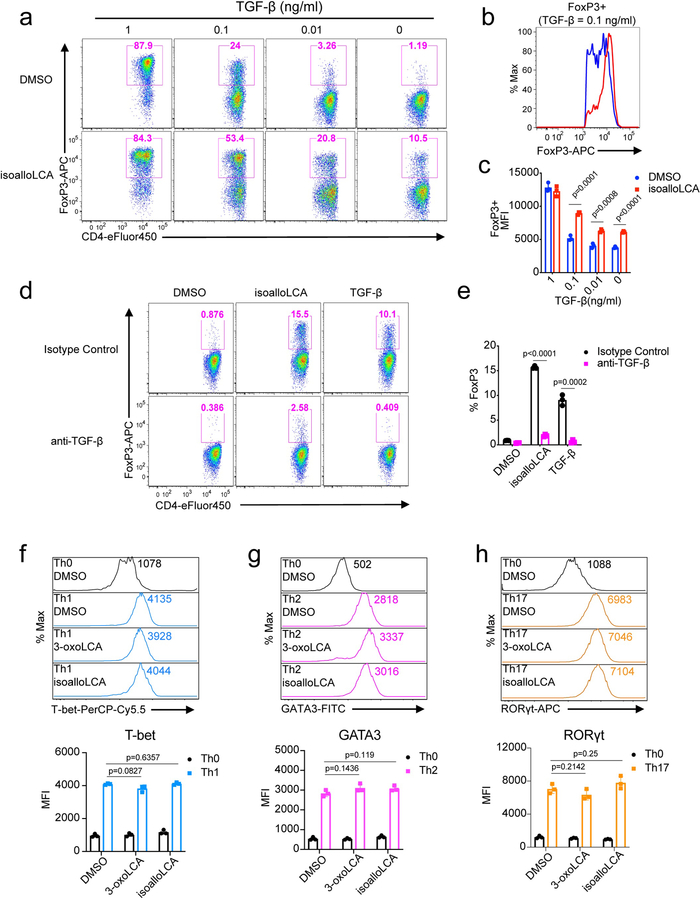
To identify bile acids with T cell modulatory effects, we screened ~30 compounds. Our screen included both primary bile acids, synthesized by the host, and secondary bile acids, produced by bacterial modification of primary bile acids (Extended Data Fig. 1). Naïve CD4+ T cells were isolated from wild-type C57BL/6J (B6) mice and cultured with bile acids under Th17 differentiation conditions and, as a counter-screen, Treg differentiation conditions (Extended Data Fig. 2). Strikingly, two distinct derivatives of LCA were found to significantly affect Th17 and Treg cell differentiation. While 3-oxoLCA inhibited Th17 differentiation, as shown by reduced IL-17a, isoalloLCA enhanced Tregs, as shown by increased FoxP3 expression (Fig. 1a, b and Extended Data Fig. 2d, e). Although isoalloLCA strongly enhanced FoxP3 expression in the presence of low, but not high, TGF-β concentrations (Fig. 1a and Extended Data Fig. 3a–c), its Treg-enhancing activity required TGF-β, because pretreatment of cells with anti-TGF-β antibody prevented FoxP3 enhancement (Extended Data Fig. 3d, e).
Figure 1. 3-oxoLCA inhibits Th17 cell differentiation while isoalloLCA enhances Treg differentiation.
a and b, Flow cytometry and its quantification of intracellular staining for IFN-γ and IL-4 or IL-17a and FoxP3 in sorted naïve T cells from wild-type B6 mice activated and expanded in the presence of mouse Th1, Th2, Th17 and Treg polarizing cytokines (n = 4, 3, 4, 3). A low concentration of TGF-β (0.01 ng/ml) was used for Treg culture. DMSO, 3-oxoLCA (20 μM) or isoalloLCA (20 μM) was added on day 0 and CD4+ T cells were gated for analyses on day 3 for Th17 and Treg, day 5 for Th1 and Th2. n, number of biologically independent samples. Data are shown as the mean ± standard deviation by unpaired t-test with 2-tailed p-value.
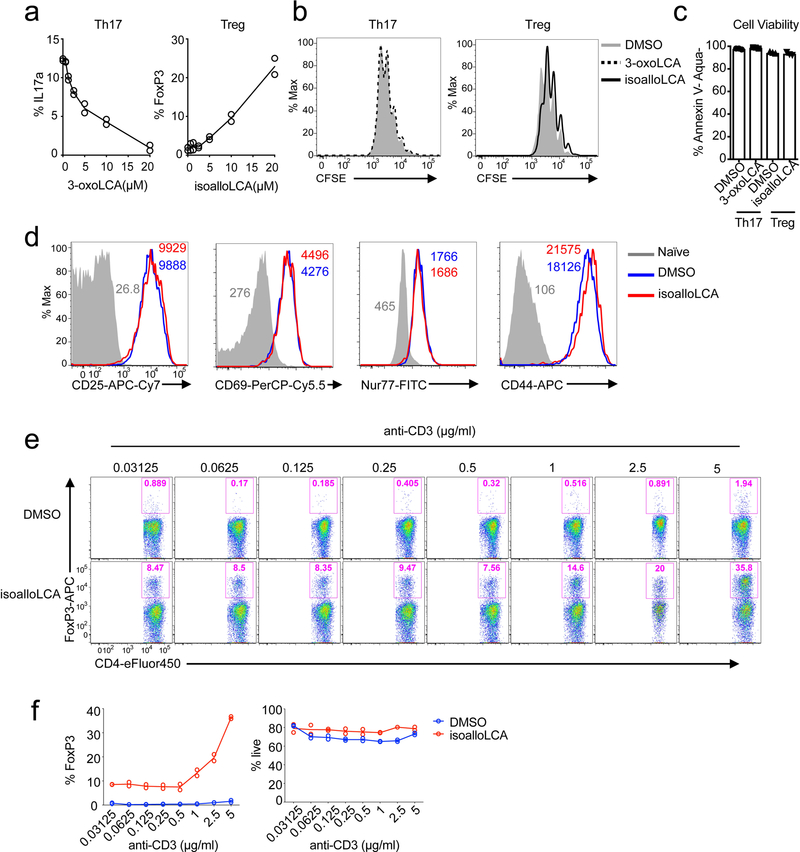
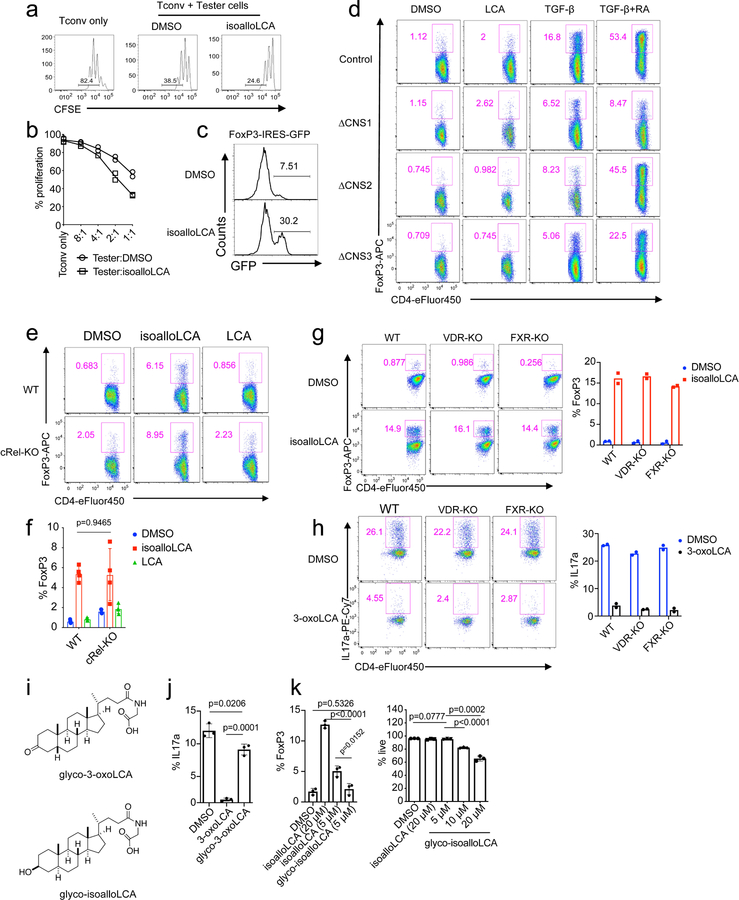
The modulatory effects of 3-oxoLCA on Th17 cells and isoalloLCA on Tregs were cell-type specific, as neither compound affected T cell differentiation into Th1 or Th2 cells assessed by the expression of the cytokines IFN-γ and IL-4 and the transcription factors T-bet and GATA3 (Fig. 1a, b and Extended Data Fig. 3f, g). Although 3-oxoLCA did not affect Tregs (Fig. 1b and Extended Data Fig. 2e), isoalloLCA reduced Th17 cell differentiation by ~50% without affecting RORγt expression (Fig. 1a, b and Extended Data Fig. 3h). Both compounds exhibited dose-dependent effects (Extended Data Fig. 4a). While 3-oxoLCA did not affect cell proliferation, isoalloLCA addition to T cells led to reduced proliferation compared to DMSO control (Extended Data Fig. 4b). IsoalloLCA treatment did not impair cell viability (Extended Data Fig. 4c) or T cell receptor (TCR)-mediated activation, as indicated by similar expression of TCR activation markers such as CD25, CD69, Nur77 and CD44 (Extended Data Fig. 4d). TCR activation promotes Treg-enhancement by isoalloLCA, as increasing TCR activation with higher concentrations of anti-CD3 resulted in stronger effects on FoxP3 expression without affecting cell viability (Extended Data Fig. 4e, f).
3-oxoLCA inhibits Th17 cell differentiation
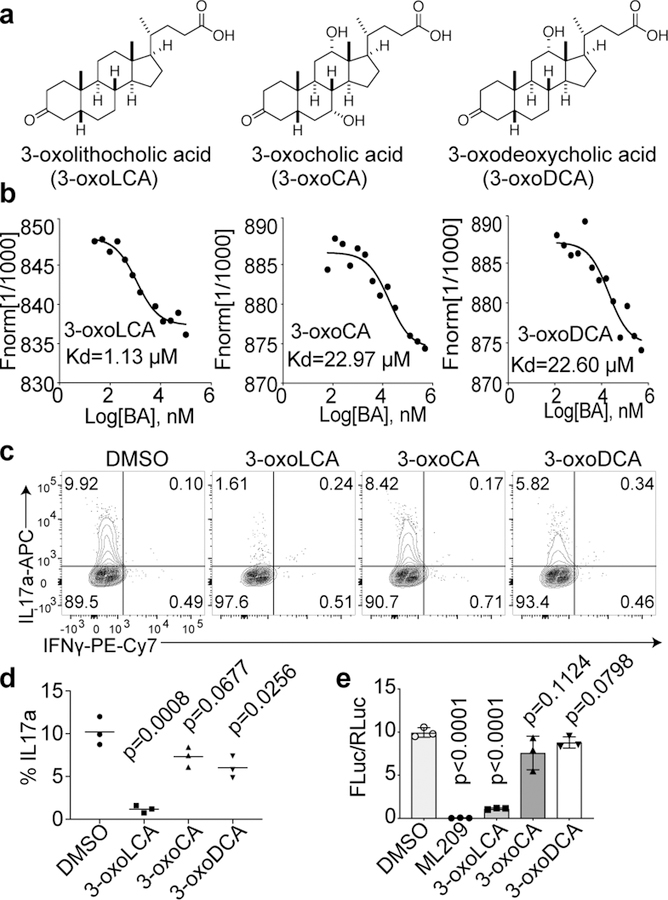
We next examined if 3-oxoLCA physically interacts with the RORγt protein in vitro. A microscale thermophoresis (MST) assay was performed with recombinant human RORγt ligand-binding domain (LBD). 3-oxoLCA exhibited a robust physical interaction with the RORγt LBD at the equilibrium dissociation constant (Kd) of ~1 μM. We also tested two other structurally similar 3-oxo derivatives of bile acids, 3-oxocholic acid (3-oxoCA) and 3-oxodeoxycholic acid (3-oxoDCA) (Fig. 2a) and demonstrated that these derivatives had ~20 times higher Kd values than 3-oxoLCA (Fig. 2b). Neither 3-oxoCA nor 3-oxoDCA inhibited Th17 cell differentiation as robustly as 3-oxoLCA (Fig. 2c, d). Next, we examined if 3-oxoLCA modulates the transcriptional activity of RORγt. We assayed the effect of the bile acids on firefly luciferase expression directed by a fusion protein of RORγt and Gal4-DBD (DNA-binding domain) in human embryonic kidney (HEK) 293 cells14. Cells treated with ML209, a specific RORγt antagonist, completely lost RORγt activity19. Likewise, 3-oxoLCA treatment significantly reduced the RORγt reporter activity (Fig. 2e). Altogether, these data suggest that 3-oxoLCA likely inhibits Th17 cell differentiation by physically interacting with RORγt and inhibiting its transcriptional activity.
Figure 2. 3-oxoLCA binds to RORγt and inhibits its transcriptional activity.
a, Chemical structures of 3-oxoLCA, 3-oxocholic acid (3-oxoCA) and 3-oxodeoxycholic acid (3-oxoDCA). b, Microscale thermophoresis assay. 3-oxoLCA binds to RORγt LBD at a much lower Kd value than the other two structurally similar bile acids. c and d, Flow cytometric analyses and quantification of IL-17a production from mouse (n = 3/group), naïve CD4+ T cells cultured for 3 days under Th17 polarization condition. DMSO or bile acids at 20 μM were added 18h after cytokine addition. e, RORγt luciferase reporter assay in HEK293 cells treated with a positive control ML209 (2 μM), 3-oxoLCA (10 μM), 3-oxoCA (10 μM), 3-oxoDCA (10 μM), or DMSO. The ratio of firefly to Renilla luciferase activity is presented on the y-axis (n = 3/group). n, number of biologically independent samples. Data are shown as the mean ± standard deviation by unpaired t-test with 2-tailed p-value.
IsoalloLCA promotes Treg differentiation
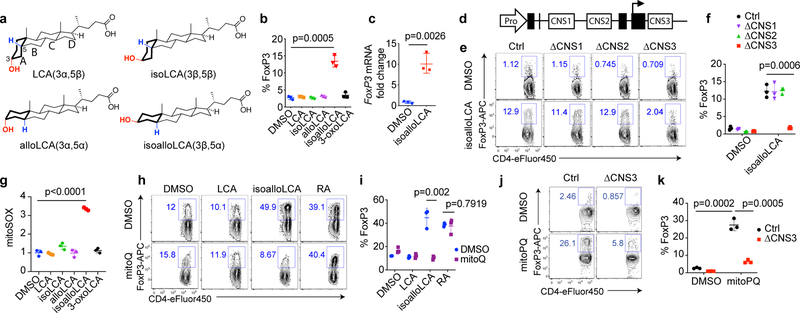
We next sought to uncover the mechanism by which isoalloLCA exerts its enhancing effects on Tregs. LCA has a 3α-hydroxyl group as well as a cis 5β-hydrogen configuration at the A/B ring junction and can undergo isomerization, presumably via the actions of gut bacterial enzymes2, to form isoLCA (3β,5β), alloLCA (3α,5α) or isoalloLCA (3β,5α) (Fig. 3a). Among LCA isomers, isoalloLCA has the lowest log D value (2.2), comparable to previously reported log D values of chenodeoxycholic acid (CDCA, 2.2) and ursodeoxycholic acid (UDCA, 2.2) (Extended Data Table 1), suggesting isoalloLCA is less lipophilic than other isomers. IsoalloLCA, but not the other LCA isomers, enhanced FoxP3 expression, confirming that both the 3β-hydroxyl group and trans (5α-hydrogen) A/B ring configuration of isoalloLCA are required for Treg enhancement (Fig. 3b). Compared to DMSO-treated cells, isoalloLCA-treated cells inhibited T effector cell proliferation in vitro, indicating they had acquired regulatory activity (Extended Data Fig. 5a, b). T cells isolated from FoxP3-GFP reporter mice exhibited both increased FoxP3 mRNA expression (Fig. 3c) and enhanced GFP levels following isoalloLCA treatment (Extended Data Fig. 5c). Thus, isoalloLCA-induced enhanced expression of FoxP3 occurs at the FoxP3 mRNA transcriptional level.
Figure 3. mitoROS is necessary and sufficient for isoalloLCA-dependent enhanced expression of FoxP3.
a, Chemical structures of LCA and its isomers: isoLCA, alloLCA and isoalloLCA. b, FoxP3 expression from mouse naïve CD4+ T cells cultured for 3 days with anti-CD3/28 and IL-2. DMSO or bile acids at 20 μM were added to cell culture (n = 3/group). c, qPCR analysis for FoxP3 transcripts in DMSO- or isoalloLCA- (20 μM) treated cells (n = 3/group). d, Diagram of the FoxP3 gene locus containing the promoter region (Pro) and intronic enhancer regions (CNS1, CNS2 and CNS3). e and f, Flow cytometric analyses and quantification of CD4+ T cells stained intracellularly for FoxP3. Naïve CD4+ T cells isolated from wild-type control, CNS1, CNS2 or CNS3 knockout mice were cultured with anti-CD3/28 and IL-2, in the presence of DMSO or isoalloLCA (20 μM) (n = 3/group). g, Mitochondrial ROS production measured by mitoSOX staining with T cells cultured in the presence of DMSO or LCA isomers for 48h. Staining intensity was reported as mean fluorescence intensity from flow cytometry analysis (PE channel). Different conditions were then normalized as fold change to the values of DMSO condition (n = 3/group). h and i, Representative FACS plots and quantification of T cells stained intracellularly for FoxP3, cultured with anti-CD3/28, IL-2 and TGF-β (0.05 ng/ml) in the presence of DMSO, LCA, isoalloLCA (20 μM) or retinoic acid (1 nM), with DMSO or mitoQ (0.5 μM) for 72 h (n = 3/group). j and k, Flow cytometric analyses and quantification of CD4+ T cells stained intracellularly for FoxP3. Naïve CD4+ T cells isolated from control or CNS3 knockout mice were cultured with anti-CD3/28 and IL-2 in the presence of DMSO or mitoPQ (10 μM) (n = 3/group). n, number of biologically independent samples. Data are shown as the mean ± standard deviation by unpaired t-test with 2-tailed p-value.
FoxP3 transcription is regulated by three conserved non-coding enhancers, termed CNS1, 2 and 3 (Fig. 3d), which have distinct roles in Treg development, stability and function20–22. Treg-promoting small molecules such as the bacterial metabolite butyrate and the vitamin A derivative retinoic acid (RA) enhance FoxP3 expression in a CNS1-dependent manner23,24. TGF-β also partially requires CNS1 for its Treg-promoting activity due to the binding of its downstream signaling molecule SMAD3 to the CNS1 enhancer22,25. Whereas CD4+ T cells from mice with deletions in CNS1 and CNS2 up-regulated FoxP3 in response to isoalloLCA, cells lacking CNS3 failed to respond (Fig. 3e, f). In contrast, RA and TGF-β boosted Treg differentiation in CNS3-deficient cells, albeit with reduced efficiency (Extended Data Fig. 5d). Thus, unlike other small molecules that promote Treg differentiation in a CNS1-dependent manner, the FoxP3-enhancing activity of isoalloLCA requires CNS3.
We investigated other known regulators of T cell function. The transcription factor cRel binds to the CNS3 enhancer to induce FoxP3 expression22. We found that WT and cRel-deficient cells express similar levels of FoxP3 upon isoalloLCA treatment (Extended Data Fig. 5e, f). LCA targets the vitamin D receptor (VDR)26 and the farnesoid X receptor (FXR)27. VDR was also implicated in the modulation of both Th17 and Treg cell function28–31. Compared to a DMSO-treated control, isoalloLCA-treated cells deficient in VDR or FXR had similar amounts of FoxP3 induction (Extended Data Fig. 5g). Thus, CNS3-dependent activation of FoxP3 by isoalloLCA is unlikely to be mediated through the actions of cRel, VDR or FXR. VDR and FXR also failed to contribute to the suppressive activities of 3-oxoLCA on Th17 cells (Extended Data Fig. 5h). Of note, conjugating glycine to 3-oxoLCA or isoalloLCA reduced their immunomodulatory effects (Extended Data Fig. 5i–k).
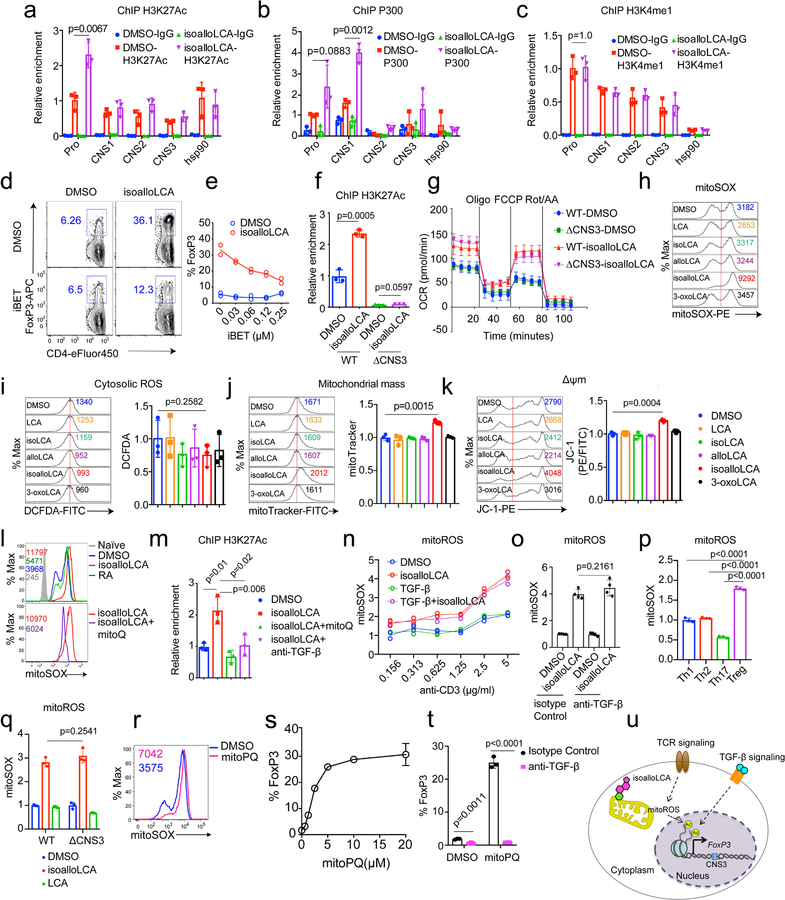
CNS3 was previously implicated in Treg cell development by promoting epigenetic modifications such as H3K27 acetylation (H3K27Ac) and H3K4 methylation at the FoxP3 promoter region21. Cells treated with isoalloLCA, compared to those treated with DMSO, had increased H3K27Ac levels at the FoxP3 promoter region (Extended Data Fig. 6a). Consistent with this, isoalloLCA treatment increased histone acetyltransferase p300 recruitment (Extended Data Fig. 6b). However, isoalloLCA did not affect H3K4 methylation (Extended Data Fig. 6c). A pan-bromodomain inhibitor iBET that antagonizes H3K27Ac prevented isoalloLCA-dependent enhancement of FoxP3 in a dose-dependent manner (Extended Data Fig. 6d, e). In line with previous work21, CNS3 deficiency not only reduced basal levels of H3K27Ac but also abrogated the isoalloLCA-dependent increase of H3K27Ac at the FoxP3 promoter region (Extended Data Fig. 6f). Therefore, CNS3 is likely needed to establish a permissible chromatin landscape, whereupon the promoter region is further acetylated following isoalloLCA treatment.
Increased mitoROS enhances FoxP3 expression
Cellular metabolism and epigenetic modification are intricately related. For example, byproducts of mitochondrial metabolism serve as substrates for histone acetylation and methylation32. Tregs mainly rely on oxidative phosphorylation (OxPhos) for their energy production33–35. Recent studies identified two metabolites, 2-hydroxyglutarate and D-mannose, that promote Treg generation by modulating mitochondrial activities36,37. To assess whether isoalloLCA affects OxPhos, we measured the oxygen consumption rate (OCR), with T cells cultured for 48 hours following DMSO or isoalloLCA treatment. At this time point, FoxP3 is not yet strongly induced, thus making it possible to assess isoalloLCA effects on cellular metabolism before cells are fully committed to becoming Tregs. Compared to DMSO, isoalloLCA treatment increased OCR, both in WT and CNS3-KO cells (Extended Data Fig. 6g), suggesting that isoalloLCA treatment increases mitochondrial activity. Reactive oxygen species (ROS) are produced as byproducts of mitochondrial OxPhos. Whereas D-mannose increases cytoplasmic ROS production37, isoalloLCA treatment led to increased production of mitochondrial ROS (mitoROS) without affecting cytoplasmic ROS (Fig. 3g and Extended Data Fig. 6h, i). Unlike isoalloLCA, other LCA isomers failed to increase mitoROS production (Fig. 3g). Furthermore, isoalloLCA-treated cells displayed a modest, but significant, increase in total mitochondrial mass and mitochondrial membrane potential (Extended Data Fig. 6j, k). To test if mitoROS is directly involved in enhanced Treg differentiation by isoalloLCA, we employed mitoQ, a mitochondrially-targeted antioxidant, to reduce ROS levels in mitochondria (Extended Data Fig. 6l). Importantly, in the presence of mitoQ, isoalloLCA was no longer effective in enhancing Treg differentiation (Fig. 3h, i). In contrast, RA-dependent induction of Tregs was unaffected by mitoQ treatment (Fig. 3h, i). We next investigated if mitoROS production is responsible for the enhanced H3K27Ac levels at the FoxP3 promoter of isoalloLCA-treated cells. Co-treating cells with isoalloLCA and mitoQ decreased H3K27Ac levels compared to those treated with isoalloLCA only (Extended Data Fig. 6m). Stronger TCR stimulation that enhances FoxP3 expression (Extended Data Fig. 4d, e) also increased mitoROS production (Extended Data Fig. 6n)38. Although TGF-β, which is essential for the FoxP3-enhancing activity of isoalloLCA (Extended Data Fig. 3d, e), was not required for the increased mitoROS production (Extended Data Fig. 6o), it was required for the isoalloLCA-induced acetylation of H3K27 at the FoxP3 promoter (Extended Data Fig. 6m). Because FoxP3 itself enhances mitochondrial OxPhos39, and FoxP3-expressing Tregs had higher mitoROS levels compared to other CD4+ T cell subsets (Extended Data Fig. 6p), we investigated if increased mitoROS production was a secondary effect of enhanced FoxP3 expression. CNS3-deficient cells that did not express high levels of FoxP3 in response to isoalloLCA treatment nevertheless exhibited enhanced OxPhos and increased levels of mitoROS (Fig. 3e, f and Extended Data Fig. 6g, q). We then investigated whether mitoROS is sufficient to promote Treg differentiation using the mitochondria-targeted redox cycler, mitoParaquat (mitoPQ)40. The addition of mitoPQ to T cell culture was sufficient to enhance mitoROS production and Treg differentiation in a dose-dependent manner (Extended Data Fig. 6r, s). Like isoalloLCA, Treg differentiation induced by mitoPQ required the CNS3 enhancer and TGF-β (Fig. 3j, k and Extended Data Fig. 6t). Taken together, our data support a model in which isoalloLCA promotes Treg differentiation by enhancing mitoROS production and increasing H3K27 acetylation at the FoxP3 promoter region, which also requires TGF-β-induced signaling (Extended Data Fig. 6u).
Bile acids modulate T cell activities in vivo
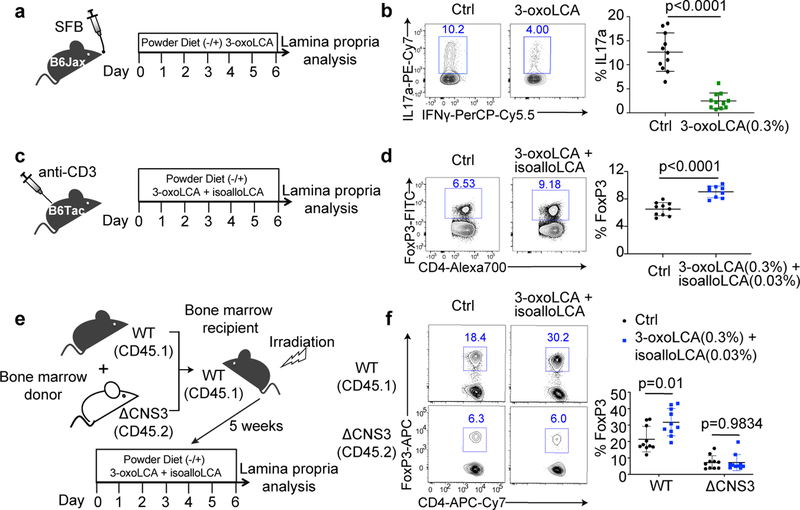
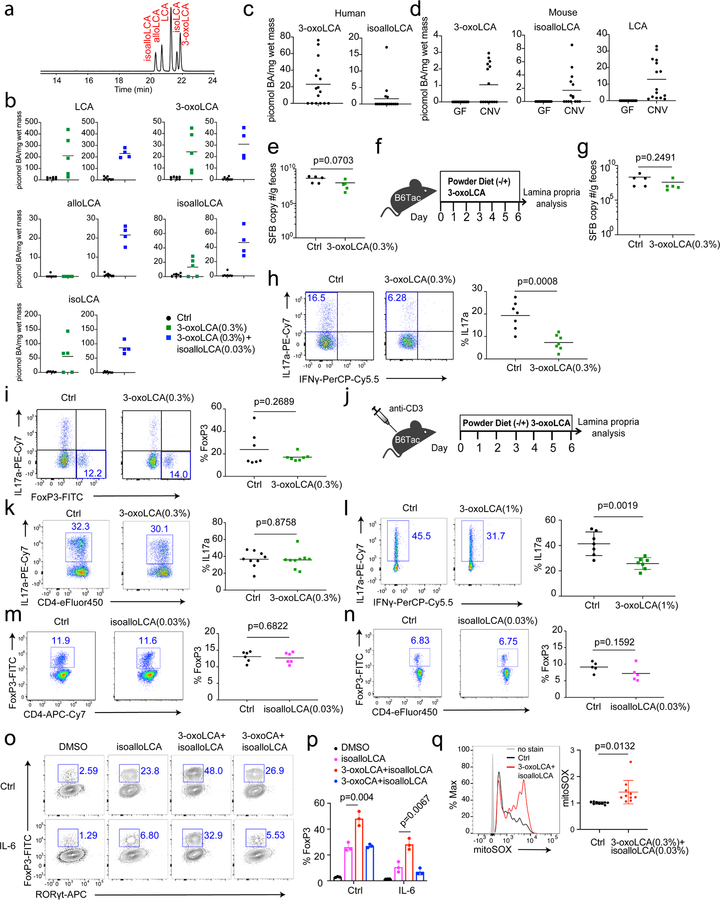
We next examined whether 3-oxoLCA and isoalloLCA influence Th17 and Treg cell differentiation in vivo using the mouse model. Segmented filamentous bacteria (SFB), a murine commensal, is known to induce Th17 cell differentiation in the small intestine of B6 mice41. C57BL/6NTac mice from Taconic Biosciences (Tac) have abundant Th17 cells in their small intestine owing to the presence of SFB. In contrast, C57BL/6J mice from Jackson Laboratories (Jax), which lack SFB, have few intestinal Th17 cells. To determine whether 3-oxoLCA suppresses Th17 cell differentiation in vivo, we gavaged Jax-B6 mice with an SFB-containing fecal slurry and fed these animals either a control diet or 0.3% (w/w) 3-oxoLCA-containing chow for one week (Fig. 4a). The resulting average concentration of this metabolite in cecal contents was 24 picomol/mg of wet mass (approximately equivalent to μM) (Extended Data Fig. 7a, b). This concentration was sufficient to suppress Th17 differentiation in vitro (Fig. 1c). Indeed, 3-oxoLCA treatment significantly reduced the percentage of ileal Th17 cells (Fig. 4b). When we quantified the average levels of 3-oxoLCA in the stool of human patients with ulcerative colitis or in the ceca of conventionally housed mice, we observed a mean concentration of 23 or 1.0 picomol/mg, respectively (Extended Data Fig. 7c, d). SFB colonization levels were comparable between control and 3-oxoLCA-treated groups, suggesting that the change in Th17 cell percentage was not due to a decrease in SFB colonization (Extended Data Fig. 7e). In addition, Tac-B6 mice with pre-existing SFB had reduced levels of Th17 cell percentages when fed with 3-oxoLCA compared to those fed with vehicle (Extended Data Fig. 7f–h). 3-oxoLCA treatment did not affect Treg percentages (Extended Data Fig. 7i). Even under gut inflammatory conditions induced by anti-CD3 injection, known to produce a robust Th17 cell response18,42, mice treated with 1%, but not with 0.3%, 3-oxoLCA had reduced Th17 cell levels (Extended Data Fig. 7j–l).
Figure 4. 3-oxoLCA inhibits Th17 development while isoalloLCA enhances Treg cells in vivo.
a and b, Experimental scheme (a) and flow cytometric analysis (b) of Th17 induction by SFB. Jax-B6 animals were gavaged with SFB-rich fecal pellets and kept on 3-oxoLCA (0.3%) for a week (n = 11 mice/group). c and d, Experimental scheme (c) and flow cytometric analysis (d) of anti-CD3 experiment with a mixture of 3-oxoLCA + isoalloLCA (n = 10/9 mice for Ctrl/3-oxoLCA+isoalloLCA). B6 animals were i.p. injected with anti-CD3 and fed a control diet or mixture of 3-oxoLCA (0.3%) + isoalloLCA (0.03%) during the experiments. e and f, Experimental scheme (e) and flow cytometric analysis (f) of T cells isolated from the ileal lamina propria. Bone marrow cells from WT (CD45.1) and ΔCNS3 (CD45.2) mice were mixed at a 1:1 ratio and transferred into irradiated WT (CD45.1) recipient mice. Five weeks after the transfer, recipient mice were fed a control diet or a diet containing a mixture of 3-oxoLCA (0.3%) + isoalloLCA (0.03%), followed by an anti-CD3 injection (n = 10 mice/group). Data shown as the mean ± standard deviation by unpaired t-test with 2-tailed p-value.
To examine the effects of isoalloLCA on Tregs in vivo, we fed SFB-colonized B6 mice a control diet or a diet containing 0.03% (w/w) isoalloLCA. IsoalloLCA alone was insufficient to enhance Treg percentages both at steady state (Extended Data Fig. 7m) and following anti-CD3 treatment (Extended Data Fig. 7n). We noted that 3-oxoLCA further enhanced Treg differentiation induced by isoalloLCA in vitro (Extended Data Fig. 7o, p). In line with this observation, a mixture of 0.3% (w/w) 3-oxoLCA and 0.03% (w/w) isoalloLCA significantly enhanced the Treg population in mice treated with anti-CD3 compared to control diet (Fig. 4c, d). Consistent with the mechanism in vitro, this treatment led to increased mitoROS production among CD4+ T cells in the ileal lamina propria (Extended Data Fig. 7q). Importantly, the 3-oxoLCA/isoalloLCA-induced enhanced FoxP3 expression in vivo was also dependent on the CNS3 enhancer because ΔCNS3, unlike WT, cells no longer responded to this treatment in a mixed bone marrow experiment (Fig. 4e, f). Feeding both isoalloLCA and 3-oxoLCA in chow resulted in an average concentration of 47 picomol/mg isoalloLCA in cecal contents (Extended Data Fig. 7b). This concentration was sufficient to enhance Treg differentiation in vitro (Fig. 1c). The mean concentration of isoalloLCA in the stool of human ulcerative colitis patients was 2 picomol/mg and ranged from 0 – 17 picomol/mg (Extended Data Fig. 7c). These values are within an order of magnitude of the concentrations observed in mice fed 0.03% isoalloLCA and 0.3% 3-oxoLCA, suggesting that the in vivo levels of isoalloLCA achieved are physiologically relevant.
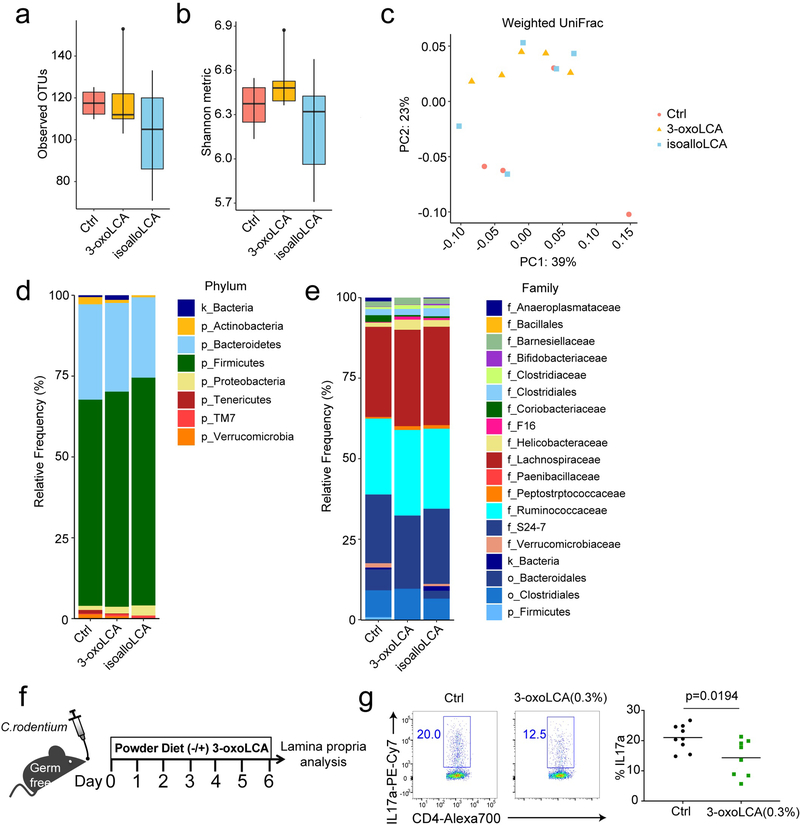
We next asked whether the immunomodulatory roles of 3-oxoLCA and isoalloLCA are mediated through changes in the composition of the gut bacterial community. 16S rDNA sequencing with fecal samples of mice fed bile acid-containing diets revealed no significant perturbations in the gut bacterial community, compared to those on a control diet (Extended Data Fig. 8a–e). Furthermore, 3-oxoLCA treatment reduced Th17 cell induction in the colons of germ-free B6 mice infected with Citrobacter rodentium (Extended Data Fig. 8f, g). Thus, the Th17 and Treg modulatory activities of 3-oxoLCA and isoalloLCA do not likely require the presence of a community of commensal bacteria. Altogether, these data suggest that both 3-oxoLCA and isoalloLCA directly modulate Th17 and Treg cell responses in mice in vivo.
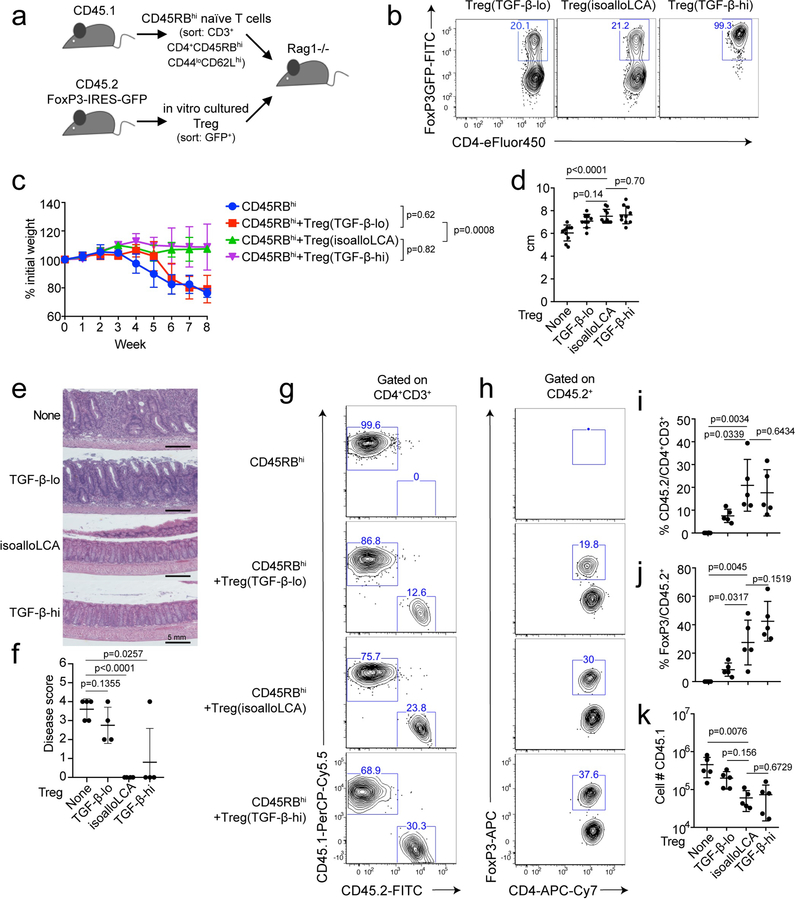
Lastly, we investigated if in vitro treatment of T cells with isoalloLCA produced Tregs competent to exert suppressive function in vivo. The same number of FoxP3+ T cells (CD45.2), sorted from T cell cultures with low or high TGF-β concentrations (TGF-β-lo/-hi Tregs) in the absence or presence of isoalloLCA, were adoptively transferred into Rag1 KO mice that had also received CD45RBhi naïve CD4+ T cells (CD45.1) (Extended Data Fig. 9a, b). Mice that received CD45RBhi or CD45RBhi and TGF-β-lo Tregs developed significant weight loss and shortened colon phenotypes, both of which are indicators of colitis-associated symptoms (Extended Data Fig. 9c–f). In contrast, adoptive transfer of isoalloLCA-treated Tregs protected mice from developing colitis-associated symptoms to the same degree as those transferred with TGF-β-hi Tregs (Extended Data Fig. 9c–f). Tregs treated with isoalloLCA were more stable in terms of FoxP3 expression, compared to TGF-β-lo Tregs treated with DMSO, analyzed eight weeks post transfer (Extended Data Fig. 9g–j). In addition, mice receiving isoalloLCA-treated Tregs had reduced numbers of CD45.1+ T effector cells (Extended Data Fig. 9k). Therefore, isoalloLCA likely promotes stability of Treg cells and enhances their function following adoptive transfer in vivo, leading to decreased proliferation of T effector cells.
Discussion
Certain bile acids are thought to be tissue-damaging agents that promote inflammation due to their enhanced accumulation in patients with liver diseases and their chemical properties as detergents that disrupt cellular membranes43. Recent studies, however, have begun to reveal their anti-inflammatory roles, particularly in the innate immune system by suppressing NF-κB-dependent signaling pathways44,45 and by inhibiting NLRP3-dependent inflammasome activities11. Our studies reveal additional anti-inflammatory roles of two LCA metabolites found in both humans and rodents46–48 that directly affect CD4+ T cells: 3-oxoLCA suppresses Th17 differentiation while isoalloLCA enhances Treg differentiation. Our data suggest that both 3-oxoLCA and isoalloLCA are present in the stool samples of human colitis patients as well as in the ceca of conventionally-housed Jax-B6 mice (Extended Data Fig. 7c, d). Importantly, both bile acids are completely absent in germ-free B6 mice (Extended Data Fig. 7d). These data suggest that gut-residing bacteria may contribute to the production of 3-oxoLCA and isoalloLCA, although we cannot rule out the possibility that host enzymes are involved. Given the significant roles of Th17 and Treg cells in a wide variety of inflammatory diseases and their close relationship with gut-residing bacteria, our study suggests the existence of novel modulatory pathways that regulate T cell function through bile acid metabolites. Future studies to elucidate the bacteria or host enzymes that generate 3-oxoLCA and isoalloLCA will provide novel means for controlling T cell function in the context of autoimmune diseases and other inflammatory conditions.
Methods
Animals
C57BL/6, FoxP3-GFP, FXR-KO, VDR-KO, CD45.1, Rag1-KO mice were purchased from Jackson Laboratory. SFB-containing C57BL/6 mice were purchased from Taconic bioscience. FoxP3-CNS-KO and control mice were provided by the Ye Zheng Lab. All animal procedures were approved by the Institutional Animal Care and Use Committee at Harvard Medical School.
Chemical Synthesis of 3-oxoLCA, isoalloLCA, glyco-3-oxoLCA, and glyco-isoalloLCA
Detailed synthesis methods and characterization data are included in the supplementary information.
Measurement of lipophilicity
Partitioning Method: 2 μL of 10 mM stock solutions of each target compound was added to a 1 mL each of 50 mM ammonium bicarbonate (pH = 8), and 1 mL of n-octanol in an Eppendorf tube. The resulting two-phase mixture was vortexed and then shaken for 18h at 20 °C. The two phases were then carefully separated into the aqueous sample (bottom layer), and organic sample (top-layer) and placed separately in autosampler vials and analyzed by LC-MS/MS. LC-MS Method: a Thermo q-Exactive Plus LC-MS equipped with an Ultimate 3000 HPLC was operated in negative ion mode after optimized to detect the [M – H]– of the bile acids. Mobile phase A was 5 mM ammonium acetate with 0.012% formic acid and mobile phase B was HPLC grade methanol. A Dikma Inspire C8 column (3 μm particle size, 100 mm length, 4.6 mm ID) was used for analysis. Each injection was 5 μL, and a constant flow rate of 0.400 L/min was used. The gradient started at 0% B and was held constant for 2 minutes. Then the mobile phase composition was linearly changed to 100% B over 8 minutes and held at 100% for the following 5 minutes. The mobile phase composition was changed to 0% B over the following 0.1 minutes and the system was allowed to equilibrate to starting conditions over 1.9 minutes. Standards of all targets were used to establish retention times. Better than 2 ppm mass accuracy was obtained on all measurements. The LC-MS analysis was done in triplicate, while the partitioning was done once for each target’s [M – H]– ion. Calculation of log D: the total response of target in octanol was divided by the total response in the aqueous phase to get a partitioning coefficient. Then, log base 10 was taken and reported.
Human fecal specimens
Fecal samples were obtained from patients with active ulcerative colitis under an Institutional Review Board–approved protocol and informed consent was obtained at Weill Cornell Medicine (WCM). Active inflammation was defined by a Mayo endoscopic score of > 1.
In vivo bile acid analysis
Stock solutions of all bile acids were prepared by dissolving the compounds in molecular biology grade DMSO (Sigma Aldrich). These solutions were used to establish standard curves. Glycocholic acid (GCA) or β-muricholic acid (β-MCA) (Sigma Aldrich) was used as the internal standard for mouse and human samples, respectively. Bile acids were extracted from mouse cecal and human fecal samples and quantified by Ultra-High Performance Liquid Chromatography-Mass Spectrometry (UPLC-MS) as previously reported49. The limits of detection of individual bile acids in tissues (in picomol/mg wet mass) are as follows: βMCA, 0.10; isoalloLCA, 0.45; isoLCA, 0.29; LCA, 0.12; alloLCA, 0.43; and 3-oxoLCA, 0.18.
In Vitro T Cell Culture
Naïve CD4+ (CD62L+ CD44− CD25− CD4+) T cells were isolated from the spleens and the lymph nodes of mice of designated genotypes with FACS sorting. For certain experiments, naïve CD4+ T cells were enriched using naïve CD4+ T cell isolation kits (Miltenyi). Naïve CD4+ T cells (40,000 cells) were cultured in a 96-well plate pre-coated with hamster IgG (MP Biomedicals) in T cell medium (RPMI, 10% fetal bovine serum, 25 mM glutamine, 55 µM 2-mercaptoethanol, 100 U/mL penicillin, 100 mg/mL streptomycin) supplemented with 0.25 µg/mL anti-CD3 (clone 145–2C11) and 1 µg/mL anti-CD28 (clone 37.51). For Th0 culture, T cells were cultured with the addition of 100 U/mL of IL-2 (PEPROTECH). For Th1 cell differentiation, T cells were cultured with the addition of 100 U/mL of IL-2, 10 µg/mL of anti-IL-4 (clone 11B11) and 10 ng/mL of IL-12 (PEPROTECH). For Th2 cell differentiation, T cells were cultured with the addition of 10 µg/mL of anti-IFNγ (clone XMG1.2) and 10 ng/mL of IL-4 (R&D Systems). For Th17 cell differentiation, T cells were cultured with the addition of 10 ng/mL of IL-6 (eBioscience) and 0.5 ng/mL of TGF-β (PEPROTECH). For Treg culture, T cells were cultured with the addition of 100 U/mL of IL-2 and various concentrations of TGF-β. For most in vitro experiments to test the effects of isoalloLCA, no additional TGF-β was added. Bile acids, retinoic acid (Sigma) or mitoQ (Focus Biomolecules), or mitoPQ (Sigma) were added either at 0 or 16h time points. Compounds with low water solubility were sonicated before adding to the culture. Cells were harvested and assayed by flow cytometry on day 3. For ROS and mitochondrial membrane potential detection, cells cultured for 2 days were incubated with 5 µM of mitoSOX (ThermoFisher), 10 µM of DCFDA (Sigma) or 2 µM of JC-1(ThermoFisher) for 30 min and assayed with flow cytometry.
Flow Cytometry
Cells harvested from in vitro culture or in vivo mice experiments were stimulated with 50 ng/mL PMA (Phorbol 12-myristate 13-acetate, Sigma) and 1 µM ionomycin (Sigma) in the presence of GolgiPlug (BD) for 4h to determine cytokine expression. After stimulation, cells were stained with cell surface marker antibodies and LIVE/DEAD Fixable dye, Aqua, to exclude dead cells, fixed and permeabilized with a FoxP3/Transcription factor staining kit (eBioscience), followed by staining with cytokine- and/or transcription factor-specific antibodies. All flow cytometry analyses were performed on an LSR II flow cytometer (BD) and data were analyzed with FlowJo software (TreeStar).
Cell Proliferation Assay
Naïve CD4+ T cells were labeled with 1 µM carboxyfluorescein succinimidyl ester (CFSE, BioLegend) and cultured for 3 days prior to FACS analysis.
In Vitro Suppression Assay
A total of 2.5 × 10⁴ freshly-purified naïve CD4+CD25−CD44−CD62Lhigh T cells (Tconv) from CD45.1 B6 mice were labeled with 1 µM CFSE, activated with soluble anti-CD3 (1 µg/mL) and 5 × 10⁴ APCs in 96-well round-bottom plates for 3 days in the presence of tester cells (CD45.2). The CFSE dilution of CD45.1 Tconv cells was assessed by flow cytometry.
Mammalian Luciferase Reporter Assay
Reporter assays were conducted as previously described14. Briefly, 50,000 human embryonic kidney 293 cells per well were plated in 96-well plates in antibiotic-free Dulbecco’s Modified Eagle Media (DMEM) containing 1% fetal calf serum (FCS). Cells were transfected with a DNA mixture containing 0.5 μg/mL of firefly luciferase reporter plasmid (Promega pGL4.31 [luc2P/Gal4UAS/Hygro]), 2.5 ng/mL of a plasmid containing Renilla luciferase (Promega pRL-CMV), and Gal4-DNA binding domain-RORγ (0.2 μg/mL). Transfections were performed using TransIT-293 (Mirus) according to the manufacturer’s instruction. Bile acids or vehicle control were added 24h after transfection and luciferase activity was measured 16 h later using the dual-luciferase reporter kit (Promega).
Microscale Thermophoresis Assay
The binding affinity of the compounds with RORγ ligand-binding domain (LBD) was analyzed by microscale thermophoresis (MST). Purified RORγ-LBD was labeled with the Monolith NT™ Protein Labeling Kit RED (NanoTemper Technologies). Serially-diluted compounds, with concentrations of 1 mM to 20 nM, were mixed with 55 nM labeled RORγ-LBD at room temperature and loaded into Monolith TM standard-treated capillaries. Binding was measured by monitoring the thermophoresis with 20% LED power and ‘Medium’ MST power on a Monolith NT.115 instrument (Nano Temper Technologies) with the following time setting: 5s Fluo, Before; 20s MST On; and 5s Fluo, After. Kd values were fitted using the NT Analysis software (Nano Temper Technologies).
RT-qPCR
Total RNA was isolated from cultured T cells using an RNeasy kit (Qiagen) and reverse transcribed using a PrimeScript RT kit (Takara). All qPCRs were run on the Bio-Rad CFX real-time system using iTaq Universal SYBR Green Supermix (Bio-Rad). β-actin was used as an internal control to normalize the data across different samples. Primers used for qPCR were as follows: FoxP3-F, 5’-ACTGGGGTCTTCTCCCTCAA-3’; FoxP3-R, 5’-CGTGGGAAGGTGCAGAGTAG-3’; β-actin-F, 5’-CGCCACCAGTTCGCCATGGA-3’; β-actin-R, 5’-TACAGCCCGGGGAGCATCGT-3’.
Metabolic Assays
In vitro differentiated cells were cultured in the presence of DMSO or isoalloLCA for 48h, and washed extensively before the assay. Oxygen consumption rate (OCR) was determined using a Seahorse XF96 Extracellular Flux Analyzer (Seahorse Bioscience) following protocols recommended by the manufacturer and according to the previously published method50. Briefly, cells were seeded on XF96 microplates (150,000 cells/well) that had been pre-coated with poly-D-lysine (Sigma) to immobilize cells. Cells were maintained in XF medium in a non-CO2 incubator for 30 min before the assay. The Mito stress test kit (Agilent) was used to test OCR by sequential injection of 1 µM oligomycin, 1.5 µM FCCP and 0.5 µM rotenone/antimycin A. Data were analyzed by wave software (Agilent).
Chromatin Immunoprecipitations
Chromatin immunoprecipitation (ChIP) assays were performed according to standard protocol. Briefly, naïve CD4+ T cells were cultured for 48h, and fixed for 10 min with 1% formaldehyde. Then 0.125 M glycine was added to quench the formaldehyde. Cells were lysed, and chromatin was harvested and fragmented by sonication at a concentration of 107 cells/ChIP sample. Chromatin was immunoprecipitated with 5 μg of ChIP or IgG control antibodies at 4 °C overnight and incubated with protein G magnetic beads (ThermoFisher) at 4 °C for 2h, washed, and eluted in 150 µL elution buffer. Eluate DNA and input DNA were incubated at 65 °C to reverse the crosslinking. After digestion with proteinase K, DNA was purified with the QIAquick PCR purification kit (Qiagen). The relative abundance of precipitated DNA fragments was analyzed by qPCR using SYBR Green Supermix (Bio-Rad). The primers used were as follows: FoxP3-Promoter-F, 5’-TAATGTGGCAGTTTCCCACAAGCC-3’; FoxP3-Promoter-R, 5’-AATACCTCTCTGCCACTTTCGCCA-3’; FoxP3-CNS1-F, 5’-AGACTGTCTGGAACAACCTAGCCT-3’; FoxP3-CNS1-R, 5’-TGGAGGTACAGAGAGGTTAAGAGCCT-3’; FoxP3-CNS2-F, 5’-ATCTGGCCAAGTTCAGGTTGTGAC-3’; FoxP3-CNS2-R, 5’-GGGCGTTCCTGTTTGACTGTTTCT-3’; FoxP3-CNS3-F, 5’-TCTCCAGGCTTCAGAGATTCAAGG-3’; FoxP3-CNS3-R, 5’-ACAGTGGGATGAGGATACATGGCT-3’; FoxP3-ex10-F, 5’-CTGCATCGTAGCCACCAGTA-3’; FoxP3-ex10-R, 5’-AACTATTGCCATGGCTTCC-3’; Hsp90ab-F, 5’-TTACCTTGACGGGAAAGCCGAGTA-3’; Hsp90ab-R, 5’-TTCGGGAGCTCTCTTGAGTCACC-3’.
Isolation of Lamina Propria Lymphocytes
Gut tissues were harvested and treated with 1 mM DTT at room temperature for 10 min, and 5 mM EDTA at 37 °C for 20 min to remove epithelial cells, and dissociated in digestion buffer (RPMI, 1 mg/mL collagenase type VIII, 100 μg/mL DNase I, 5% FBS) with constant stirring at 37 °C for 30 min. Mononuclear cells were collected at the interface of a 40%/80% Percoll gradient (GE Healthcare). Cells were then analyzed by flow cytometry. The distal one-third of the small intestines was considered ileum.
Animal Experiments
For bile acid feeding experiments, the standard mouse diet in ground meal format (PicoLab Diet, #5053) was evenly mixed with a measured amount of bile acid compounds and provided in glass feeder jars and replenished when necessary. Colonization of mice with SFB was done with fresh fecal samples, derived from il23r; rag2 double-knockout mice that are known to carry much higher levels of SFB compared to conventional B6 mice. Fecal samples were homogenized in water using a 70-μm cell strainer and a 5 mL syringe plunger. Supernatant was introduced into mice using a 20G gavage needle at 250 μL/animal, approximately equal to the amount of 1/4 mouse fecal pellets. Successful colonization was assessed by quantitative PCR, using the following primers: SFB-F, 5’-GACGCTGAGGCATGAGAGCAT-3’; SFB-R, 5’-GACGGCACGAATTGTTATTCA-3’; universal 16S-F, 5’-ACTCCTACGGGAGGCAGCAGT-3’; universal 16S-R, 5’-ATTACCGCGGCTGCTGGC-3’. For the Citrobacter rodentium infection experiment, age- and sex-matched germ-free mice were orally infected with approximately 1×10⁶ CFU of C. rodentium and sacrificed for analysis at 6 days post-infection. Animals were kept in IsoCage system (Tecniplast) and fed an autoclaved diet with or without 0.3% 3-oxoLCA (w/w) during the experiment.
Bone Marrow Transfer
Bone marrow cells were isolated from the femur and tibia of B6 (CD45.1) mice or of CNS3 knockout mice (CD45.2). Red blood cells were removed by using an ammonium-chloride-potassium lysing buffer. The two populations were mixed at a 1:1 ratio and a total of 1×10⁷ cells were transferred into each irradiated (1000 rad) CD45.1 mouse (5-weeks old) by retro-orbital injection. Sulfamethoxazole-trimethoprim (240 mg in 250 ml drinking water) was provided for 2 weeks after irradiation.
Adoptive Transfer Colitis
CD45RBhi adoptive transfer colitis was performed as described51. Briefly, isolated CD4+CD25−CD45RBhi naïve T cells were sorted from wild-type B6 (CD45.1) mice by FACS and 0.5 million cells were adoptively transferred into each Rag1-KO recipient mouse. In addition, the same number of in vitro cultured and sort-purified CD45.2+ FoxP3-GFP+ cells was transferred into the recipient mice. Naïve CD4 T cells, isolated from CD45.2 FoxP3-IRES-GFP mice, were cultured under TGF-β-lo (0.05 ng/ml TGF-β), isoalloLCA (20 µM isoalloLCA and 0.01 ng/ml TGF-β) or TGF-β-hi (1 ng/ml TGF-β) conditions. Mice were then monitored and weighed each week. At week 8, colon tissues were harvested, and lamina propria lymphocytes were analyzed by flow cytometry. H&E staining and disease scoring were performed by the Rodent Histopathology Core at Harvard Medical School.
Isolation of Fecal Bacterial Microbiota and 16S rRNA Gene Sequencing Analysis
Mouse fecal microbiota DNA was isolated by using QIAamp Fast DNA Stool Mini Kit (QIAGEN) according to the manufacturer’s instructions. The samples were quantified using an Agilent 4200 Tapestation instrument, with corresponding Agilent Genomic DNA ScreenTape assays. The samples were then normalized to 12.5 ng of input in 2.5 µL (5 ng/µL), and amplified using IDT primers specific to the V3 and V4 region: Forward 5’-TCGTCGGCAGCGTCAGATGTGTATAAGAGACAGCCTACGGGNGGCWGCAG-3’ Reverse 5’- GTCTCGTGGGCTCGGAGATGTGTATAAGAGACAGGACTACHVGGGTATCTAATCC-3’. The amplification was done using the KAPA HiFi HotStart Ready Mix (2×) (Roche Sequencing Solutions). Residual primers were eluted away using Aline PCRCLean DX beads in a 0.8x SPRI-based cleanup. The purified amplicons were then ligated with indexing adapters using Illumina’s Nextera XT Index Primers. Following this step, a final cleanup was performed using Aline PCRClean DX beads. The resulting purified libraries were run on an Agilent 4200 Tapestation instrument, with a corresponding Agilent High Sensitivity D1000 ScreenTape assay to visualize the libraries and check that the size of the library matched the expected ~630bp product. Concentrations obtained from this assay were used to normalize all samples in equimolar ratio. The pool was denatured and loaded onto an Illumina MiSeq instrument, with an Illumina MiSeq V3 600-cycle kit to obtain Paired-End 300bp reads. The pool was loaded at 10.5pM, with 50% PhiX spiked in to compensate for low base-diversity. The basecall files were demultiplexed through the BioPolymer Facility’s pipeline, and the resulting FASTQ files were used in subsequent analysis. Raw fastq sequences were then quality-filtered and analyzed by following QIIME2 version 2018.11 and DADA2 1.6.0 52–54 Operational Taxonomic Units (OTUs) were picked with 97% sequence similarity. The phylogenetic affiliation of each OTU was aligned to the Greengenes reference database version 13_8 and 99% ID.
Data and Software Availability
16S rDNA datasets are available through NCBI under accession number PRJNA528994.
Statistical Analyses
Statistical analysis tests were performed with Prism V8.0.2 (GraphPad).
Extended Data
Extended Data Figure 1. Chemical structures of bile acid derivatives used for T cell differentiation assay.
Extended Data Figure 2. 3-oxoLCA and isoalloLCA affect Th17 and Treg differentiation.
a and b, Gating strategy for the flow cytometric analyses of in vitro cultured T cells (a) and in vivo derived cells from the lamina propria (b). c, Schematic of the screening procedure. d and e, Naïve CD4+ T cells isolated from B6 mice (n = 2) were cultured under Th17 (IL-6 = 10 ng/ml; TGF-β = 0.5 ng/ml) (d) and Treg (IL-2 = 100 U/ml; TGF-β = 0.1 ng/ml) (e) polarization conditions for 3 days. DMSO or various bile acids at 20 μM concentration were added to the cell cultures on day 1. n, number of biologically independent samples. Data are shown as the mean.
Extended Data Figure 3. isoalloLCA-induced Treg expansion requires TGF-β.
a-c, Flow cytometry and histogram of CD4+ T cells, cultured for 3 days with different amounts of TGF-β (1, 0.1, 0.01 or 0 ng/ml) and IL-2 (100 U/ml) in the presence of DMSO or isoalloLCA (20 μM) and intracellularly stained for FoxP3 (n = 3/group). d and e, Flow cytometry of CD4+ T cells, cultured for 3 days in the presence of DMSO, isoalloLCA (20 μM) or TGF-β (0.05 ng/ml). In addition, anti-TGF-β antibody (10 μg/ml, 1D11) or isotype control were added to the culture (n = 3/group). f–h, 3-oxoLCA and isoalloLCA do not affect key transcription factor expression. T cells were cultured under Th0, Th1, Th2 or Th17 conditions, in the presence of DMSO, 3-oxoLCA (20 μM) or isoalloLCA (20 μM). T cell lineage determining transcription factors such as T-bet, GATA3 or RORγt were intracellularly stained (n = 3/group). MFI denotes mean fluorescence intensity. n, number of biologically independent samples. Data are shown as the mean ± standard deviation by unpaired t-test with 2-tailed p-value.
Extended Data Figure 4. Effects of isoalloLCA on FoxP3 expression require strong TCR stimulation.
a, 3-oxoLCA and isoalloLCA demonstrate dose-dependent effects on Th17 cell and Treg differentiation, respectively (n = 2). A low concentration of TGF-β (0.01 ng/ml) was used for Treg culture. b–d, 3-oxoLCA and isoalloLCA do not significantly affect cell proliferation, cell viability, or T cell activation. b, Naïve CD4+ T cells were labeled with a cell proliferation dye CFSE and cultured for 3 days in the presence of DMSO, 3-oxoLCA or isoalloLCA under Th17 or Treg polarization conditions. c, Live cell percentages at the end of the 3-day culture were determined based on both Annexin V and fixable live/dead staining (n = 3/group). d, Both DMSO and isoalloLCA treatment lead to comparable levels of expression of CD25, CD69, Nur77 and CD44. Naïve CD4+ T cells were used as a negative control. e and f, T cells were cultured with different concentrations of anti-CD3 antibody, in the presence of DMSO or isoalloLCA (20 μM). Representative FACS plots of CD4+ T cells cultured for 3 days and stained intracellularly for FoxP3 (e). Quantification of FoxP3+ and viable T cells after 3-day culture (f) (n = 2/group). n, number of biologically independent samples. Data are representative of two independent experiments (b, d). Data in (c) are shown as the mean ± standard deviation.
Extended Data Figure 5. cRel, VDR and FXR are dispensable for isoalloLCA-dependent induction of FoxP3.
a and b, In vitro suppression assay. CD4+ effector T cells were labeled with CFSE and mixed with DMSO- or isoalloLCA-treated Treg cells at different ratios of Tconv: Tester cells (n = 2/group). c, Expression of GFP in DMSO- or isoalloLCA-treated T cells cultured with anti-CD3/28, IL-2 and TGF-β (0.01 ng/ml). Naïve CD4+ T cells were isolated from FoxP3-IRES-GFP mice. d, Flow cytometry of CD4+ T cells stained intracellularly for FoxP3. Naïve CD4+ T cells isolated from WT, CNS1, CNS2 or CNS3 knockout mice (n = 3/group) were cultured with anti-CD3/28 and IL-2, LCA (20 μM), TGF-β (0.05 ng/ml) and additional retinoic acid (RA; 1 ng/ml). e and f, Flow cytometry (e) and its quantification (f) of CD4+ T cells stained intracellularly for FoxP3. Naïve CD4+ T cells were isolated from WT control mice or cRel-KO mice (n = 4/group) and cultured with anti-CD3/28 and IL-2 in the presence of DMSO, isoalloLCA (20 μM) or LCA (20 μM). g and h, Naïve CD4+ T cells isolated from WT control, VDR knockout or FXR knockout (n = mice/group) were cultured with anti-CD3/28 and IL-2 (g) or anti-CD3/28, IL-6 and TGF-β (h) for 3 days in the presence of DMSO, isoalloLCA (20 μM), or 3-oxoLCA (20 μM). Representative FACS plots of T cells intracellularly stained for FoxP3 or IL-17a. i, Chemical structures of glycine conjugated 3-oxoLCA (glyco-3-oxoLCA) and isoalloLCA (glyco-isoalloLCA). j and k, Quantifications of Th17 (j) and Treg (k) differentiation in vitro. T cells were cultured with anti-CD3/28, IL-6 and TGF-β (j) or anti-CD3/28 and IL-2 (k) in the presence of DMSO, 3-oxoLCA (20 μM), glyco-3-oxoLCA (20 μM), isoalloLCA (5 or 20 μM) or glyco-isoalloLCA (5, 10, or 20 μM). Glyco-isoalloLCA exhibited enhanced cytotoxicity at 10 or 20 μM compared to isoalloLCA (n = 3/group). n, number of biologically independent samples. Data are representative of two independent experiments (c, d). Data are shown as the mean ± standard deviation by unpaired t-test with 2-tailed p-value.
Extended Data Figure 6. IsoalloLCA-dependent FoxP3 transcription requires mitochondrial ROS and H3K27Ac.
a–c, ChIP analysis of H3K27Ac, P300 and H3K4me1 on FoxP3 gene locus. Chromatin obtained from DMSO- and isoalloLCA-treated WT cells was immunoprecipitated with IgG, anti-H3K27Ac, anti-P300, or anti-H3K4me1 antibodies, followed by real-time PCR analysis (n = 3/group). Primers targeting FoxP3 promoter (Pro), CNS1, CNS2 and CNS3 region and hsp90 promoter were used for qPCR quantification. Relative enrichment was calculated as fold change relative to the ChIP signal at the FoxP3 promoter of the DMSO-treated control. d and e, Flow cytometry and quantification of CD4+ T cells stained intracellularly for FoxP3. Naïve CD4+ T cells isolated from WT mice (n = 2/group) were cultured with anti-CD3/28, IL-2 and TGF-β (0.05 ng/mL) in the presence of DMSO or isoalloLCA (20 μM) in the presence or absence of iBET. f, ChIP analysis of H3K27Ac on the FoxP3 promoter region. Naïve CD4+ T cells isolated from WT or CNS3 knockout mice (n = 3/group) were treated with DMSO or isoalloLCA (20 μM). g, Seahorse analysis of OCR with naïve CD4+ T cells isolated from WT or CNS3 knockout mice cultured with anti-CD3/28 and IL-2 for 48h, in the presence of DMSO or isoalloLCA (20 μM). Measurements from six wells from two mice for each genotype. h–k, T cells were cultured with DMSO, LCA, isoLCA, alloLCA, isoalloLCA or 3-oxoLCA at 20 μM for 48h. Their mitochondrial and cytoplasmic ROS were measured by mitoSOX (h) and 2’,7’-dichlorofluorescein diacetate (DCFDA) (i), respectively. Total mitochondria mass was measured by MitoTracker (j) and the mitochondrial membrane potential measured by JC-1 dye (k). MFIs of different treatments were normalized as fold changes to those of DMSO control (n = 3/group). l, Mitochondria ROS production measured by mitoSOX with T cells cultured with DMSO, isoalloLCA (20 μM), retinoic acid (RA, 1 nM), or isoalloLCA (20 μM) + mitoQ (0.5 μM) for 48h. m, ChIP analysis (n = 3/group) of H3K27Ac on the FoxP3 promoter of T cells, treated with DMSO, isoalloLCA, isoalloLCA+mitoQ, or isoalloLCA+anti-TGF-β for 72 h. n–q, Mitochondrial ROS production measured by mitoSOX with T cells cultured with different concentrations of anti-CD3 and treated with DMSO, isoalloLCA (20 μM), TGF-β (0.05 ng/ml), or isoalloLCA plus TGF-β (n = 2/group) (n); or with T cells treated with DMSO or isoalloLCA (20 μM) plus an isotype control or anti-TGF-β antibody (n = 4/group) (o); or with T cells cultured under Th1, Th2, Th17 or Treg conditions (n = 3/group) (p); or with naïve CD4+ T cells isolated from WT or CNS3 knockout mice and cultured with anti-CD3/28 and IL-2 (n = 3/group) (q). r, Mitochondria ROS production measured by mitoSOX with T cells cultured with DMSO or mitoPQ (5 μM) for 48h. s, Dose-dependent effects of mitoPQ on Treg differentiation (n = 3). t, Quantification of Treg differentiation in vitro on naïve CD4+ T cells cultured in the presence of DMSO or mitoPQ (5 µM) and treated with isotype control or anti-TGF-β antibody (n = 3/group). u, A model showing the mechanism of isoalloLCA enhancement of Treg differentiation. n, number of biologically independent samples. Data are representative of two independent experiments (l, r) and shown as the mean ± standard deviation by unpaired t-test with 2-tailed p-value.
Extended Data Figure 7. 3-oxoLCA inhibits the differentiation of Th17 cells but not Tregs, and isoalloLCA alone does not enhance Treg differentiation in vivo.
a, UPLC/MS spectra of LCA and its isomers isoalloLCA, alloLCA, and isoLCA as well as 3-oxoLCA. b, Quantification of unconjugated LCA and its derivatives in the cecal contents of B6 mice fed on a control or bile acid-containing diet (n = 7/5/4 mice for Ctrl/3-oxoLCA/3-oxoLCA+isoalloLCA). c, Quantification of unconjugated 3-oxoLCA and isoalloLCA in human stool samples from patients with ulcerative colitis (n = 16 donors). d, Quantification of unconjugated 3-oxoLCA, isoalloLCA and LCA in mouse cecal contents from germ-free (GF) or conventionally housed (CNV) mice (n = 15 mice/group). e, B6 Jax mice gavaged with SFB. SFB colonization measured by qPCR analysis calculated as copy number (n = 5 mice/group). f, Diagram showing experimental design. B6 Taconic mice were fed a 3-oxoLCA (0.3%) containing diet for 7 days. g, SFB colonization measured by qPCR analysis calculated as SFB copy number (n = 5 mice/group). h and i, Flow cytometric analysis and quantification of Th17 (h) and Treg (i) cells of the ileal lamina propria (n = 7 mice/group). j–l, Experimental scheme of anti-CD3 experiment with 3-oxoLCA (j). Flow cytometric analysis and quantification of CD4+ cells of the lamina propria following an anti-CD3 injection from B6 mice fed with control or 3-oxoLCA (0.3%) diet (n = 9 mice/group) (k), or 3-oxoLCA (1%) diet (n = 7 mice/group) (l). m and n, Flow cytometric analysis and quantification of CD4+ cells of the ileal lamina propria in steady-state (m) (n = 6 mice/group) or following an anti-CD3 injection (n) (n = 5 mice/group). B6 mice were fed with control or isoalloLCA (0.03%) diet. o and p, Flow cytometry (o) and quantification (p) of CD4+ T cells stained intracellularly for FoxP3 showing that the combination of 3-oxoLCA and isoalloLCA further increases Treg cell differentiation. Naïve CD4+ T cells isolated from WT B6 mice (n = 3 biologically independent samples) treated with DMSO, isoalloLCA (20 µM), a mixture of 3-oxoLCA (20 µM) and isoalloLCA (20 µM), or a mixture of 3-oxoCA (20 µM) and isoalloLCA (20 µM) and cultured with anti-CD3/28 and IL-2, with or without addition of IL-6 (62.5 pg/ml). q, mitoROS production in total CD4+ T cells isolated from the ileal lamina propria. Mice were fed a control diet or diet containing a mixture of 3-oxoLCA (0.3%) + isoalloLCA (0.03%) (n = 9, 10 mice) and injected with 10 µg of anti-CD3 to induce inflammation. Data are shown as the mean ± standard deviation by unpaired t-test with 2-tailed p-value.
Extended Data Figure 8. 3-oxoLCA or isoalloLCA does not significantly alter gut microbiota.
a, Box plot showing operational taxonomic unit (OTU) numbers. b, Shannon diversity of fecal microbiota based on 16S rRNA gene amplicon sequencing. For the box plots (a, b), the three horizontal lines of the box represent the third quartile, median and first quartile, respectively from top to bottom. The whiskers above and below the box show the maximum and minimum. c, Principal coordinates analysis (PCoA) based on weighted UniFrac distances of 16S rRNA amplicon sequencing of fecal microbiota. d and e, Average relative abundance of microbiota at the phylum (d) and the family (e) levels by taxon-based analyses (n = 4, 5, 5 mice for Ctrl, 3-oxoLCA, isoalloLCA group). f and g, Experimental scheme (f) and flow cytometric analysis and quantification (g) of CD4+ cells of the colon lamina propria in germ-free B6 mice, infected with Citrobacter rodentium. Mice were fed an autoclaved diet with or without 3-oxoLCA (0.3%) (n = 9 mice/group). Data are shown as the mean ± standard deviation by unpaired t-test with 2-tailed p-value.
Extended Data Figure 9. IsoalloLCA-induced Treg cells suppress transfer colitis.
a, Experimental scheme. Rag1−/− recipient mice were transferred intraperitoneally with 0.5 million CD45RBhi naïve CD4+ T cells (CD45.1) and with or without co-transfer of 0.5 million FoxP3-GFP+ Treg cells (CD45.2). FoxP3-GFP+ cells were cultured under TGF-β-lo (0.05 ng/ml), isoalloLCA (20 µM, 0.01 ng/ml TGF-β) and TGF-β-hi (1 ng/ml) conditions with GFP− naïve CD4 T cells, isolated from CD45.2 FoxP3-IRES-GFP mice. b, Flow cytometric analysis of the FoxP3-GFP+ cells following in vitro culture. The gated cells were sorted and used for co-transfer. c-f, Weight change monitored for eight weeks, week 7 values are used for unpaired t-test with two-tailed p-value (c) (n = 5 mice/group). At the end of the experiment, colon length (d) (n = 10 mice/group), H&E staining (e) and the quantification of disease score (f) (n = 5 mice for None, 4 mice for other groups). g–j, Flow cytometric analysis and quantification of the frequency of CD45.1 and CD45.2 (g, i) and the frequency of FoxP3+ cells in the CD45.2 population (h, j) in each condition (n = 5 mice/group). k, Quantification of total CD45.1 cell number in the colon lamina propria (n = 5 mice/group). Data are shown as the mean ± standard deviation by unpaired t-test with 2-tailed p-value.
Extended Data Table 1. Lipophilicity of bile acids.
| bile acid | abbreviation | log D (pH = 8.0) | reference |
|---|---|---|---|
| lithocholic acid | LCA | 3.6 | This study |
| isolithocholic acid | isoLCA | 3.5 | This study |
| allolithocholic acid | alloLCA | 3.5 | This study |
| isoallolithocholic acid | isoalloLCA | 2.2 | This study |
| 3-oxolithocholic acid | 3-oxoLCA | 2.4 | This study |
| deoxycholic acid | DCA | 2.7 | 49 |
| chenodeoxycholic acid | CDCA | 2.2 | 49,50 |
| ursodeoxycholic acid | UDCA | 2.2 | 49,50 |
| obeticholic acid | OCA | 2.5 | 50 |
| cholic acid | CA | 1.1 | 49,50 |
Supplementary Material
Acknowledgements
We thank Nicole Lee and Kimie Hattori for technical assistance. We thank Melanie Trombly for critical reading of the manuscript. We thank Drs. Alexander Rudensky and Stephen Smale for sharing FoxP3-CNS and cRel knockout mice. We thank Roderick Bronson and the Rodent Histopathology Core at Harvard Medical School for performing H&E analysis and disease score. We also thank the BPF Next-Gen Sequencing Core at Harvard Medical School for their expertise and instrument availability with microbiota sequencing. This study was supported by a Charles A. King Trust Fellowship to S.H., Harvard Medical School Dean’s Innovation Grant in the Basic and Social Sciences to A.S.D and J.R.H., the Howard Hughes Medical Institute to D.R.L. and a National Institutes of Health grant R01 DK110559 to J.R.H.
Footnotes
Conflict of Interest
A.S.D is an ad hoc consultant for Kintai Therapeutics. D.R.L. is a scientific co-founder of Vedanta Biosciences.
References
- 1.Shapiro H, Kolodziejczyk AA, Halstuch D & Elinav E Bile acids in glucose metabolism in health and disease. J Exp Med 215, 383–396, doi: 10.1084/jem.20171965 (2018). [DOI] [PMC free article] [PubMed] [Google Scholar]
- 2.Ridlon JM, Kang DJ & Hylemon PB Bile salt biotransformations by human intestinal bacteria. J Lipid Res 47, 241–259, doi: 10.1194/jlr.R500013-JLR200 (2006). [DOI] [PubMed] [Google Scholar]
- 3.Devlin AS & Fischbach MA A biosynthetic pathway for a prominent class of microbiota-derived bile acids. Nat Chem Biol 11, 685–690, doi: 10.1038/nchembio.1864 (2015). [DOI] [PMC free article] [PubMed] [Google Scholar]
- 4.Hamilton JP et al. Human cecal bile acids: concentration and spectrum. Am J Physiol Gastrointest Liver Physiol 293, G256–263, doi: 10.1152/ajpgi.00027.2007 (2007). [DOI] [PubMed] [Google Scholar]
- 5.Bernstein H, Bernstein C, Payne CM & Dvorak K Bile acids as endogenous etiologic agents in gastrointestinal cancer. World J Gastroenterol 15, 3329–3340 (2009). [DOI] [PMC free article] [PubMed] [Google Scholar]
- 6.Barrasa JI, Olmo N, Lizarbe MA & Turnay J Bile acids in the colon, from healthy to cytotoxic molecules. Toxicol In Vitro 27, 964–977, doi: 10.1016/j.tiv.2012.12.020 (2013). [DOI] [PubMed] [Google Scholar]
- 7.Buffie CG et al. Precision microbiome reconstitution restores bile acid mediated resistance to Clostridium difficile. Nature 517, 205–208, doi: 10.1038/nature13828 (2015). [DOI] [PMC free article] [PubMed] [Google Scholar]
- 8.Duboc H et al. Connecting dysbiosis, bile-acid dysmetabolism and gut inflammation in inflammatory bowel diseases. Gut 62, 531–539, doi: 10.1136/gutjnl-2012-302578 (2013). [DOI] [PubMed] [Google Scholar]
- 9.Martinez-Moya P et al. Dose-dependent antiinflammatory effect of ursodeoxycholic acid in experimental colitis. Int Immunopharmacol 15, 372–380, doi: 10.1016/j.intimp.2012.11.017 (2013). [DOI] [PubMed] [Google Scholar]
- 10.Schaap FG, Trauner M & Jansen PL Bile acid receptors as targets for drug development. Nat Rev Gastroenterol Hepatol 11, 55–67, doi: 10.1038/nrgastro.2013.151 (2014). [DOI] [PubMed] [Google Scholar]
- 11.Guo C et al. Bile Acids Control Inflammation and Metabolic Disorder through Inhibition of NLRP3 Inflammasome. Immunity 45, 944, doi: 10.1016/j.immuni.2016.10.009 (2016). [DOI] [PubMed] [Google Scholar]
- 12.Ma C et al. Gut microbiome-mediated bile acid metabolism regulates liver cancer via NKT cells. Science 360, doi: 10.1126/science.aan5931 (2018). [DOI] [PMC free article] [PubMed] [Google Scholar]
- 13.Cao W et al. The Xenobiotic Transporter Mdr1 Enforces T Cell Homeostasis in the Presence of Intestinal Bile Acids. Immunity 47, 1182–1196 e1110, doi: 10.1016/j.immuni.2017.11.012 (2017). [DOI] [PMC free article] [PubMed] [Google Scholar]
- 14.Huh JR et al. Digoxin and its derivatives suppress TH17 cell differentiation by antagonizing RORgammat activity. Nature 472, 486–490, doi: 10.1038/nature09978 (2011). [DOI] [PMC free article] [PubMed] [Google Scholar]
- 15.Jin L et al. Structural basis for hydroxycholesterols as natural ligands of orphan nuclear receptor RORgamma. Mol Endocrinol 24, 923–929, doi: 10.1210/me.2009-0507 (2010). [DOI] [PMC free article] [PubMed] [Google Scholar]
- 16.Santori FR et al. Identification of natural RORgamma ligands that regulate the development of lymphoid cells. Cell Metab 21, 286–297, doi: 10.1016/j.cmet.2015.01.004 (2015). [DOI] [PMC free article] [PubMed] [Google Scholar]
- 17.Soroosh P et al. Oxysterols are agonist ligands of RORgammat and drive Th17 cell differentiation. Proc Natl Acad Sci U S A 111, 12163–12168, doi: 10.1073/pnas.1322807111 (2014). [DOI] [PMC free article] [PubMed] [Google Scholar]
- 18.Esplugues E et al. Control of TH17 cells occurs in the small intestine. Nature 475, 514–518, doi: 10.1038/nature10228 (2011). [DOI] [PMC free article] [PubMed] [Google Scholar]
- 19.Huh JR & Littman DR Small molecule inhibitors of RORgammat: targeting Th17 cells and other applications. Eur J Immunol 42, 2232–2237, doi: 10.1002/eji.201242740 (2012). [DOI] [PMC free article] [PubMed] [Google Scholar]
- 20.Feng Y et al. Control of the inheritance of regulatory T cell identity by a cis element in the Foxp3 locus. Cell 158, 749–763, doi: 10.1016/j.cell.2014.07.031 (2014). [DOI] [PMC free article] [PubMed] [Google Scholar]
- 21.Feng Y et al. A mechanism for expansion of regulatory T-cell repertoire and its role in self-tolerance. Nature 528, 132–136, doi: 10.1038/nature16141 (2015). [DOI] [PMC free article] [PubMed] [Google Scholar]
- 22.Zheng Y et al. Role of conserved non-coding DNA elements in the Foxp3 gene in regulatory T-cell fate. Nature 463, 808–812, doi: 10.1038/nature08750 (2010). [DOI] [PMC free article] [PubMed] [Google Scholar]
- 23.Arpaia N et al. Metabolites produced by commensal bacteria promote peripheral regulatory T-cell generation. Nature 504, 451–455, doi: 10.1038/nature12726 (2013). [DOI] [PMC free article] [PubMed] [Google Scholar]
- 24.Josefowicz SZ et al. Extrathymically generated regulatory T cells control mucosal TH2 inflammation. Nature 482, 395–399, doi: 10.1038/nature10772 (2012). [DOI] [PMC free article] [PubMed] [Google Scholar]
- 25.Schlenner SM, Weigmann B, Ruan Q, Chen Y & von Boehmer H Smad3 binding to the foxp3 enhancer is dispensable for the development of regulatory T cells with the exception of the gut. J Exp Med 209, 1529–1535, doi: 10.1084/jem.20112646 (2012). [DOI] [PMC free article] [PubMed] [Google Scholar]
- 26.Makishima M et al. Vitamin D receptor as an intestinal bile acid sensor. Science 296, 1313–1316, doi: 10.1126/science.1070477 (2002). [DOI] [PubMed] [Google Scholar]
- 27.Yu J et al. Lithocholic acid decreases expression of bile salt export pump through farnesoid X receptor antagonist activity. J Biol Chem 277, 31441–31447, doi: 10.1074/jbc.M200474200 (2002). [DOI] [PubMed] [Google Scholar]
- 28.Nanduri R et al. The Active Form of Vitamin D Transcriptionally Represses Smad7 Signaling and Activates Extracellular Signal-regulated Kinase (ERK) to Inhibit the Differentiation of a Inflammatory T Helper Cell Subset and Suppress Experimental Autoimmune Encephalomyelitis. J Biol Chem 290, 12222–12236, doi: 10.1074/jbc.M114.621839 (2015). [DOI] [PMC free article] [PubMed] [Google Scholar]
- 29.Jeffery LE et al. 1,25-Dihydroxyvitamin D3 and IL-2 combine to inhibit T cell production of inflammatory cytokines and promote development of regulatory T cells expressing CTLA-4 and FoxP3. Journal of immunology 183, 5458–5467, doi: 10.4049/jimmunol.0803217 (2009). [DOI] [PMC free article] [PubMed] [Google Scholar]
- 30.Gorman S et al. Topically applied 1,25-dihydroxyvitamin D3 enhances the suppressive activity of CD4+CD25+ cells in the draining lymph nodes. Journal of immunology 179, 6273–6283 (2007). [DOI] [PubMed] [Google Scholar]
- 31.Kang SW et al. 1,25-Dihyroxyvitamin D3 promotes FOXP3 expression via binding to vitamin D response elements in its conserved noncoding sequence region. Journal of immunology 188, 5276–5282, doi: 10.4049/jimmunol.1101211 (2012). [DOI] [PMC free article] [PubMed] [Google Scholar]
- 32.Etchegaray JP & Mostoslavsky R Interplay between Metabolism and Epigenetics: A Nuclear Adaptation to Environmental Changes. Mol Cell 62, 695–711, doi: 10.1016/j.molcel.2016.05.029 (2016). [DOI] [PMC free article] [PubMed] [Google Scholar]
- 33.Gerriets VA & Rathmell JC Metabolic pathways in T cell fate and function. Trends Immunol 33, 168–173, doi: 10.1016/j.it.2012.01.010 (2012). [DOI] [PMC free article] [PubMed] [Google Scholar]
- 34.Buck MD, O’Sullivan D & Pearce EL T cell metabolism drives immunity. J Exp Med 212, 1345–1360, doi: 10.1084/jem.20151159 (2015). [DOI] [PMC free article] [PubMed] [Google Scholar]
- 35.Gerriets VA et al. Metabolic programming and PDHK1 control CD4+ T cell subsets and inflammation. The Journal of clinical investigation 125, 194–207, doi: 10.1172/JCI76012 (2015). [DOI] [PMC free article] [PubMed] [Google Scholar]
- 36.Xu T et al. Metabolic control of TH17 and induced Treg cell balance by an epigenetic mechanism. Nature 548, 228–233, doi: 10.1038/nature23475 (2017). [DOI] [PMC free article] [PubMed] [Google Scholar]
- 37.Zhang D et al. D-mannose induces regulatory T cells and suppresses immunopathology. Nat Med 23, 1036–1045, doi: 10.1038/nm.4375 (2017). [DOI] [PMC free article] [PubMed] [Google Scholar]
- 38.Sena LA et al. Mitochondria are required for antigen-specific T cell activation through reactive oxygen species signaling. Immunity 38, 225–236, doi: 10.1016/j.immuni.2012.10.020 (2013). [DOI] [PMC free article] [PubMed] [Google Scholar]
- 39.Angelin A et al. Foxp3 Reprograms T Cell Metabolism to Function in Low-Glucose, High-Lactate Environments. Cell Metab 25, 1282–1293 e1287, doi: 10.1016/j.cmet.2016.12.018 (2017). [DOI] [PMC free article] [PubMed] [Google Scholar]
- 40.Robb EL et al. Selective superoxide generation within mitochondria by the targeted redox cycler MitoParaquat. Free Radic Biol Med 89, 883–894, doi: 10.1016/j.freeradbiomed.2015.08.021 (2015). [DOI] [PubMed] [Google Scholar]
- 41.Ivanov II et al. Induction of intestinal Th17 cells by segmented filamentous bacteria. Cell 139, 485–498, doi: 10.1016/j.cell.2009.09.033 (2009). [DOI] [PMC free article] [PubMed] [Google Scholar]
- 42.Gagliani N et al. Th17 cells transdifferentiate into regulatory T cells during resolution of inflammation. Nature 523, 221–225, doi: 10.1038/nature14452 (2015). [DOI] [PMC free article] [PubMed] [Google Scholar]
- 43.Trauner M, Meier PJ & Boyer JL Molecular pathogenesis of cholestasis. N Engl J Med 339, 1217–1227, doi: 10.1056/NEJM199810223391707 (1998). [DOI] [PubMed] [Google Scholar]
- 44.Vavassori P, Mencarelli A, Renga B, Distrutti E & Fiorucci S The bile acid receptor FXR is a modulator of intestinal innate immunity. Journal of immunology 183, 6251–6261, doi: 10.4049/jimmunol.0803978 (2009). [DOI] [PubMed] [Google Scholar]
- 45.Pols TW et al. TGR5 activation inhibits atherosclerosis by reducing macrophage inflammation and lipid loading. Cell Metab 14, 747–757, doi: 10.1016/j.cmet.2011.11.006 (2011). [DOI] [PMC free article] [PubMed] [Google Scholar]
- 46.Kakiyama G et al. A simple and accurate HPLC method for fecal bile acid profile in healthy and cirrhotic subjects: validation by GC-MS and LC-MS. Journal of lipid research 55, 978–990, doi: 10.1194/jlr.D047506 (2014). [DOI] [PMC free article] [PubMed] [Google Scholar]
- 47.Sakai K, Makino T, Kawai Y & Mutai M Intestinal microflora and bile acids. Effect of bile acids on the distribution of microflora and bile acid in the digestive tract of the rat. Microbiol Immunol 24, 187–196 (1980). [DOI] [PubMed] [Google Scholar]
- 48.Robben J, Caenepeel P, Van Eldere J & Eyssen H Effects of intestinal microbial bile salt sulfatase activity on bile salt kinetics in gnotobiotic rats. Gastroenterology 94, 494–502 (1988). [DOI] [PubMed] [Google Scholar]
- 49.Yao L et al. A selective gut bacterial bile salt hydrolase alters host metabolism. Elife 7, doi: 10.7554/eLife.37182 (2018). [DOI] [PMC free article] [PubMed] [Google Scholar]
- 50.van der Windt GJ, Chang CH & Pearce EL Measuring Bioenergetics in T Cells Using a Seahorse Extracellular Flux Analyzer. Curr Protoc Immunol 113, 3 16B 11–13 16B 14, doi: 10.1002/0471142735.im0316bs113 (2016). [DOI] [PMC free article] [PubMed] [Google Scholar]
- 51.Powrie F et al. Inhibition of Th1 responses prevents inflammatory bowel disease in scid mice reconstituted with CD45RBhi CD4+ T cells. Immunity 1, 553–562 (1994). [DOI] [PubMed] [Google Scholar]
- 52.Bokulich NA et al. Optimizing taxonomic classification of marker-gene amplicon sequences with QIIME 2’s q2-feature-classifier plugin. Microbiome 6, 90, doi: 10.1186/s40168-018-0470-z (2018). [DOI] [PMC free article] [PubMed] [Google Scholar]
- 53.Bolyen E et al. An Introduction to Applied Bioinformatics: a free, open, and interactive text. J Open Source Educ 1, doi: 10.21105/jose.00027 (2018). [DOI] [PMC free article] [PubMed] [Google Scholar]
- 54.Callahan BJ et al. DADA2: High-resolution sample inference from Illumina amplicon data. Nat Methods 13, 581–583, doi: 10.1038/nmeth.3869 (2016). [DOI] [PMC free article] [PubMed] [Google Scholar]
Associated Data
This section collects any data citations, data availability statements, or supplementary materials included in this article.
Supplementary Materials
Data Availability Statement
16S rDNA datasets are available through NCBI under accession number PRJNA528994.


