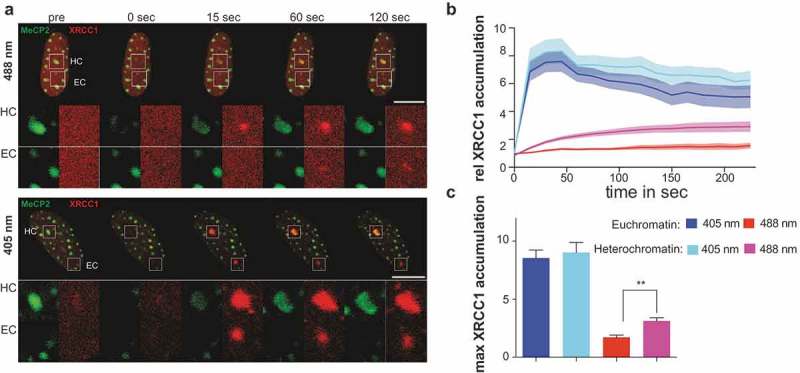
Figure 4.

XRCC1 recruitment inside dense constitutive heterochromatic regions.
(a) Live-cell imaging plus 488 or 405 nm laser microirradiation of XRCC1 expressing C2C12 cell. Heterochromatin (HC) was visualized by transfection with GFP-tagged MeCP2. Enlarged regions represent sites of irradiation either in heterochromatin (HC) or euchromatin (EC). Full time lapses are shown in Movies 3 and 4. (b) Dynamics of XRCC1 accumulation in C2C12 cells over time shown as mean value ± standard error as shaded region. Full time lapse is shown in Movie 4. (c) Calculation of mean maximal accumulation from curves in (b). Whiskers represent standard error. Statistical test was the Mann Whitney test p < 0.01 * n = between 12 and 19 cells per condition. Scale bars 10 microns.
