Abstract
High-sensitivity detection schemes are of great interest for a number of applications. Unfortunately, such schemes are usually high-cost. We demonstrate a low-cost approach to a high-sensitivity detection scheme based on surface plasmon-coupled emission (SPCE). The SPCE of a monomolecular layer of green fluorescent protein (GFP) is reported here. The protein was electrostatically attached to a thin, SiO2-protected silver film deposited on a quartz substrate. The visible, directional emission of GFP was observed at a sharp, well-defined angle of 47.5° from the normal to the coupling prism, and the spectrum corresponded to that of GFP. The SPCE resulting from the reverse Kretschmann configuration showed a 12-fold enhancement over the free space fluorescence. The directional emission was 97% p-polarized. The directionality and high polarization can be coupled with the intrinsic spectral resolution of SPCE to be used in the design miniaturized spectrofluorometers. The observation of SPCE in the visible region of the spectrum from a monolayer of protein opens up new possibilities in protein-based sensing.
Introduction
Fluorescence measurement is a critical tool for exploration in the life sciences. Fluorescence intensity, lifetime, spectrum and anisotropy are sources for abundant information about molecules, cells, cell populations and even whole organisms. The intrinsic fluorescence properties of biomolecules provide important information about their structure, mobility, and conformational changes through their fluorescence anisotropy decay properties (1, 2). The labeling of large biomolecules with fluorescent markers has become a method of choice in many host–guest studies [antibody–antigen interactions (3), DNA and RNA detection and sequencing (4), and protein studies (5)], as it allows for distinct visualization of the specific interaction practically without altering the molecule’s binding properties. As fluorescence is a manifestation of fundamental light–matter interactions, its applications outside the life sciences are also numerous. However, fluorescence measurement remains mainly a lab-oriented method, relying on high-end, sophisticated lab equipment.
One of the reasons for this is the isotropic nature of fluorescence. Regardless of how a fluorophore is excited, the emission travels in all directions. As a result, only approximately 1% of the total fluorescence emission is captured by the photodetector (6). Using additional optical components [mirrors, integrating spheres], this number can be increased; however, this is expensive and not always possible, especially in the case of the high-density DNA or protein arrays. As a result, the intensity of the detected fluorescence emission is hundreds [or more] times lower than the excitation light. When the quantum yield of the dye is accounted for, this ratio increases even further. This imposes the use of sophisticated and highly efficient wavelength-selection devices [monochromators, interference filters] for separation of the excitation and the fluorescence emission. Inevitably, the detectable emission intensity is also further reduced. In the case of fluorescence studies in solution, this light loss may be partially compensated by an increase in fluorophore concentration, but in the case of surface-bound probes [i.e., DNA chips] the only way to compensate for the low intensity is to increase the illumination intensity and/or by amplification of the electronic signal.
All of these problems could be significantly alleviated, if there was a simple method to simultaneously (a) enhance the collection efficiency of the fluorescence, (b) increase the excitation efficiency, and (c) simplify the separation of the excitation and the emission. This is readily achievable by exploitation of the phenomenon of surface plasmon-coupled emission [SPCE], which has recently reemerged in several experimental (7–12) and theoretical (13, 14) studies. An important feature of SPCE is that the enhancements can be achieved independently of each other, allowing unprecedented increases in fluorescence observation efficiency.
Surface plasmon-coupled emission is an effect strongly related to surface plasmon resonance (8). It occurs for excited fluorophores within about 200 nm of a thin continuous metallic surface, thus allowing for highly localized measurements to be made (9, 13). These metallic surfaces modify the photonic mode density [PMD] near the fluorophores to result in highly polarized directional emission either back into the substrate or into the sample media, depending on the optical system. The dipoles of the excited fluorophores directly couple with surface plasmons, which are electron oscillations on the metal surface. The surface plasmons then radiate into the glass substrate at a well-defined angle that satisfies the condition of resonance between the fluorophores and the plasmons. The high sensitivity of this angle with regards to sample thickness has been used in surface plasmon resonance analysis of bioaffinity reactions on surfaces (15–18) and in SPCE for bioassay studies (10, 11, 19, 20). However, to date, all of the SPCE studies, including those designed for genomic and proteomic applications (10, 21), have focused on the SPCE resulting from the excitation of organic fluorophores on thin metal films.
Here we report the SPCE of green fluorescent protein deposited as a monomolecular layer on silver-coated quartz slides. The fluorescence is visible to the naked eye and readily detectable with any low-cost photodetector. Additionally, the technique has the inherent capability for discrimination between the different wavelengths of the spectrum. The use of this technique can significantly simplify the use of DNA and/or protein chips by making detection of low concentrations of proteins facile.
Materials and Methods
Sample Preparation.
Glass microscopes slides [plain, Corning] were coated with a 50 nm thick layer of silver, followed by a 5 nm thick layer of SiO2 by vapor deposition by EMF Corp. [Ithaca, NY]. The layer of silica protects the silver surface and also acts as a spacer. Fifty microliters of a 0.5 mg/mL solution of green fluorescent protein was dropped onto the surface and spread to create a thin layer of solution. The slide was then placed in a sealed container at 4 °C for 10 min. Then the solution of GFP was removed by pipet from the surface, and the remaining wet spot was blown dry with air.
Reflectance Calculations.
The resulting equations from SPR theory can be used to determine the angular distribution associated with radiated light from SPCE due to the wavevector matching requirements that are the same for both SPR and SPCE. The equations necessary to develop the curves for thin films can be found in the literature (22, 23). An alternative to solving these equations by hand is to use web-based software that allows calculations for up to a four-phase system (24). The reflectance profiles presented here were calculated with TFCalc. 3.5 software [Software Spectra, Inc., Portland, OR].
Fluorescence Measurements.
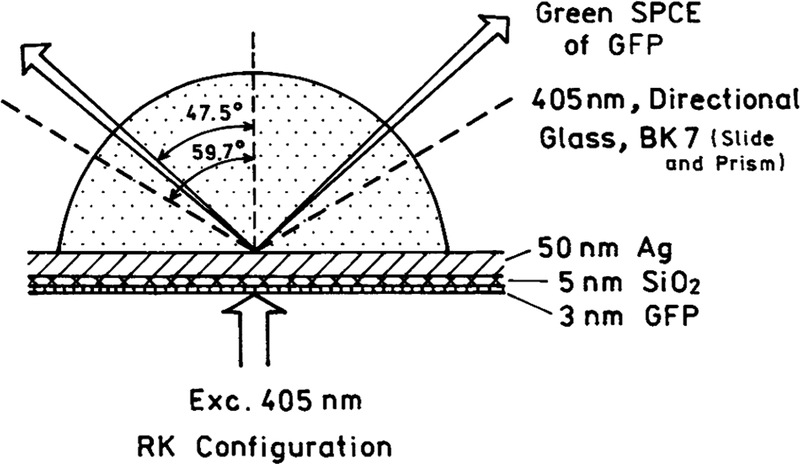
The GFP-coated slide was attached using nonfluorescent index matching fluid to a hemicylindrical prism made of BK7 glass as shown in Figure 1. The assembly was then placed on a rotary stage allowing excitation and observation at any angle relative to the vertical axis centered on the prism (9). Two modes of excitation, Kretschmann [KR] and reverse Kretschmann [RK], were used. The RK configuration is shown in Figure 1, where the sample is excited directly with the incident light. In this case, it is not possible to excite surface plasmons with the incident so that the angle of incidence is not important. The KR configuration excites the sample via the evanescent field created by the incident light exciting surface plasmons. This occurs at the appropriate SPR angle for the excitation light. Measurements presented here were obtained with the system in the RK configuration unless otherwise noted.
Figure 1.
Setup for GFP SPCE experiments. In the reverse Kretschmann (RK) configuration, a 405 nm beam excites directly the GFP sample deposited on a silvered slide. The green, p-polarized GFP SPCE exits the glass prism at an angle of 47.5°. The p-polarized directional 405 nm scattered light exits the glass prism at an angle of 59.7°. These two cones (blue and green) can be observed with the naked eye. In the Kretschmann (KR) configuration, a p-polarized 405 nm excitation beam creates surface plasmons on the silver propagating through the prism at an angle of 59.7°. The SPR evanescent field excites the GFP, whose SPCE exits the prism at 47.5°.
To excite the sample, a 405 nm 3 mW semiconductor laser diode [TE cooled module, Photonics Products] was used. The excitation was attenuated with neutral density filters. Emission was observed through a 480 LWP filter. Observations were performed using a 3 mm diameter fiber optic cable, covered with a 200 μm vertical slit and positioned 10 cm from the sample. This resulted in a 0.2° resolution. The output was sent to an 8000 SLM spectrofluorometer. The photograph of the SPCE of GFP was taken using a digital camera with the system in the RK configuration, where the slide was attached to a hemispherical prism attached to a conical mirror.
Results and Discussion
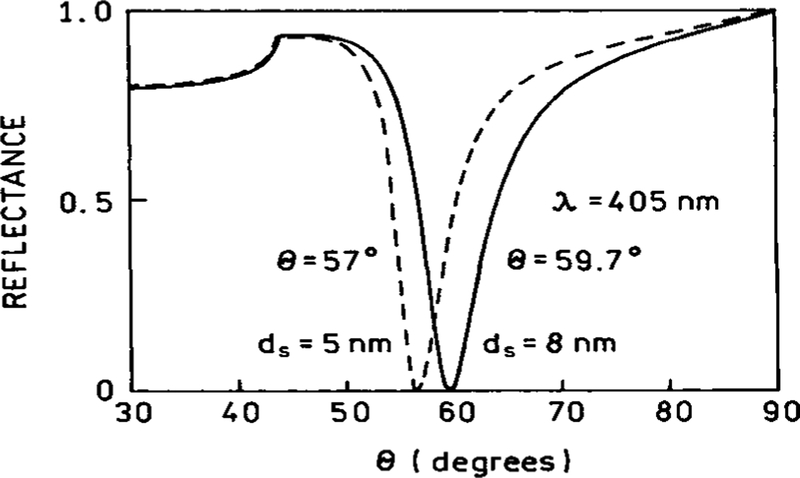
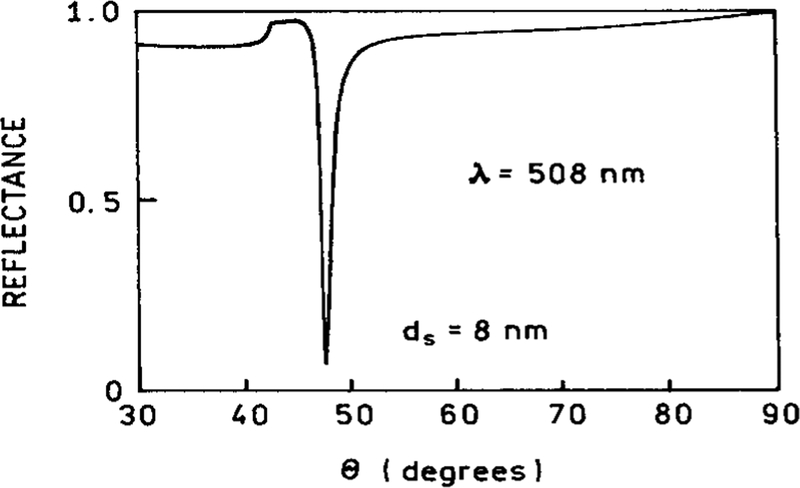
In our setup [Figure 1], the metallic layer was 50 nm thick silver on a glass substrate [np = 1.51]. To protect the silver from oxidation, an additional 5 nm SiO2 layer was deposited on the top of the slide. For such a three-layer system [GFP layer excluded], the minimum reflectance [SPR angle] appeared at 57°, which is consistent with the calculated value for a 405 nm directional scatter [Figure 2]. When a layer of GFP was deposited on the top of the system, the SPR angle for the excitation wavelength shifted to 59.7°. A reverse calculation of the thickness of the protein layer corresponding to this angle yielded 3 nm. The calculation was done for the four-layer system shown in Figure 1. Accounting that the dimensions of the GFP β-can are 4 nm × 3 nm (25), the results suggest that the observed effects are indeed from monomolecular layer of GFP, deposited randomly on the slide surface. This same system model was analyzed for the emission wavelength of GFP, 508 nm. The resulting reflectance profile shows a calculated minimum of reflectance of 47.5° [Figure 3].
Figure 2.
SPR angles calculated for slides with (–) and without (- - -) a GFP monolayer of 3 nm thickness.
Figure 3.
Reflectance profile calculated for the four-phase system shown in Figure 1 at the emission wavelength of 508 nm. The thickness of the GFP layer was assumed to be 3 nm.
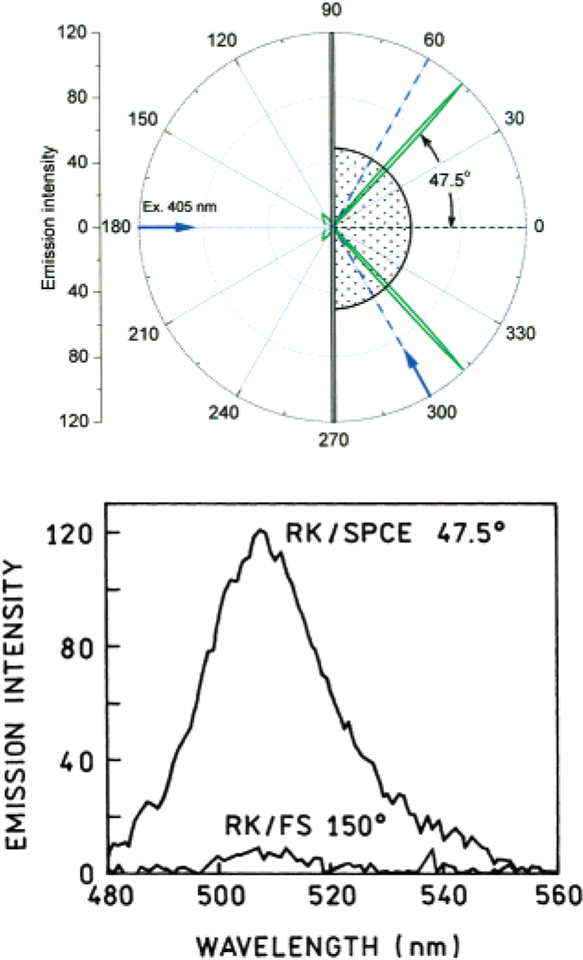
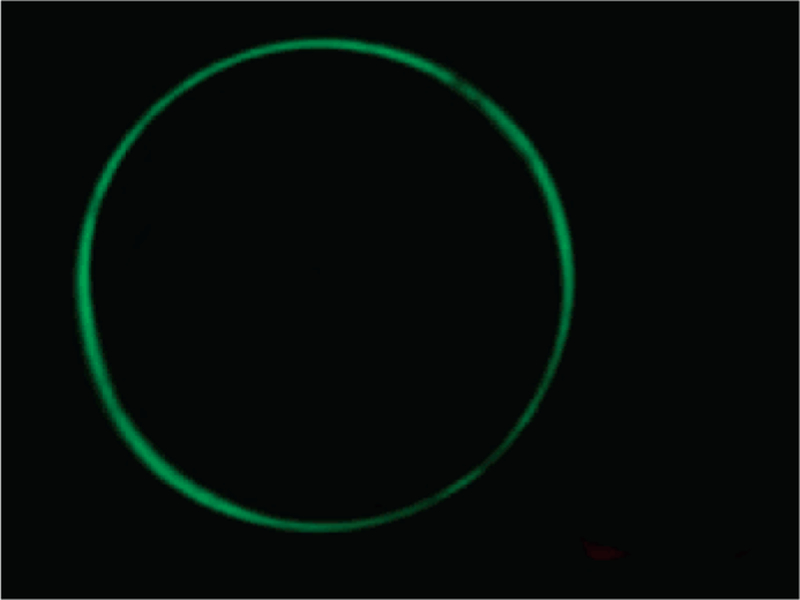
Next, the directionality of the SPCE of GFP was measured. Maximal emission was observed at an angle of 47.5° [Figure 4, top], corresponding to the calculated angle in Figure 3. The angular distribution of the SPCE of GFP is remarkably narrow: the emission is practically 100% confined within 2 arc deg, producing a hollow cone when coupled through a hemispherical prism. When directed by a conical mirror toward a screen, this light “compression” produced a green fluorescence ring visible with the naked eye [Figure 5], as observed through a 480 LWP filter.
Figure 4.
(Top) Angular distribution with the RK configuration. (Bottom) Emission spectra of GFP measured in the RK/SPCE and RK/FS (free space) configurations. The excitation was polarized vertically and the emission was observer through a horizontally oriented polarizer. RK/SPCE was highly p-polarized (IVH/IVV = 70), giving 97% polarization.
Figure 5.
Green cone of the SPCE of GFP as observed with the naked eye through a 480 LWP filter.
The spectrum of the observed SPCE emission matched that of GFP [Figure 4, bottom], confirming that the plasmon coupling did not distort the spectrum in any way. Also, the free space [FS] emission from the GFP layer, due to direct excitation of the protein, was measured. A comparison of the signal intensities of the SPCE and FS emission is shown in the bottom of Figure 4. The intensity gains resulting from SPCE are approximately 12-fold. The coupling efficiency created by the SPCE was determined to be 59% of the GFP fluorescence, which is calculated by dividing the total intensity of the SPCE by the total fluorescence intensity from the sample (I90°–0°–270°/Itotal). The angles correspond to the ones depicted in the top of Figure 4.
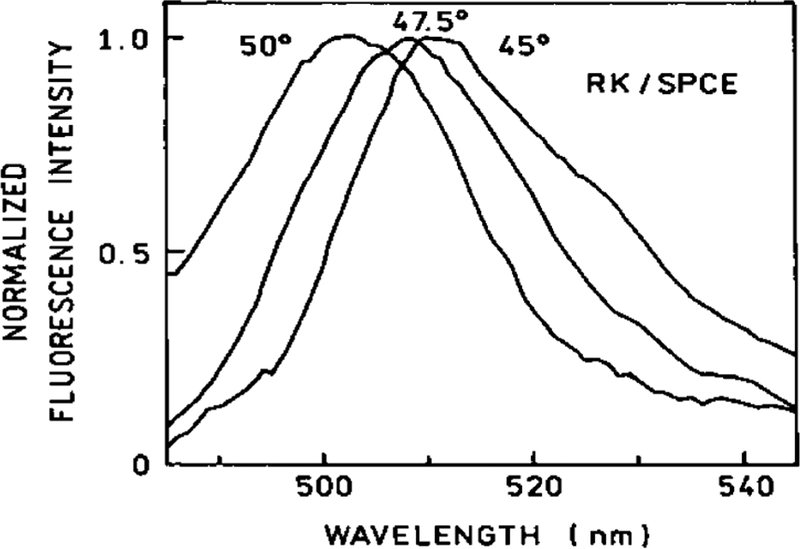
In previous SPCE experiments, the emission has been shown to have remarkable intrinsic spatial resolution. The dispersive property of SPR/SPCE has been observed as multicolor rings (9) and through the angular dependence of observed spectra (26). This results from the wavevector matching conditions required for the phenomena to occur (8, 22). The SPCE of GFP also displays this strong spectrum dependence on the angle of observation [Figure 6]. From the figure, it can be estimated that a 10° change in the observation angle results in approximately a 20 nm shift in the emission spectrum observed.
Figure 6.
Observed angular dependent emission spectra of GFP SPCE measured in RK configuration. Approximately a 20 nm/10° resolution is provided by this intrinsic SPCE property.
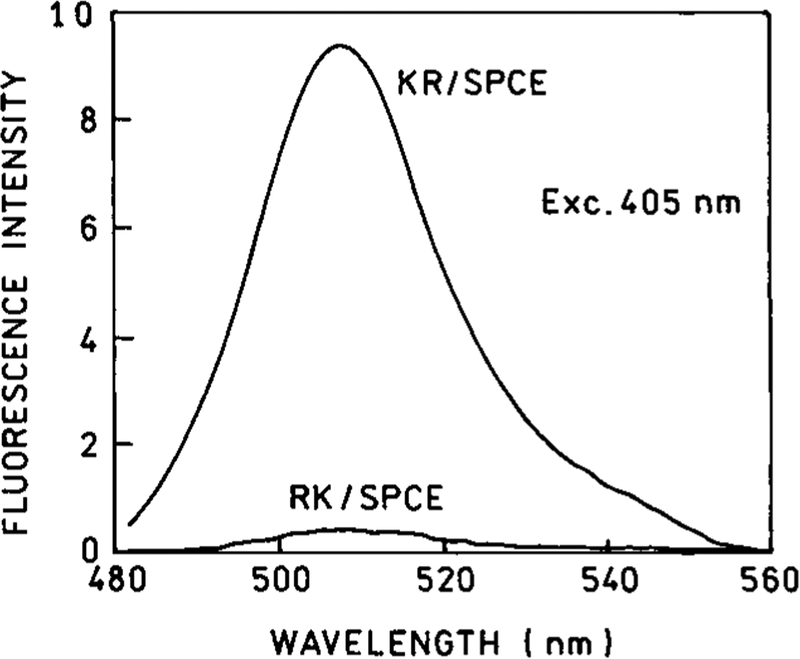
Finally, the system was then excited in the KR configuration and the resulting emission was measured in order to compare the two possible modes of excitation. As in the RK configuration, the spectrum corresponded to that of GFP. The data shows that the excitation with the KR configuration results in a signal that is over 20-fold stronger than that observed with the RK configuration [Figure 7]. It is worth noting that this increase of the excitation efficiency is completely independent from the enhancement of the collection efficiency. The higher excitation efficiency is a result of superior coupling of the energy into the fluorophore molecule.
Figure 7.
GFP SPCE spectra measured in the KR and RK configurations with the same excitation/observation conditions.
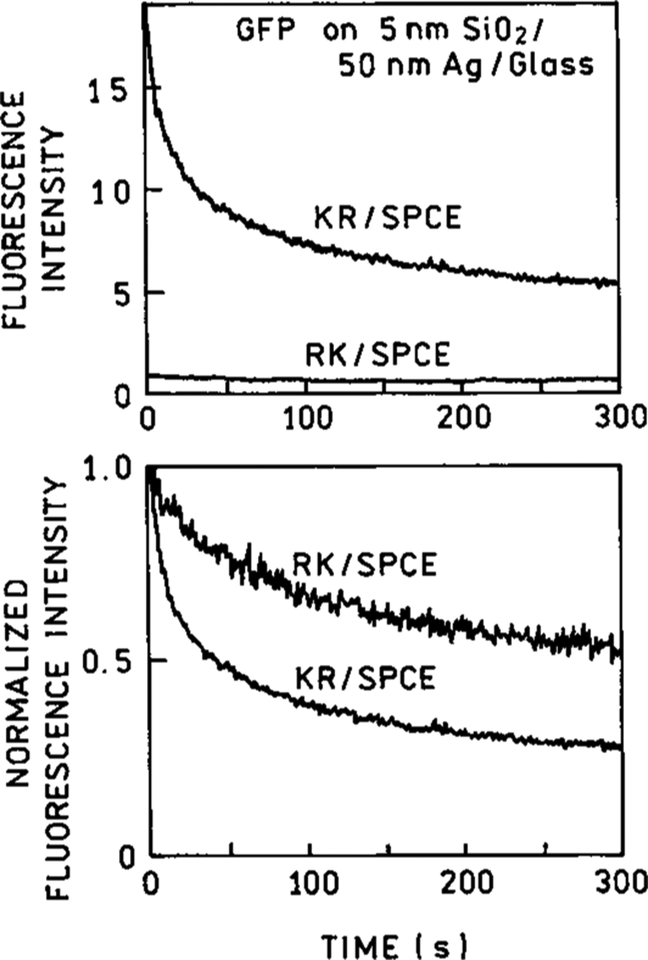
High energy densities usually lead to a greater instability of the molecules. As a consequence, photobleaching occurs faster in the KR configuration [Figure 8]. It was estimated the bleaching rate under KR configuration is approximately 7 times higher than the rate in RK illumination mode. The photobleaching observed could hamper the measurement accuracy if the excitation is not carefully monitored. On the other hand, the use of KR configuration with respectively decreased power allows for significantly longer exposure times while retaining the same emission levels as observed from the RK configuration without photodeterioration of the analyte.
Figure 8.
Comparison of GFP photobleaching illuminated in the KR and RK configurations. Intensities were normalized against the intensity at time t = 0.
The results show that the GFP attached to a thin silver film exhibits directional and highly polarized [97% p-polarized determined from IVH/IVV = 70] fluorescence emission. Normal fluorescence observed from GFP would not display these properties, suggesting that these results are due to surface plasmon-coupling.
Conclusions
The extension of SPCE to proteins with intrinsic fluorescence in the visible region opens new possibilities in protein/DNA studies. Under current experimental conditions the fluorescence emission was collected from approximately 0.2 arc deg of the light cone [the collection was performed using an optical fiber with a slit in order to facilitate the beam positioning and to enhance the resolution of the spatial measurement]. This corresponds to a capturing of approximately 1/1800 of the total SPCE. Because the emission is so directional, it is possible to collect all of the light coming out from the illuminated spot using simple reflective and/or refractive optics. Such optical systems are currently under development, and our expectations are for total light intensities that are 103–104 times higher than those observed in the absence of SPCE.
The spatial resolution of SPCE due to its dispersive properties could be incorporated into miniaturized spectrofluorometers with minimal optical components, resulting in remarkably improved detection. Also, the narrow excitation and emission angles open an opportunity for filter-free detection of the fluorescence; the SPR angle for the excitation wavelength differs from the emission by more than 12°. For the GFP data described earlier, a laser diode [LD] with relatively low power [2.6 mW] with a beam divergence 0.5° was used for excitation. Therefore, it is possible to create portable, low-cost devices [i.e., protein or DNA chip reader] without the use of any optical filters, using simple slits for light separation. As the above-mentioned LD is a mass-produced core element in the newest DVD players [the so-called Blue-ray/HD-DVD], their price is expected to fall rapidly within the next couple years. Imaging a sensor array may only require an inexpensive 2–3 megapixel CCD. This should allow protein and DNA detection devices to become as low-cost and ubiquitous as currently available blood glucose meters.
A method for strictly optical enhancement of fluorescence, which is not related to an increase of the excitation power or electronics sensitivity, could have far-reaching consequences. For example, it would be possible to significantly decrease the size of the spot for protein or DNA testing in DNA chips. This would result in significantly higher densities of the test chip spots or detection of lower concentrations of DNA. As the total signal increases 3–5 orders of magnitude, it may be sufficient to perform DNA detection without much amplification. In the use of labeled proteins, it is not uncommon to put multiple labels on the same molecule in order to achieve higher intensities from the same probe. However, the higher the labeling degree, the more different the interactive behavior is. Using only a single label or even the native protein fluorescence would allow highly sensitive, low-background studies of binding events, with sensitivity surpassing that provided by standard SPR. Finally, the increased amount of light would enable low-cost, hand-held, photodiode-based devices with sensitivity and resolution provided by current research grade equipment.
Acknowledgment
This work was made possible by funding from the following grant awards: NIH 1R21RR018608- 01A1, RR, and the National Center for Research Resources, RR-08119.
References and Notes
- (1).Lakowicz JR Principles of Fluorescence Spectroscopy; Plenum Press: New York, 1999. [Google Scholar]
- (2).Heyduk T Measuring protein conformational changes by FRET/LRET. Curr. Opin. Biotechnol 2002, 13, 292–296. [DOI] [PubMed] [Google Scholar]
- (3).Daly CJ; McGrath JC Fluorescent ligands, antibodies, and proteins for the study of receptors. Pharmacol. Ther 2003, 100, 101–18. [DOI] [PubMed] [Google Scholar]
- (4).Kricka LJ Stains, labels and detection strategies for nucleic acids assays. Ann. Clin. Biochem 2002, 39, 114–29. [DOI] [PubMed] [Google Scholar]
- (5).Miyawaki A; Sawano A; Kogure T Lighting up cells: labeling proteins with fluorophores. Nat. Cell Biol 2003, 5, S1–S7. [PubMed] [Google Scholar]
- (6).Van Orden A; Marchara NP; Goodwin PM; Keller RA Single-molecule identification in flowingsample streams by fluorescence burst size and intraburst fluorescence decay rate. Anal. Chem 1998, 70, 1444–1451. [DOI] [PubMed] [Google Scholar]
- (7).Liebermann T; Knoll W Surface-plasmon field-enhanced fluorescence spectroscopy. Colloids Surf., A 2000, 171, 115–130. [Google Scholar]
- (8).Lakowicz JR Radiative decay engineering 3. Surface plasmon-coupled directional emission. Anal. Biochem 2004, 324, 153–169. [DOI] [PMC free article] [PubMed] [Google Scholar]
- (9).Gryczynski I; Malicka J; Gryczynski Z; Lackowicz JR Radiative decay engineering 4. Experimental studies of surface plasmon-coupled directional emission. Anal. Biochem 2004, 324, 170–182. [DOI] [PMC free article] [PubMed] [Google Scholar]
- (10).Matveeva E; Malicka J; Gryczynski I; Gryczynski Z; Lakowicz JR Multi-wavelength immunoassays using surface plasmon-coupled emission. Biochem. Biophys. Res. Commun 2004, 313, 721–726. [DOI] [PMC free article] [PubMed] [Google Scholar]
- (11).Malicka J; Gryczynski I; Gryczynski Z; Lakowicz JR DNA hybridization using surfaceplasmon-coupled emission. Anal. Chem 2003, 75, 6629–6633. [DOI] [PMC free article] [PubMed] [Google Scholar]
- (12).Gryczynski I; Malicka J; Gryczynski Z; Nowaczyk K; Lakowicz JR Ultraviolet surface plasmon-coupled emission using thin aluminum films. Anal. Chem 2004, 76, 4076–4081. [DOI] [PMC free article] [PubMed] [Google Scholar]
- (13).Calander N Theory and simulation of surface plasmon-coupled directional emission from fluorophores at planar structures. Anal. Chem 2004, 76, 2168–2173. [DOI] [PubMed] [Google Scholar]
- (14).Ekgasit S; Thammachareon C; Knoll W Surface plasmon resonance spectroscopy based onevanescent field treatment. Anal. Chem 2004, 76, 561–568. [DOI] [PubMed] [Google Scholar]
- (15).Liedberg B; Lundstrom I Principles of biosensing with an extended coupling matrix and surface plasmon resonance. Sens. Actuators, B 1993, 1163–72. [Google Scholar]
- (16).Frey BL; Jordan CE; Kornguth S; Corn RM Control of the specific adsorption of proteins onto gold surface with poly(L-lysine) monolayers. Anal. Chem 1995, 67, 4452–457. [Google Scholar]
- (17).Salamon Z; Macleod HA; Tollin G Surface plasmon resonance spectroscopy as a tool for investigating the biochemical and biophysical properties of membrane protein systems. I: Theoretical principles. Biochim. Biophys. Acta 1997, 1331, 117–129. [DOI] [PubMed] [Google Scholar]
- (18).Peterlinz KA; Georgiadis RM; Herne TM; Tarlov MJ Observation of hybridization of thiol-tethered DNA using two-color surface plasmon resonance spectroscopy. J. Am. Chem. Soc 1997, 119, 3401–3402. [Google Scholar]
- (19).Yu F; Yao D; Knoll W Surface plasmon field-enhanced fluorescence spectroscopy studies of the interaction between an antibody and its surface-coupled antigen. Anal. Chem 2003, 75, 2610–2617. [DOI] [PubMed] [Google Scholar]
- (20).Matveeva E; Gryczynski Z; Gryczynski I; Lakowicz JR Immunoassays based on directional surface plasmon-coupled emission. J. Immunol. Methods 2004, 286, 133–140. [DOI] [PMC free article] [PubMed] [Google Scholar]
- (21).Malicka J; Gryczynski I; Gryczynski Z; Lakowicz JR Use of surface plasmon-coupled emission to measure DNA hybridization. J. Biomol. Screening 2004, 9, 208–215. [DOI] [PMC free article] [PubMed] [Google Scholar]
- (22).Raether H Surface plasma oscillations and their applications In Physics of Thin Films, Advances in Research and Development; Hass G, Francombe MH, Hoffman RW, Eds.; Academic Press: New York, 1977; Vol. 9, pp 145–261. [Google Scholar]
- (23).Pockrand I Surface plasma oscillations at silver surfaces with thin transparent and absorbing coatings. Surf. Sci 1978, 72, 577–588. [Google Scholar]
- (24).Nelson BP; Frutos AG; Brockman JM; Corn RM Nearinfrared surface plasmon resonance measurements of ultrathin films. 1. Angle shift and SPR imaging experiments. Anal. Chem 1999, 71, 3928–3934. [Google Scholar]
- (25).Yang F; Moss LG; Phillips GN Jr. The molecular structure of green fluorescent protein. Nat. Biotech 1996, 14, 1246–1251. [DOI] [PubMed] [Google Scholar]
- (26).Gryczynski I; Malicka J; Lukomska J; Gryczynski Z; Lakowicz JR Surface plasmon-coupled polarized emission of N-acetyl-l-tryptophanamide. Photochem. Photobiol 2004, 80, 482–485. [DOI] [PMC free article] [PubMed] [Google Scholar]


