

Abstract
The aim of this study was to investigate the formation of furan and acrylamide and to compare antioxidant capacities and volatile compounds in cold or hot brewed coffees. Cold brews were prepared at 5 °C and 20 °C for 12 h. using steeping and dripping, and hot brews were prepared at 80 °C and 95 °C for 5 min. using the pour-over method. Furan contents of cold steeping at 5 °C and hot brewed at 80 °C showed the higher levels significantly (p < 0.05), which were 17.0 ± 0.5 and 10.6 ± 0.1 ng/mL, respectively. However, acrylamide contents in cold steeping at 5 °C and hot brew at 80 °C showed lower levels, which were 4.1 ± 0.4 and 3.5 ± 0.1 ng/mL respectively. Cold brews at 20 °C showed the highest levels of antioxidant activities while hot brews showed similar levels with cold brews at 5 °C. This study confirms that levels of different beneficial and hazardous chemical compounds could be manipulated by adjusting the coffee extraction conditions.
Keywords: Coffee, Cold brew, Hot brew, Furan, Acrylamide, Volatile compounds
Introduction
The pleasant aroma of coffee is formed and released during brewing procedures (Akiyama et al., 2007). There are various types of coffee brewing (e.g. espresso, hand-drip, moka-pot and cold brew, etc.) currently implemented in today’s market. However, the brewing methods varies significantly based on consumers preferences (Guenther et al., 2010). Among these methods, the interest and demand for cold brew coffee have grown due to its beneficial properties such as less acidic compounds and higher levels of antioxidants compared to regular hot coffee (Callow, 2017).
Unlike hot coffee, cold brew coffee is created by using water at either room temperature or lower (refrigeration temperature) to ensure brewing process do not expose to heat during the extraction process for extended periods (Siegel Bari Faye, 2017; Toddy® Cold brew system instructions, 2017). The most common methods for cold brew coffee among consumers include the steeping method (also called immersion), where coffee grounds are saturated in cold water for hours until finally strained, and the other method is dripping, in which water is gradually dripped through using the cold brew maker (Callow, 2017).
It is well known that brewed coffee contains higher contents of potent carcinogens such as furan and acrylamide produced by the Maillard reaction during the coffee bean roasting, and brewing steps are shown to affect the changes of furan and acrylamide contents in coffee (Altaki et al., 2011; Guenther et al., 2007). Furan, a volatile heterocyclic compound, is classified as a possible carcinogen to humans (Group 2B) by the International Agency for Research on Cancer (IARC, 1995). There are several studies reported that various brewing methods showed significantly lower contents of furan in brewed coffee compared to that of coffee bean (Arisseto et al., 2011; Kim et al., 2009).
Acrylamide, classified as a probable carcinogen to humans (Group 2A) by the IARC (2014), is also formed during the roasting procedure in coffee. The European Food Safety Authority (EFSA, 2009) monitored an average of 221 μg/kg of acrylamide in roasted coffee and coffee beverages (Blanch et al., 2013; Soares et al., 2006). Lantz et al. (2006) concluded that acrylamide present in the roasted coffee was heavily extracted into the brew and solubilized due to their high water solubility (Andrzejewski et al., 2004; Hoenicke and Gatermann, 2005).
On the other hand, the high antioxidant capacity of coffee brews is a well-known nutritional benefit of coffee consumption (Anese and Nicoli, 2003; del Castillo et al., 2002). The antioxidant capacity of coffee is related to its natural constituents in green coffee beans including chlorogenic acids, polyphenols and compounds formed by processing (e.g. melanoidins) (Brezová et al., 2009). The brewing procedure is essential for the antioxidant properties of brewed coffee because the contact of water with roasted coffee grounds is a crucial step for the extraction of coffee (Ludwig et al., 2012). In addition, several authors suggested that there are certain correlation of antioxidant activities and total phenolic contents in coffee beverages (Kim et al., 2002; Oliveira-Neto et al., 2016). Furthermore, other studies have investigated the antioxidant abilities of cold brewed coffee and have determined higher antioxidant capacities compared to hot coffee (Shin, 2017; So et al., 2014).
Aromatic compounds play a key role in coffee beverages as the main contributors for coffee taste and odor (Bhumiratana et al., 2011; Petisca et al., 2013). The brewing conditions are known to influence the volatile flavor compounds in brewed coffee (Amanpour and Selli, 2016; Maeztu et al., 2001; Semmelroch and Grosch, 1996). Although cold brewed coffee has a distinguishable taste, there are few studies that have investigated the volatile compounds of cold brew based on different brewing conditions (Hwang et al., 2014).
Specialty Coffee Association of America (SCAA, 2016) suggested the best brewing practices for hot brews based on the coffee-to-water contact time and grinding size; 1–4 min for fine, 4–6 min for drip, 6–8 min for coarse and temperature at 93.0 ± 3 °C. However, the definition or suggestion of the best condition and practice for the cold brew coffee is not yet established mostly due to lack of current scientific studies. Since the brewing step is an important factor influencing many hazardous chemicals, typically furan and acrylamide levels, antioxidant activities and volatile compounds in coffee, the chemical characteristics of hot and cold brews must be investigated. Therefore, the objective of this study was to investigate the typical hazardous chemical such as furan and acrylamide, antioxidant capacities and volatile compounds in coffee extracted by various cold and hot brewing conditions.
Materials and methods
Chemicals and reagents
Furan (> 99%, Cat#:185922), d4-furan (> 99%, Cat#:338753), acrylamide (> 99%, Cat#:A3553) and d3-acrylamide (> 99%, Cat#:72834), 2,2′-Azino-bis (3-ethylbenzothiazoline-6-sulfonic acid) diammonium salt (ATBS, Cat#:A1888), 2,2′-Azobis (2-methylpropionamidine) dihydrochloride (AAPH, Cat#:440914) and Folin & Ciocalteu’s phenol reagent (Cat#F9252) were purchased from Sigma-Aldrich. Inc (St Louis, MO, USA). Sodium chloride of analytical grade (Cat#:S0476) was purchased from Sam-chun Pure Chemical Co., Ltd (Republic of Korea). All chemicals used were of HPLC analytical grade.
Preparation of coffee samples
Arabica coffee beans from Uganda were provided by a local roasting company (Indie Coffee Roasters, Seoul, South Korea). Coffee beans were roasted to medium roast using TT20 Coffee roaster (Petroncini Co. Ltd., Italy) and the degree of roasting was measured by CM-100 Coffee roast degree analyzer (Lighttells Co. Ltd., Taiwan) based on the Roast Color Classification System-Agtron, SCAA (2015), USA. Roasted coffee beans were stored at − 40 °C until use. Solis TYPE262 full auto grinder (Supreme Electric Manufacture Co. Ltd., China) was used to grind the coffee beans. The stored coffee was ground to pass a sieve size 850 μm for the control of coffee brew yields.
Brewing procedures
All brewing methods were used golden cup standard (1:20, w/v) suggested by SCAA (2015). Overall, dripping and steeping methods were used as cold brew, whereas, pour-over method was used for hot brewing. Dripping procedure were as followings: ground 12.5 g of ground coffee added to 250 mL of water in cold brew maker (Bean plus Co., South Korea), dripping rate adjusted to 1 drop/2 s, placed at 5 °C (refrigeration temperature, D5) or 20 °C (room temperature, D20), and extracted for 12 h. Steeping procedure were as followings: ground coffee (12.5 g) and water (250 mL) were added into a glass bottle, shaken gently up and down for 20 s, and placed at 5 °C (S5) or 20 °C (S20) for 12 h, followed by filtering through coffee filter paper thoroughly. Pour-over brewing procedure was as followings: Clever dripper (E.K. INT’L Co., Taiwan) and drip server (Kalita, Japan) were used to control the extractions. 12.5 g of ground coffee were placed coffee tray and added 250 mL of pre-heated at 80 °C (H80) and 95 °C (H95) water. The lid was placed on the dripper to reduce the loss of water and brewed for 5 min and then the dripper was moved onto the drip server for 3 min (drawdown). After preparation, all brews were stored in screw-cap vials without headspace at 5 °C and used for analysis within a day.
Determination of furan
Determination of furan was conducted with SPME-GC/MS according to the analytical method of Goldmann et al. (2005) with slight modification. The standard solutions for analysis of furan were 5, 10, 50, 100 ng/g furan in water. After brewing, 900 μL of coffee sample was transferred into 20-mL vial containing 0.2 g of sodium chloride. 100 μL of d4-furan internal standard solution (100 μg/L) was added and then immediately the vial was sealed. Solid phase microextraction experiment was carried out with 75 μm Carboxen/polydimethylsiloxane (CAR/PDMS) fiber (Supelco, USA). Agilent 7890A gas chromatograph equipped with Gerstel MPS2 autosampler (Gerstel, Germany) and coupled to 5975 MSD (Agilent Technologies, USA) was used. The fiber was pre-conditioned for 1 h at 250 °C before analysis and then exposed at 40 °C for 20 min. The fiber was injected and held for 5 min at 250 °C to desorb volatiles. Separation was performed on HP Plot Q (30 m, 0.32 mm, 20 μm; J & W Scientific, CA) with the splitless mode. Helium was used as a carrier gas at a constant flow rate of 44 cm/s. The oven temperature was held 50 °C for 5 min initially and then raised 25 °C/min to 230 °C (held for 2 min). For qualitative analysis of furan, mass/charge (m/z) 39, 68 for furan and 42, 72 for d4-furan were compared in terms of their responses in selected ion monitoring (SIM) mode. Also, for quantitative analysis, m/z 68 and 72 were monitored for furan and d4-furan, respectively.
Determination of acrylamide
Analytical method of acrylamide was based on Andrzejewski et al. (2004) with the minor modifications. 9 mL brewed coffee and 1 mL of d3-acrylamide (200 ng/mL) were placed into a 50-mL tube. The tube was vortexed for 30 s and centrifuged at 6000 rpm for 15 min with Maxi-Spin, 0.45 μm PVDF filtration tube. Oasis HLB column was conditioned with 3.5 mL of methanol followed by 3.5 mL of water. 1.5 mL of sample was loaded onto the cartridge and followed with 0.5 of water. All the eluent was discarded. 1.5 mL of water was added to the column, and then collected. Bond Elut-Accucat SPE column was conditioned with 2.5 mL of methanol and followed by 2.5 mL of water. And all the eluent collected from HLB column was passed. First 8 drops were discarded and then all the eluent were collected. UPLC (Nexera X2, Shimadzu, Japan) coupled with MS/MS System (Triple Quad 4500 System, AB SCIEX, USA) was used for LC–ESI–MS/MS analysis. Synergi 4u Hydro-RP (80A 250 × 2.0 mm) column was maintained at 30 °C. 0.2% acetic acid and 0.5% methanol in water was mobile phase at a flow rate of 0.3 mL/min. The sample injection volume was 20 µL. MS/MS conditions were as follows; source temperature, 120 °C; capillary voltage, 5.5 kV; curtain gas, 25 psi. MRM (multiple reaction-monitored) ions were 72 > 55 for acrylamide and 75 > 58 for d3-acrylamide.
Total phenolic content assay
Total phenolic content of brewed coffee samples was immediately measured by Folin-Ciocalteu’s reagent for fresh brewed coffee samples. For total phenolic content assay, the brewed coffee samples were diluted with distilled water (1:100, v/v). Gallic acid was used as standard solutions (0.06, 0.15, 0.29 and 0.59 μmol/mL). 200 μL of diluted sample or standard solution was taken into a microtube and 400 μL of 1 N Folin–Ciocalteau reagent was added. After 3 min, 600 μL of 30% Na2CO3 solution was mixed. The mixture was placed in water bath under dark conditions for 1 h at room temperature. After 1 h, the absorbance was determined at 765 nm. Total phenolic content of brewed coffee samples was expressed as μmol GAE (gallic acid equivalent) in each mL of coffee brew.
ABTS free radical anion scavenging activity
Antioxidant capacity analysis was immediately performed for fresh brewed coffee samples. L-ascorbic acid was used as standard solutions (10, 25, 50 and 100 mg/L). The method of Kim et al. (2002) with a slight modification was used for ABTS assay. Brewed coffee samples were diluted with distilled water (1:100, v/v). ABTS + solution was prepared: 2.5 mM of 2,2′-Azino-bis (3-ethylbenzothiazoline-6-sulfonic acid) diammonium salt was mixed with 1 mM of 2,2′-Azobis (2-methylpropionamidine) dihydrochloride in 10 mM phosphate buffered saline (PBS) solution, pH 7.4 (1:1). The mixture was heated in a water bath at 68 °C for 40 min and then cooled down to room temperature. After filtered through 0.45 μm PVDF filter, the solution was diluted properly with PBS buffer until absorbance of 0.65 ± 0.02 at 734 nm. 20 μL of ascorbic acid standard solution or sample was mixed with 980 μL of ABTS + solution and then incubated in the water bath at 37 °C for 10 min. The antioxidant activity was expressed as vitamin C equivalents in mg per L.
Volatile compound analysis
Volatile compounds analysis was performed using SPME-GC/MS based on the method of Hwang et al. (2014) with slight modifications. Solid phase microextraction was achieved using 50/30 μm divinylbenzen/carboxen/polydimethylisoxane (DVB/CAR/PDMS) fiber. The total volume of coffee sample in the vial was adjusted to 1 mL. The sample vials were conditioned for 40 min at 60 °C and then the fiber was exposed for 10 min before injection. The fiber was injected and held for 30 secs at 260 °C to desorb volatiles. Agilent 7890A gas chromatograph equipped with Gerstel MPS2 autosampler (Gerstel, Germany) and coupled to 5975 MSD (Agilent Technologies, USA) was used. Oven temperature program was; 40 °C (held for 5 min), 4 °C/min to 250 °C. DB wax column (30 m × 0.25 mm, thickness 0.25 μm; J&W Scientific, Folsom, CA) was used for the chromatographic separation and the splitless injection mode was used. Helium gas was used as a carrier gas at a constant flow rate of 1 mL/min. The constituents were identified by comparing their mass spectra with Wiley and NIST library files (Wiley B 2013), and the library matching quality higher than 80% was used. Kovats indexes were calculated for the DB-Wax capillary column using n-alkane as external references and then compared with literature index data from NIST.
Statistical analysis
All experiments were performed three times independently, and experimental data were expressed as the mean ± standard deviation. Statistically significant differences in the mean values were determined by the one-way analysis of variance (One-way ANOVA) with Duncan’s multiple range test, and independent-sample t test (p < 0.05) using SPSS 22.0 software (SPSS, Inc., Chicago, IL, USA).
Results and discussion
Determination of furan
Furan contents in cold and hot brew coffees extracted by steeping and dripping at different temperatures are shown in Table 1. There were no significant differences (p > 0.05) between two extraction methods such as steeping and dripping for cold brew coffees in terms of furan content. However, significantly low amounts of furan (p < 0.05) were observed in cold brew coffee treated at 20 °C compared to that of 5 °C temperature. The furan contents in cold brewed coffee at 20 °C by steeping and dripping were 11.3 ± 0.3 and 11.0 ± 0.4 ng/mL, respectively. However, those of coffees at 5 °C were 17.0 ± 0.5 and 16.7 ± 0.2 ng/mL, respectively. The hot brew coffees showed temperature dependent results in common with cold brews. The H95 samples was 9.2 ± 0.3 ng/mL, which was the lowest level and H80 sample was 10.6 ± 0.1 ng/mL. Overall, the cold brew samples were shown to possess higher amounts of furan than the hot brews. This can be explained by the longer extraction times of cold brew coffee, which takes place below the boiling point of furan (boiling point at 31 °C) and ultimately results in a lower possibility of evaporation than hot brews.
Table 1.
Levels of furan & acrylamide in cold and hot brew coffees
| Extraction | Coffee samples | Furan levels(ng/mL) | RSD (%) | Acrylamide levels(ng/mL) | RSD (%) |
|---|---|---|---|---|---|
| Cold brew | S5 | 17.0 ± 0.5d | 3.17 | 4.1 ± 0.4b | 5.09 |
| S20 | 11.3 ± 0.3c | 2.59 | 5.1 ± 0.4c | 2.97 | |
| D5 | 16.7 ± 0.2d | 0.97 | 5.0 ± 0.3c | 9.13 | |
| D20 | 11.0 ± 0.4bc | 3.97 | 5.4 ± 0.2c | 7.47 | |
| Hot brew | H80 | 10.6 ± 0.1b | 1.29 | 3.5 ± 0.1a | 3.09 |
| H95 | 9.2 ± 0.3a | 2.76 | 4.3 ± 0.5b | 11.17 |
Values with different letter within a same column (a–d) are significantly different (p < 0.05) as measured by Duncans’ test
Pérez-Martínez et al. (2008) reported non-significant differences of furan levels during the storage observed in the coffee brews stored at 4 °C unlike those stored at 25 °C for 1 day. Various furan contents may result from some brewing factors such as the coffee to water ratio, extraction temperature, time and pressure. Cold brews use lower water temperatures but longer extraction times in order to increase the contact between water and coffee grounds compared to hot brews. Previous studies have shown various levels of furan depending on the coffee extraction conditions. Furan contents were detected and investigated in drip coffee using a home drip coffee maker (20–78 ng/mL), instant coffee (12–20 ng/mL) and espresso capsule coffee (117–244 ng/mL) (Arisseto et al., 2011; Altaki et al., 2011). Additionally, La Pera et al. (2009) showed that brewing coffee in hot water at 98 °C resulted in a higher reduction of furan levels than at 80 °C. Kim et al. (2009) also observed a significant decrease of furan levels in canned coffee after heating at 60 °C for 5 min without the lid due to the vaporization of furan. The results of our study showed similar or lower contents of furan than other coffee brewing methods from other studies. Consequently, cold and hot brew samples showed temperature dependent results, signifying the relationship between lower temperature conditions and higher contents of furan.
Determination of acrylamide
Acrylamide contents in cold and hot brew coffees extracted by steeping and dripping at different temperatures are shown in Table 2. The acrylamide content of S5 sample was 4.1 ± 0.4 ng/mL, which showed significant difference (p < 0.05) with those of other cold brew coffees. The acrylamide contents of S20, D5, and D20 were 5.1 ± 0.4, 5.0 ± 0.3, and 5.4 ± 0.2 ng/mL, respectively. The H80 sample was shown to be significantly lower (p < 0.05) in acrylamide content compared to that of H95. The cold brew coffee showed higher acrylamide quantities than the hot brew samples. Due to the hydrophilicity of acrylamide, the contact time between water and coffee grounds might strongly influence the acrylamide extraction in brewed coffee samples. Similarly, Alves et al. (2010) reported that increased water contact time to coffee grounds increased the acrylamide levels in espresso coffee based on different brewing lengths. Therefore, cold brews which have relatively longer contact time with water showed higher levels of acrylamide than hot brews. From previous studies, the acrylamide contents of 300 mL of brewed coffee from locally purchased ground coffee had estimates of 0.5–4.21 μg/300 mL (Andrzejewski et al., 2004) and 38–77 μg/L for 30 mL of espresso coffee (Alves et al., 2010). The results of cold and hot brew samples in this study showed lower acrylamide contents than those previous when converted to the same dilution ratio. The different roasting condition, extraction pressures, and coffee-water ratio in this study may cause lower acrylamide contents in both brewed samples.
Table 2.
Relative peak area percentages of major volatile flavor compounds in cold and how brew coffee
| Furans | Cold brew | Hot brew | ||||
|---|---|---|---|---|---|---|
| S5 | S20 | D5 | D20 | H80 | H95 | |
| Furans | 39.47 ± 1.11a | 40.87 ± 0.80a | 39.24 ± 1.29a | 40.55 ± 0.46a | 43.26 ± 1.70b | 43.4 ± 1.23b |
| Pyrazines | 8.21 ± 0.44b | 8.61 ± 0.86b | 7.34 ± 0.16a | 8.78 ± 0.20b | 8.60 ± 0.59b | 8.84 ± 0.29b |
| Pyridines | 4.44 ± 0.18a | 4.61 ± 0.32ab | 4.90 ± 0.34bc | 5.20 ± 0.19 cd | 5.92 ± 0.05de | 5.55 ± 0.16e |
| Pyrroles | 3.12 ± 0.11a | 3.14 ± 0.15a | 3.11 ± 0.14a | 3.20 ± 0.05a | 3.24 ± 0.03a | 3.46 ± 0.12b |
| Ketones | 3.20 ± 0.10bc | 3.06 ± 0.09ab | 3.33 ± 0.12c | 3.23 ± 0.21bc | 3.03 ± 0.12ab | 2.81 ± 0.14a |
| Furanones | 0.30 ± 0.04a | 0.31 ± 0.04a | 0.30 ± 0.04a | 0.29 ± 0.03a | 0.40 ± 0.02b | 0.42 ± 0.01b |
| Aldehydes | 4.39 ± 0.29b | 4.20 ± 0.30b | 4.30 ± 0.23b | 4.27 ± 0.50b | 3.33 ± 0.11a | 3.25 ± 0.10a |
| Alcohols | 0.35 ± 0.02ab | 0.28 ± 0.02a | 0.33 ± 0.07ab | 0.33 ± 0.06ab | 0.33 ± 0.03ab | 0.39 ± 0.01b |
| Acids | 0.20 ± 0.04a | 0.20 ± 0.01a | 0.22 ± 0.03ab | 0.22 ± 0.01ab | 0.27 ± 0.04bc | 0.29 ± 0.03c |
| Lactones | 0.30 ± 0.04a | 0.31 ± 0.04ab | 0.30 ± 0.04a | 0.29 ± 0.03a | 0.36 ± 0.00bc | 0.39 ± 0.00c |
| Thiophenes | 0.13 ± 0.00ab | 0.11 ± 0.01ab | 0.14 ± 0.01c | 0.13 ± 0.01ab | 0.10 ± 0.01a | 0.10 ± 0.02a |
| Sulfur compounds | 0.15 ± 0.02b | 0.15 ± 0.02b | 0.12 ± 0.02b | 0.13 ± 0.02b | 0.06 ± 0.01a | 0.06 ± 0.00a |
| Volatile phenols | 0.97 ± 0.03a | 1.05 ± 0.02a | 0.96 ± 0.02a | 1.17 ± 0.04b | 1.05 ± 0.09a | 1.18 ± 0.01b |
Peak area percentage is expressed a mean ± standard deviation of three measurements
Values with different letter within a same row (a–e) are significantly different (p < 0.05) as measured by Duncan’s test
Antioxidant potential of cold and hot brew coffee
Coffee, especially cold brew is well known for having high antioxidant contents (Callow, 2017; Cämmerer and Kroh, 2006; Nicoli et al., 1997). The total phenolic content assay determines the total polyphenol content of coffee based on a redox reaction, and can be considered an evaluation of antioxidant capacity (Vignoli et al., 2011). The cold brew at 20 °C (D20 and S20) showed the significantly higher total phenolic contents (10.75 ± 0.49 and 10.91 ± 0.48 μmol mL−1 GAE, respectively) than 5 °C samples (Fig. 1). The hot brews showed the same temperature dependent results, which coffee samples extracted higher temperatures showed higher total phenolic contents as the cold brew samples. The significant difference (p < 0.05) in total phenolic contents according to the extraction methods was only shown between the D5 and S5 samples while none were observed between D20 and S20. Total phenolic contents in brewed coffee by solid–liquid extraction by Sacchetti et al. (2009) were 14.6–22.7 μmol mL−1 GAE with a coffee to water ratio of 1:10 (w/w). So et al. (2014) reported cold brew coffee extracted and stored at 20 °C showed higher total phenolic contents (18.97 ± 0.33 μmol mL−1 GAE) than 4 °C samples. When calculated to the same dilution factor of this study (1:20), total phenolic contents obtained from cold and hot brewed coffee samples showed similar levels with the previous findings.
Fig. 1.
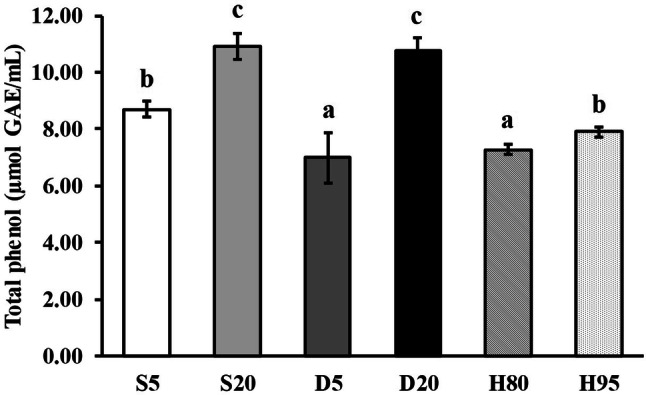
Total phenol contents of cold and hot brew coffee samples. S5: Steeping 5 °C, S20: Steeping 20 °C, D5: Dripping 5 °C, D20: Dripping 20 °C, H80: Hot brew 80 °C, H95: Hot brew 95 °C, n = 3 replicates, significant difference between methods for P-value < 0.05 based on Duncan’s test
The ABTS assay was chosen due to its applicability to beverages containing hydrophilic, hydrophobic and high-pigmented antioxidant compounds compared to the DPPH assay from a previous study (Floegel et al., 2011). Figure 2 shows the ABTS radical anion scavenging activities of cold and hot brew coffee. The ABTS of cold brew coffee were 3249.31 ± 287.82 mg VcE/L (S5), 4243.40 ± 290.46 mg VcE/L (S20), 3217.94 ± 428.16 mg VcE/L (D5), and 4417.28 ± 167.13 mg VcE/L (D20). The ABTS of hot brew coffee were 3388.21 ± 147.98 mg VcE/L (H80), and 3604.00 ± 354.61 mg VcE/L (H95).
Fig. 2.

Antioxidant capacities of coffee samples measured by ABTS assay. S5: Steeping 5 °C, S20: Steeping 20 °C, D5: Dripping 5 °C, D20: Dripping 20 °C, H80: Hot brew 80 °C, H95: Hot brew 95 °C, n = 3 replicates, significant difference between methods for P-value < 0.05 based on Duncan’s test
ABTS radical anion scavenging activities of cold and hot brew showed similar tendencies with the results of total phenolic contents. Cold brewing methods temperature dependently significantly increased the ABTS, whereas, hot brewing method did increase the ABTS without significant differences. Similar with total phenolic content results, cold brewing at 20 °C did show highest level of ABTS that of cold brewing at 5 °C and overall hot brewing.
Furthermore, Fuller and Rao (2017) investigated how extraction rates through intragranular diffusion may limit the extractable concentration of soluble coffee compounds in the hot brew, as compared to the cold brew due to the drastic time differences for each process; this difference may explain the higher antioxidant activities achieved between our samples. Due to the destruction of antioxidants by exposure to high temperature, the cold brew coffee could be resulted in higher antioxidant activities than that of hot brew coffee.
Volatile compound of cold and hot brew coffee
Volatile compounds considered one of the important factors for food, mostly because it effects the aroma of that food, and evaluating the potential hazardous chemicals. Therefore, evaluating the differences between volatile compound of cold and hot brew is necessary. Relative peak area percentages of major volatile flavor compounds in cold and hot brew coffee samples are shown in Table 1.
The major volatile compounds identified were: 19 furans (2,5-dimethylfuran, 2-vinylfuran, 2-2(2-propenly)-furan, furfuryl methyl ether, furfural, furfuryl methyl sulfide, 2-acetylfuran, furfuryl acetate, 5-methyl-2-furfural, 2-propionylfuran, 2-methylbenzofuran, 2,2’-bifuran, 2-furfurylfuran, 2-acetyl-5-methylfuran, 2-furanmethanol, 5-methyl-2-furfurylfuran, furfuryl ether, 2-methylfuran), 12 pyrazines (2-methylpyrazine, 2,5-dimethylpyrazine, 2,6-dimethylpyrazine, ethylpyrazine, 2,3-dimethylpyrazine, 2-ethyl-6-methylpyrazine, trimethylpyrazine, propylpyrazine, 2,6-diethylpyrazine, 2-ethyl-3,5-dimethylpyrazine, pyrazinamide, 2-ethyl-5-methylpyrazine), 4 pyridines (pyridine, 2-methylpyridine, 3-methylpyridine, 3-ethylpyridine), 4 pyrroles (1-methylpyrrole, 2-formyl-1-methylpyrrole, 1-furfurylpyrrole, 2-acetylpyrrole), 9 ketones (2-butanone, 2-hexanone, 2,3-pentanedione, 2,3-hexanedione, 1-(2-furyl)-2-propanone, 2-methyltetrahydrothiophen-3-one, 1-(2-furanyl)-3-butanone, 1-hydroxy-2-propanone, (E)-3-penten-2-one), 9 aldehydes (2-methylbutanal, 3-methylbutanal, hexanal, 2-methyl-2-butenal, benzaldehyde, phenylacetaldehyde, 2-thiophenecarboxaldehyde, 2-phenyl-2-butenal, 1H-pyrrole-2-carboxaldehyde), 2 alcohols (2-methoxyphenylethanol, 2-thiophene methanol), 1 furanone (dihydro-2-methyl-3-(2H)-furanone), 1 acid (acetic acid), 1 lactone (γ-buthyrolactone), 2 thiophenes (3-methylthiophene, 2-acetylthiophene), 1 sulfur compound (dimethyl disulfide), and 2 phenols (guaiacol, phenol).
Maeztu et al. (2001) reported that furans, pyrazines, ketones, aldehydes, alcohols, pyrroles, esters, pyridines, sulfur compounds, thiazoles and thiophenes were the major volatile compounds found in espresso coffee. Additionally, Ludwig et al. (2014) reported the volatile compounds in arabica and robusta coffee were furans, esters, aldehydes, ketones, alcohols, thiophenes, pyrroles, pyrazines, lactones. Among the nineteen furans identified, the content of furfuryl acetate, 2-furanmethanol, 5-methyl-2-furfural, and furfural were higher in both cold and hot brew coffee. Interestingly, 2-methylfuran, which gives fruity flavor, were detected only in hot brew coffee (data not shown). Furans, which are the main volatile compounds in arabica coffee beans, give off burnt and caramel flavors in coffee brews (Amanpour and Selli, 2016).
Furfuryl acetate, 2-furanmethanol, furfural, 5-methyl-2-furfural and 2-acetylfuran were the most abundant (> 2% of total peak area percentages). Peak area percentages of total furans in hot brew coffee (43.3–43.4%) were significantly (p < 0.05) higher than those of cold brews (39.2–40.6%). Pyrazines are responsible for musty and earthy flavor in coffee (Maeztu et al., 2001). Numerous pyrazines have been proposed as important compounds for coffee aroma with low sensory threshold values (Caporaso et al., 2018). 2-methylphyrazine was the most abundant among the 12 pyrazines in cold and hot brew samples. 2-ethyl-3,5-dimethylpyrazine which is another important volatile compound in coffee was also detected. Pyridines, mostly found in cooked foods, are contributed to both smoky and burnt flavor in coffee (Sunarharum et al., 2014). Pyridine content were found to be about 4.4–5.9% in cold and hot brew coffee samples. Pyrroles, which are nitrogen-containing heterocyclic compounds, are associated with a caramel-like, buttery flavor (Chin et al., 2011). Ketones are responsible for buttery and creamy flavor in coffee (López-Galilea et al., 2006). 2,3-pentanedione was identified with 0.9–1.1% total peak area of volatile compounds in all the brewed samples. This compound has been reported as one of the main contributors to brewed coffee aroma (Amanpour and Selli, 2016).
Hwang et al. (2014) reported that there was no observation of acetic acid in cold brew coffee. In this study, 0.2% acetic acid was detected in cold brew samples which was lower than hot brew samples. There are many compounds which have been studied as important contributors to coffee although they were detected in very small amounts in our research. γ-butyrolactone is produced by degradation of chlorogenic acid and has a buttery, coconut flavor. It is one of the compounds mostly found in medium roasted coffee beans. Linalool, contributed to flowery flavors, and a damasceneone, sweet-fruity flavor, was also detected in the brew samples.
In summary, the chemical properties of cold and hot brew coffee in this work have been characterized based on the three different aspects: furan and acrylamide contents, antioxidant capacities and volatile compounds. This study confirms that these chemicals in cold and hot brew coffee were potentially influenced by different extraction conditions (e.g. temperature). This research is useful for deciding the optimal extraction method of coffee for desired compound content.
Acknowledgements
This research was supported by the Chung-Ang University Graduate Research Scholarship in 2018.
Compliance with ethical standards
Conflict of interests
The authors declare that they have no conflict of interest.
Footnotes
Publisher's Note
Springer Nature remains neutral with regard to jurisdictional claims in published maps and institutional affiliations.
Contributor Information
Da-eun Kang, Email: daeuni25@naver.com.
Haeng-Un Lee, Email: 2418235@naver.com.
Munkhtugs Davaatseren, Email: munkhtugs@hotmail.com.
Myung-Sub Chung, Email: chungms@cau.ac.kr.
References
- Akiyama M, Murakami K, Ikeda M, Iwatsuki K, Wada A, Tokuno K, Onishi M, Iwabuchi H. Analysis of the headspace volatiles of freshly brewed Arabica coffee using solid-phase microextraction. J. Food Sci. 2007;72:C388–C396. doi: 10.1111/j.1750-3841.2007.00447.x. [DOI] [PubMed] [Google Scholar]
- Altaki MS, Santos FJ, Galceran MT. Occurrence of furan in coffee from Spanish market: contribution of brewing and roasting. Food Chem. 2011;126:1527–1532. doi: 10.1016/j.foodchem.2010.11.134. [DOI] [PubMed] [Google Scholar]
- Alves RC, Soares C, Casal S, Fernandes JO, Oliveira MBP. Acrylamide in espresso coffee: Influence of species, roast degree and brew length. Food Chem. 2010;119:929–934. doi: 10.1016/j.foodchem.2009.07.051. [DOI] [Google Scholar]
- Amanpour A, Selli S. Differentiation of volatile profiles and odor activity values of Turkish coffee and French press coffee. J. Food Process. Preserv. 2016;40:1116–1124. doi: 10.1111/jfpp.12692. [DOI] [Google Scholar]
- Andrzejewski D, Roach JA, Gay ML, Musser SM. Analysis of coffee for the presence of acrylamide by LC-MS/MS. J. Agric. Food Chem. 2004;52:1996–2002. doi: 10.1021/jf0349634. [DOI] [PubMed] [Google Scholar]
- Anese M, Nicoli MC. Antioxidant properties of ready-to-drink coffee brews. J. Agric. Food Chem. 2003;51:942–946. doi: 10.1021/jf025859+. [DOI] [PubMed] [Google Scholar]
- Arisseto A, Vicente E, Soares Ueno M, Verdiani Tfouni SA, De Figueiredo Toledo MC. Furan levels in coffee as influenced by species, roast degree, andbrewing procedures. J. Agric. Food Chem. 2011;59:3118–3124. doi: 10.1021/jf104868g. [DOI] [PubMed] [Google Scholar]
- Bhumiratana N, Adhikari K, Chambers E., IV Evolution of sensory aroma attributes from coffee beans to brewed coffee. LWT Food Sci. Technol. 2011;44:2185–2192. doi: 10.1016/j.lwt.2011.07.001. [DOI] [Google Scholar]
- Blanch GP, Morales FJ, Moreno FDLP, Ruiz del Castillo ML. A new approach based on off-line coupling of high-performance liquid chromatography withgas chromatography-mass spectrometry to determine acrylamide in coffee brew. J. Sep. Sci. 2013;36:320–324. doi: 10.1002/jssc.201200635. [DOI] [PubMed] [Google Scholar]
- Brezová V, Šlebodová A, Staško A. Coffee as a source of antioxidants: An EPR study. Food Chem. 2009;114:859–868. doi: 10.1016/j.foodchem.2008.10.025. [DOI] [Google Scholar]
- Callow C. Cold brew coffee. Great Britain: Michell Beazley; 2017. [Google Scholar]
- Cämmerer B, Kroh LW. Antioxidant activity of coffee brews. Eur. Food Res. Technol. 2006;223:469–474. doi: 10.1007/s00217-005-0226-4. [DOI] [Google Scholar]
- Caporaso N, Whitworth MB, Cui C, Fisk ID. Variability of single bean coffee volatile compounds of Arabica and robusta roasted coffees analysed by SPME-GC-MS. Food Res. Int. 2018;108:628–640. doi: 10.1016/j.foodres.2018.03.077. [DOI] [PMC free article] [PubMed] [Google Scholar]
- Chin ST, Eyres GT, Marriott PJ. Identification of potent odourants in wine and brewed coffee using gas chromatography-olfactometry and comprehensive two-dimensional gas chromatography. J. Chromatogr. A. 2011;1218:7487–7498. doi: 10.1016/j.chroma.2011.06.039. [DOI] [PubMed] [Google Scholar]
- del Castillo MD, Ames JM, Gordon MH. Effect of roasting on the antioxidant activity of coffee brews. J. Agric. Food Chem. 2002;50:3698–3703. doi: 10.1021/jf011702q. [DOI] [PubMed] [Google Scholar]
- European Food Safety Authority Results on the monitoring of acrylamide levels in food. EFSA Sci. Rep. 2009;285:1–26. [Google Scholar]
- Fuller M, Rao NZ. The effect of time, roasting temperature, and grind size on caffeine and chlorogenic acid concentrations in cold brew coffee. Sci. Rep. 2017;7:17979. doi: 10.1038/s41598-017-18247-4. [DOI] [PMC free article] [PubMed] [Google Scholar]
- Floegel A, Kim DO, Chung SJ, Koo SI, Chun OK. Comparison of ABTS/DPPH assays to measure antioxidant capacity in popular antioxidant-rich US foods. J. Food Compos. Anal. 2011;24:1043–1048. doi: 10.1016/j.jfca.2011.01.008. [DOI] [Google Scholar]
- Goldmann T, Périsset A, Scanlan F, Stadler RH. Rapid determination of furan in heated foodstuffs by isotope dilution solid phase micro-extraction-gas chromatography–mass spectrometry (SPME-GC-MS) Analyst. 2005;130:878–883. doi: 10.1039/b419270b. [DOI] [PubMed] [Google Scholar]
- Guenther H, Anklam E, Wenzl T. Stadler RH. Acrylamide in coffee: review of progress in analysis, formation and level reduction. Food Addit. Contam. 2007;24:60–70. doi: 10.1080/02652030701243119. [DOI] [PubMed] [Google Scholar]
- Guenther H, Hoenicke K, Biesterveld S, Gerhard-Rieben E, Lantz I. Furan in coffee: pilot studies on formation during roasting and losses during production steps and consumer handling. Food Addit. Contam. Part A. 2010;27:283–290. doi: 10.1080/19440040903317505. [DOI] [PubMed] [Google Scholar]
- Hoenicke K, Gatermann R. Studies on the stability of acrylamide in food during storage. J. AOAC Int. 2005;88:268–273. doi: 10.1093/jaoac/88.1.268. [DOI] [PubMed] [Google Scholar]
- Hwang SH, Kim KS, Kang HJ, Kim JH, Kim MJ. Studies on the flavor compounds of dutch coffee by headspace GC-mass. Korean J. Food Cook. Sci. 2014;30:596–602. doi: 10.9724/kfcs.2014.30.5.596. [DOI] [Google Scholar]
- International Agency for Research on Cancer. Furan. In: IARC monographs on the evaluation of carcinogenic risks of chemicals to humans, 63 (1995) Available from: http://monographs.iarc.fr/ENG/Classification/latest_classif.php. Accessed: 30th of SEP. 2018
- International Agency for Research on Cancer. Acrylamide. In IARC Monographs on the Evaluation of Carcinogen Risk to Humans: Some Industrial Chemicals; 60: 389-433 (2014) Available from: http://monographs.iarc.fr/ENG/Classification/latest_classif.php. Accessed: 30th of SEP. 2018 [PubMed]
- Kim DO, Lee KW, Lee HJ, Lee CY. Vitamin C equivalent antioxidant capacity (VCEAC) of phenolic phytochemicals. J. Agric. Food Chem. 2002;50:3713–3717. doi: 10.1021/jf020071c. [DOI] [PubMed] [Google Scholar]
- Kim TK, Lee YK, Park YS, Lee KG. Effect of cooking or handling conditions on the furan levels of processed foods. Food Addit. Contam. Part A. 2009;26:767–775. doi: 10.1080/02652030902774656. [DOI] [PubMed] [Google Scholar]
- La Pera L, Liberatore A, Avellone G, Fanara S, Dugo G, Agozzino P. Analysis of furan in coffee of different provenance by head-space solid phase microextraction gas chromatography–mass spectrometry: effect of brewing procedures. Food Addit. Contam. Part A. 2009;26:786–792. doi: 10.1080/02652030902751712. [DOI] [PubMed] [Google Scholar]
- Lantz I, Ternité R, Wilkens J, Hoenicke K, Guenther H, van der Stegen GH. Studies on acrylamide levels in roasting, storage and brewing of coffee. Mol. Nutr. Food Res. 2006;50:1039–1046. doi: 10.1002/mnfr.200600069. [DOI] [PubMed] [Google Scholar]
- López-Galilea I, Fournier N, Cid C, Guichard E. Changes in headspace volatile concentrations of coffee brews caused by the roasting process and the brewing procedure. J. Agric. Food Chem. 2006;54:8560–8566. doi: 10.1021/jf061178t. [DOI] [PubMed] [Google Scholar]
- Ludwig IA, Sanchez L, Caemmerer B, Kroh LW, De Peña MP, Cid C. Extraction of coffee antioxidants: Impact of brewing time and method. Food Res. Int. 2012;48:57–64. doi: 10.1016/j.foodres.2012.02.023. [DOI] [Google Scholar]
- Ludwig IA, Sánchez L, De Peña MP, Cid C. Contribution of volatile compounds to the antioxidant capacity of coffee. Food Res. Int. 2014;61:67–74. doi: 10.1016/j.foodres.2014.03.045. [DOI] [Google Scholar]
- Maeztu L, Sanz C, Andueza S, Paz de Pena M, Bello J, Cid C. Characterization of espresso coffee aroma by static headspace GC− MS and sensory flavorprofile. J. Agric. Food Chem. 2001;49:5437–5444. doi: 10.1021/jf0107959. [DOI] [PubMed] [Google Scholar]
- Nicoli MC, Anese M, Manzocco L, Lerici CR. Antioxidant properties of coffee brews in relation to the roasting degree. LWT Food Sci. Technol. 1997;30:292–297. doi: 10.1006/fstl.1996.0181. [DOI] [Google Scholar]
- Oliveira-Neto JR, Rezende SG, de Fátima Reis C, Benjamin SR, Rocha ML, de Souza Gil E. Electrochemical behavior and determination of major phenolicantioxidants in selected coffee samples. Food Chem. 2016;190:506–512. doi: 10.1016/j.foodchem.2015.05.104. [DOI] [PubMed] [Google Scholar]
- Pérez-Martínez M, Sopelana P, De Pena MP, Cid C. Changes in volatile compounds and overall aroma profile during storage of coffee brews at 4 and 25 C. J. Agric. Food Chem. 2008;56:3145–3154. doi: 10.1021/jf703731x. [DOI] [PubMed] [Google Scholar]
- Petisca C, Pérez-Palacios T, Farah A, Pinho O, Ferreira IM. Furans and other volatile compounds in ground roasted and espresso coffee using headspacesolid-phase microextraction: Effect of roasting speed. Food Bioprod Process. 2013;91:233–241. doi: 10.1016/j.fbp.2012.10.003. [DOI] [Google Scholar]
- Sacchetti G, Di Mattia C, Pittia P, Mastrocola D. Effect of roasting degree, equivalent thermal effect and coffee type on the radical scavenging activity of coffee brews and their phenolic fraction. J. Food Eng. 2009;90:74–80. doi: 10.1016/j.jfoodeng.2008.06.005. [DOI] [Google Scholar]
- Semmelroch P, Grosch W. Studies on character impact odorants of coffee brews. J. Agric. Food Chem. 1996;44:537–543. doi: 10.1021/jf9505988. [DOI] [Google Scholar]
- Shin KS. The chemical characteristics and immune-modulating activity of polysaccharides isolated from cold-brew coffee. Prev. Nutr. Food Sci. 2017;22:100. doi: 10.3746/pnf.2017.22.2.100. [DOI] [PMC free article] [PubMed] [Google Scholar]
- Siegel Bari Faye. Cool, smooth and creamy WB law coffee capitalizing on the nitro cold brew trend (2017) Available from: http://www.njbiz.com/article/20171009/NJBIZ01/171009860/cool-smooth-and-creamy-wb-law-coffee-capitalizing-on-the-nitro-cold-brew-trend. Accessed: 30th of SEP. 2018
- So YJ, Lee MW, Yoo KM, Kang HJ, Hwang IK. Physicochemical characteristics and antioxidant activity of Dutch coffee dependingon different extraction conditions and storage. Korean J. Food Sci. Technol. 2014;46:671–676. doi: 10.9721/KJFST.2014.46.6.671. [DOI] [Google Scholar]
- Soares C, Cunha S, Fernandes J. Determination of acrylamide in coffee and coffee products by GC-MS using an improved SPE clean-up. Food Addit. Contam. 2006;23:1276–1282. doi: 10.1080/02652030600889608. [DOI] [PubMed] [Google Scholar]
- Specialty Coffee Association of America. SCAA Standard Golden cup (2015) Available from: http://www.scaa.org/?page=resources&d=brewing-standards. Accessed: 30th of SEP. 2018
- Specialty Coffee Association of America. SCAA Best practice: guidelines for using by-pass in the drip coffee brewing process (2016) Available from: http://www.scaa.org/?page=resources&d=brewing-best-practices. Accessed: 30th of SEP. 2018
- Sunarharum WB, Williams DJ, Smyth HE. Complexity of coffee flavor: A compositional and sensory perspective. Food Res. Int. 2014;62:315–325. doi: 10.1016/j.foodres.2014.02.030. [DOI] [Google Scholar]
- Toddy Inc. Cold brew system instructions (2017) Available at: https://toddycafe.com/cold-brew/instruction-manual. Accessed: 30th of MAR. 2018
- Vignoli JA, Bassoli DG, Benassi MT. Antioxidant activity, polyphenols, caffeine and melanoidins in soluble coffee: The influence of processing conditions and raw material. Food Chem. 2011;124:863–868. doi: 10.1016/j.foodchem.2010.07.008. [DOI] [Google Scholar]