

Abstract
Exopolysaccharide producing starter cultures enable manufacturing “clean labeled” foods with improved textural and nutritional properties. The structural and technological analyses were performed on the ropy exopolysaccharides of six Lactobacillus plantarum. The incubation temperature, time and pH affected the exopolysaccharide production and high exopolysaccharide was produced in the presence of sucrose and maltose. The viscosity of exopolysaccharide was high at acidic conditions except PFC311E that showed viscous at neutral pH. Lactobacillus plantarum strains produced between 120 and 400 mg/L exopolysaccharide in which the highest was observed at L. plantarum PFC311. Exoploysaccharides were degraded over 300 °C except PFC311E that degraded at 295.7 °C. The NMR analyses revealed that the exopolysaccharides were synthesized by α1-6, α1-3 and α1-4 bonds with glucose, galactose and fructose moieties. In conclusion, L. plantarum PFC311 produced ropy exopolysaccharide with different structural, rheological and thermal properties and reveals potential to be used in food industry.
Keywords: Lactobacillus plantarum, Exopolysaccharide, Ropiness, Structure, Rheology
Introduction
Recent interest in food industry is the use of natural food additives which fullfil the expectations during the production of different food products due to consumer preferences. One of the preferred natural compounds are exopolysaccharides (EPS) that can be produced by bacteria, fungi, and blue-green algae (Amjres et al., 2015). Lactic acid bacteria (LAB) are also among the EPS producers and their long history in the production of fermented food products together with their use in the food industry for the bulk production make them necessary to be tested for production of different metabolites including EPS (Dertli et al., 2018). Previous studies also confirmed the technological roles of EPS produced by LAB in different food products including cereal based foods (Arendt et al., 2007; Galle and Arendt, 2014). The structure of EPSs, which can be either homopolymeric or heteropolymeric that are composed of only one type of sugar monomer and two or more types of sugar monomers, respectively (Dertli et al., 2013), can be important for their technological functions together with the production levels of EPSs. Other important features of EPSs from LAB are their rheological properties that can affect their viscosifying, stabilizing, emulsifying or gelling properties and their thermal properties, which affects their usage during thermal processes (Ahmed et al., 2013).
Tarhana as a traditional cereal-based fermented food product that also contains yogurt in its preparation mixture has a rich and diverse microflora formed by LAB and yeast species (Özel et al., 2015; Sengun et al., 2009). Several LAB species to be associated with Tarhana production include Lactobacillus plantarum strains (Kivanc and Funda, 2017; Sengun et al., 2009; Settanni et al., 2011). Besides the potential probiotic functions of L. plantarum strains, it has received a considerable attention due to its technological functions (Wang et al., 2010; 2015; 2017; Zhang et al., 2013) which also include EPS production. Several L. plantarum strains were shown to produce both homopolymeric and heteropolymeric EPS (Wang et al., 2010) although these strains have been shown to produce heteropolymeric EPS with glucose and galactose as the main sugar monomers presented in the EPS repeating unit structure (Zhang et al., 2013).
EPS production is crucial technological trait of LAB species including L. plantarum that more researches are required in order to identify LAB species with EPS production from different fermented foods. In this study, 1044 LAB isolates previously isolated from Tarhana (Şimşek et al., 2017) were tested phenotypically for their ropy EPS production characteristics. Among these isolates, six LAB strains were selected as EPS producers. EPSs from these strains were further isolated, purified, and characterised for structural and functional properties. The effect of culture conditions including temperature, pH, carbon source and incubation time on EPS production levels was determined and the rheological properties of EPS solutions under different temperature and pH conditions were tested. This study reveals the identification of LAB isolates from Tarhana with EPS production properties and the characterisation of EPSs produced by these isolates in order to demonstrate their potential for future industrial applications.
Materials and methods
Bacterial strains and exopolysaccharide (EPS) production
In this study, 1044 LAB strains from Pamukkale University Food Engineering Culture Collection (PUFECC, WDCM 1019), which were previously isolated from Tarhana (Şimşek et al., 2017), were tested. All LAB strains were cultivated in MRS and GM17 broth (Merck Co. Germany) at 30 °C for 2 days and streaked to the corresponding agar plates to obtain single colonies that were then tested for their ropy characteristics using protocol described previously (Ruas-Madiedo and De Los Reyes-Gavilán, 2005). Positive strains were selected for further studies as EPS producers.
Genotypic characterization and identification of EPS producer LAB strains
In total 18 LAB strains were further selected as EPS producers and these strains were discriminated by (GTG)5 analysis using primer (5′-GTGGTGGTGGTGGTG-3′) as described previously (Groenewald and Botha, 2008). Distinct strains were then identified by 16S rRNA gene sequencing and two primer sets (529F 5′-GTGCCAGCMGCCGCGG-3′, 1491R 5′-ACGGCTACCTTGTTACGACTT-3′ and 27F 5′-AGAGTTTGATCCTGGCTCAG-3′-780R 5′-TACCAGGGTATCTAATCCTGTT-3′) were used for the amplification of 1464 bp of 16S rRNA gene. PCR mixes were prepared as described previously (Dertli et al., 2016) and PCR was performed with the following programme: 95 °C for 3 min, 30 cycles of 95 °C for 30 s, 57 °C for 30 s, and 72 °C for 1 min and 72 °C for 5 min final extension. PCR products were run on a gel to check the amplication and amplicons were sent to Macrogen for sequencing. Sequences obtained were interrogated with the NCBI database using the BLAST algorithm with a similarity criterion of 97–100%. The partial 16S sequences of the identified strains in this study were deposited in GenBank under accession numbers given in Table 1.
Table 1.
The identification accession number and the EPS production levels of L. plantarum strains
Determination of EPS production at different conditions
In order to determine the effect of incubation temperature on EPS production, cultures were grown in MRS incubated at 20 °C, 30 °C and 37 °C for 18 h. To test the effect of incubation time, cultures were incubated at 30 °C for 24, 36 and 48 h. Similarly, the effect of pH on EPS production was tested by growing cultures in MRS broth (Merck Co. Germany) set to pH 4, 5, 6 and 7, respectively. Finally, cultures were grown in MRS broth (Merck Co. Germany) containing 2% sucrose, maltose, lactose and fructose (Merck Co. Germany) instead of glucose in order to test the effect of carbon sources on the tested strains. The level of EPS production was determined by phenol–sulphuric acid methodology (Dubois et al., 1956).
EPS production levels of L. plantarum strains
Large scale EPS production at L. plantarum strains was carried out at 2 L of a Bioreactor (Minifors, Switzerland) at 30 °C with 100 rpm stirring rate and adjusting the pH to 6.0. To discard the contamination potentially originate from the yeast extract in MRS medium, modified BHI medium containing beef heart 5 g/L, calf brains 12.5 g/L, disodium hydrogen phosphate 2.5 g/L, peptone 10 g/L, sodium chloride 5 g/L, glucose 10 g/L, tween 20 g/L, sodium acetate 5 g/L, peptone casein 5 g/L, peptone meat 5 g/L and magnesium sulfate 0.2 g/L was used as substrate in the bioreactor to grow the L. plantarum strains. All strains were initially activated in 100 mL of the same medium then inoculated 1% (v/v) to bioreactor which was operated for 2 day and the EPS was isolated from the culture media by using the method as previously described (Dertli et al., 2016).
Rheological characterisation of EPSs
The rheological characterisation of EPSs was performed as described previously (Wang et al., 2015). Briefly, 30 mg of lyophilised EPSs were dissolved in dH2O that was set to pHs 3, 4, 6 and 7 and rheological properties were determined using a rheometer (Haake Mars, Thermo Fisher, Waltham, Massachusetts, USA) at 25 °C for 2 min and viscosity of the EPSs according to the shear stress values at 50−1 s was determined. These measurements were also conducted at 45 and 60 °C (Wang et al., 2015).
Thermal properties of EPSs
Thermal properties of the EPSs were tested by thermogravimetry (TG) and differential thermal analysis (PerkinElmer Diamond instrument, Waltham, Massachusetts, USA). For this, 3 mg of lyophilised EPSs were placed to ceramic pans and thermogravimetric properties were scanned at 50–1000 °C interval with a temperature increment at 10 °C/m. The weight loss (%) and the derivative mass values (%/oC) were determined as described previously (Wang et al., 2015).
For Differential Scanning Calorimetry (Perkin Elmer Pyris 6 DSC, Waltham, Massachusetts, USA) analysis, the purified EPS sample (5 mg) was placed in an aluminum pan, which was sealed and analyzed using empty pan as a reference. The melting point and enthalpy changes were determined by increasing the heating rate at 10 °C/min from 10 to 400 °C (Wang et al., 2015).
Monosaccharide composition of EPSs
The monosaccharide composition of EPSs produced by L. plantarum strains were determined as described previously (Dertli et al., 2018). Briefly, freeze-dried EPSs were hydrolysed with 0.5 M H2SO4 at 95 °C for 12 h followed by neutralisation with 4 M NaOH. The hydrolysates were filtered through a 0.45 μm pore size filter and the monosaccharide composition was determined by HPLC (Shimadzu Corp. Japan) using a CARBOsep CHO-682 Pb Column (Chrom-tech, USA) and RID-10A refractive index detector with a mobile phase of H2O, flow rate 0.7 mL/min and column temperature of 25 °C. Standard monosaccharides were glucose, galactose, fructose and rhamnose.
NMR analysis
NMR spectrum of the EPS produced from L. plantarum strains were analyzed by using a Bruker AVANCE 600 MHz spectrometer (Bruker Group, Fällanden, Switzerland) operated at 27 °C with a 5 mm inverse probe. The samples were dissolved in D2O at concentrations of 10 mg/mL for 1H NMR. Chemicals shifts (δ) were expressed in parts per million (ppm) (Wang et al., 2015).
Statistical analysis
A one-way ANOVA test was applied for the determination of the differences on the effects of environmental conditions on EPS production levels of the tested strains using Minitab program (MINITAB 14.0, State Colloge, Pensilvanya, USA). Differences among samples were determined by Tukey’s test (p < 0.05).
Results and discussion
Identification of EPS producer strains among Tarhana isolates
In total 1044 LAB previously isolated from Tarhana were tested for their EPS production characteristics (Şimşek et al., 2017). According to colony observation test, 18 isolates were selected as EPS producers and among these isolates 6 (PFC308, PFC309, PFC310, PFC311, PFC312, PFC313) were noted to be as high EPS producers due to their observable ropy phenotype. The (GTG)5 profiles of the LAB strains revealed that all tested isolates were distinct strains. Further identification of these strains by 16S rRNA sequencing showed that all strains were belong to L. plantarum. The GenBank accession numbers of LAB strains were given in Table 1. Furthermore, other previous studies also confirmed that L. plantarum strains are important strain in terms of EPS production (De Vries et al., 2006; Leroy and De Vuyst, 2004).
Effects of incubation temperature and time, carbon source and pH on EPS production levels of L. plantarum strains
The extrinsic factors are important determinants of the EPS production in LAB strains, we then tested the effects of incubation temperature and time, carbon source and pH on EPS production levels of L. plantarum strains (Fig. 1). Incubation temperature was found to be an important factor on EPS production of L. plantarum strains (Fig. 1A). At 20 °C, no EPS production was observed in strains PFC308 and PFC313 and testing EPS production at 20 °C and 37 °C showed that strain specific conditions affected the EPS production of L. plantarum strains depending on incubation temperature (Fig. 1A). More importantly all strains produced significantly lower (p < 0.05) EPS levels at 37 °C and 20 °C in comparison to EPS levels at 30 °C. This can be related with the mesophilic nature of L. plantarum strains and similar to our findings Pingitore et al. (2016) reported the tenfold decrement of EPS production in L. plantarum Q823 as an effect of the increment of incubation temperature from 30 to 37 °C. Tallon et al. (2003) also showed that L. plantarum EP56 produced higher level of EPS at 30 °C compared to 37 °C. This finding is crucial in terms of industrial production of Tarhana as generally fermentation occurs at room temperature, which is potentially a positive factor for the EPS production of Tarhana isolate L. plantarum strains.
Fig. 1.

The effects of incubation temperature (A), carbon source (B), pH (C) and incubation time (D) on the EPS production levels of L. plantarum
Effects of carbon source on EPS production levels of L. plantarum strains were tested by growing strains with sucrose, maltose, lactose and fructose as carbon sources and EPS production of the tested strains were altered depending on carbon source and strain specific conditions were determinant for the effect of carbon source (Fig. 1B). For instance, strains PFC308, PFC309 and PFC312 produced the highest EPS level when sucrose was the carbon source whereas with the maltose as the carbon source strains PFC310 and PFC311 produced the highest EPS levels (Fig. 1B). Additionally, L. plantarum PFC313 produced the highest EPS with lactose as the carbon source. In general, L. plantarum PFC311 appeared to be the highest EPS producer strain depending on different carbon source and produced 2086 μg/mL and 1601 μg/mL EPS with maltose and lactose, respectively (Fig. 1B). Our findings revealed that utilizing disaccharides as carbon sources resulted in higher levels of EPS production in L. plantarum strains. Previous studies also reported similar findings (Tallon et al., 2003) and in terms of cereal fermentation process, this fact can positively affect the EPS production.
Similar to the influence of incubation temperature and carbon sources, the effects of pH and incubation time were found to be strain specific (Fig. 1C, D). In general EPS production in L. plantarum strains was higher at pH 5–6 compared to the other pH values tested and this can be attributed to the fact that the physiological growth pHs of LAB is between 5 and 6 (Caggianiello et al., 2016; Ruas-Madiedo and De Los Reyes-Gavilán, 2005; Torino et al., 2015). Therefore, at this high level of physiological state, L. plantarum strains might produce higher levels of EPSs. Unlike the other conditions tested, there was not a direct relationship with the effect of incubation time and EPS production levels of L. plantarum strains (Fig. 1D). For instance, in strain PFC308 EPS production was minimum at 24 h incubation, peaked at 36 h, and gradually decreased at 48 h whereas at PFC309 24 h was the best incubation time but 36 h was the worse. Similar patterns were observed for the other tested strains and this finding reveals the complex nature of the EPS production and requirement for the optimisation of the incubation period.
EPS production levels of L. plantarum strains
EPSs from culture supernatants of L. plantarum strains grown with a modified BHI medium in a 2 L pH-controlled bioreactor were isolated and purified. Under these conditions the level of EPS production among the L. plantarum strains altered between 120 and 400 mg/L with the highest EPS production detected in L. plantarum PFC311 (Table 1). These strains showed relatively average level of EPS production in comparison to the reported level of EPS production among different LAB strains. For instance, two highest EPS producers were Lactobacillus rhamnosus RW-9595M and Lactobacillus kefiranofaciens WT-2B with an EPS production level of 2775 mg/L and 2500 mg/L, respectively (Maeda et al., 2004). But for L. plantarum strains, these levels of EPS production can be comparable with the other L. plantarum strains reported in the literature (Wang et al., 2010). We should also note that EPS production can be affected by intrinsic and extrinsic factors and can alter depending on strain specific conditions (Dertli et al., 2013).
Rheological characterisation of EPS
All EPSs produced by L. plantarum strains showed shear thinning behaviour potentially due to the formation of some breaks in EPS polymers with the hydrodynamic force applied during rheological measurement (Kavita et al., 2014). This attribute can be important for the perception of some sensorial properties of food products as well as during the technological process of food products (Zhou et al., 2014). The effect of pH on rheological properties of EPS solutions were tested and several patterns were observed for the effect of pH on EPS rheology (Fig. 2A). All EPSs except EPSs from PFC311E and PFC312E showed higher viscosity under acidic conditions compared to the neutral conditions (p < 0.05). This is important for the fermented food products and their physicochemical properties. Similar to this findings Wang et al. (2015) reported that EPS from L. kefiranofaciens ZW3 was more viscose under acidic conditions.
Fig. 2.

The rheological properties of EPSs under different pH (A) and temperature (B) conditions produced by L. plantarum
Effect of temperature of the EPS solution on viscosity of the EPSs were also tested and for all EPSs increment of the temperature from 25 to 60 °C resulted in the decrease at the viscosity of the EPS solution (Fig. 2B) which might be potentially due to the increase at the solubility of the EPSs. We should note that this can be drawback for Tarhana production as Tarhana is mostly consumed as a soup. Nevertheless, for other food products consumed at low temperatures this attribute of EPSs can be important. The rheological property of EPSs was found slightly lower than dextran (3% w/v) which showed 0.013 Pa s viscosity in dH2O at 25 °C. This result indicated that L. plantarum EPSs was able to show as much as the rheological of dextran.
Thermal properties of EPSs
The thermogravimetric analysis (TGA) of the EPS from L. plantarum strains was performed dynamically between weight loss versus temperatures (Fig. 3A–F) and EPSs from PFC310E and PFC311, PFC313E, PFC308E and PFC309E and finally PFC312E showed two, three and four degradation peaks respectively (Fig. 3). An initial weight loss between 8.40 and 10.46% observed at 47.51–59.94 °C temperature interval in all EPSs and this can be associated to the moisture loss due to the presence of the carbonyl groups in EPSs (Kumar et al., 2004). Additionally, between 140 and 147 °C, second weight loss was observed in EPSs of PFC312E, PFC313E, PFC308E and PFC309E at 10.30, 11.45, 9.08 and 10.73%, respectively (Fig. 3). The main weight loss was observed at 314 ± 1 °C in all EPSs except EPS from PFC311E, which was observed at 295.72 °C.
Fig. 3.

TGA mass loss spectrum of EPS produced by L. plantarum strains (A) PFC308, (B) PFC309, (C) PFC310, (D) PFC311, (E) PFC312 and (F) PFC313. The dotted line refers derivative weight (%/°C) where the straight line refers the weight (%) variations
The thermal degradation temperature of the EPSs from L. plantarum strains except PFC311 was found to be higher than previous reports (Wang et al., 2010; 2015; 2017) including the degradation temperatures of xanthan and locust gums (Dertli et al., 2018; Wang et al., 2010). The thermal stabilities of EPSs can be related with the core-repeating unit and the structure of EPSs as previously discussed (Wang et al., 2017). Higher level of thermal stability is crucial for EPSs to protect their stability during high temperature of thermal processes.
The melting temperatures of EPSs were determined at 70.99–74.17 °C (Table 2). The highest melting temperature was detected in the PFC308 strain and the lowest in the PFC312. At the same time, it was determined that the enthalpies of relavant EPSs were between 186.68 and 865.68 J/g. The highest enthalpy was determined in EPS produced by PFC309 and PFC313 strains, and the lowest in EPS of PFC310 strains (Table 2). Although the melting temperatures of EPSs were similar with the previous results, the high enthalpy of PFC309 and PFC313 strains were striking (Wang et al., 2010; 2015; 2017).
Table 2.
The melting point, enthalpy and monosaccharide composition of L. plantarum EPSs
| L. plantarum | Melting point (°C) | Enthalpy (J/g) | Monosaccharide composition |
|---|---|---|---|
| PFC308 | 74.17 | 343.54 | Glucose, galactose, fructose |
| PFC309 | 72.15 | 865.21 | Glucose, galactose |
| PFC310 | 73.00 | 186.68 | Glucose, galactose |
| PFC311 | 72.74 | 351.46 | Glucose, galactose, fructose |
| PFC312 | 70.99 | 389.40 | Glucose, galactose |
| PFC313 | 72.78 | 795.22 | Glucose, galactose |
Monosaccharide composition of EPSs
HPLC analysis of the EPSs produced by L. plantarum strains revealed that EPSs from PFC309E, PFC313E, PFC310E and PFC312E harboured glucose and galactose in their repeating units whereas EPSs of PFC308E and PFC311E contained fructose together with glucose and galactose. These findings suggested that the former strains produced heteropolymeric EPSs with glucose and galactose as sugar monomers and the latter strains produced homopolymeric fructan type EPS together with the heteropolymeric EPSs. In EPSs PFC309E and PFC313E glucose:galactose ratio was 1:3 and this ratio was 1:4 in EPSs PFC310E and PFC312E and finally glucose:galactose:fructose ratio of EPSs PFC308E and PFC311E were 1:3:1 and 2:2:1, respectively. These findings are in accordance with previous observations reported the EPS structure of L. plantarum strains in which glucose and galactose reported as dominant sugar monomers and arabinose and mannose were also reported as the sugar monomers in these studies (Wang et al., 2017; Zhou et al., 2014). Finally, the presence of the fructose in EPSs of L. plantarum strains was also reported (Wang et al., 2015).
NMR analysis of EPSs
1H NMR was mainly used to define the glycosidic bond configuration at polysaccharides. δ4.5–5.5 ppm signals at anomeric region were often used to differentiate the anomeric protons of sugar residues in polysaccharides. Chemical shifts between 4.4 and 4.8 ppm are typical of the anomeric protons of these β-linked residues, whereas α-anomeric protons usually resonate between 4.9 and 5.3 ppm (Agrawal, 1992). All the EPSs produced by L. plantarum strains showed very similar H-NMR spectra to each other (Fig. 4). Three major chemical shift signals in the δ4.5–5.5 ppm were detected in 1H NMR, indicated that the EPSs produced from L. plantarum mainly contained three monosaccharide residues with both α-type glycosidic linkages. According to the H-NMR spectra, it is interpreted that the bond at 4.9 ppm is α-1-6, the bond at 5.07 ppm is α-1-3 and the bond at 5.2 ppm is α-1-4. In the proton region, it is not analyzed because there are many overlaps. Similar H-NMR spectra have also been reported at EPS structures in L. plantarum strains (Kumar et al., 2004; Wang et al., 2015; Zhou et al., 2014).
Fig. 4.
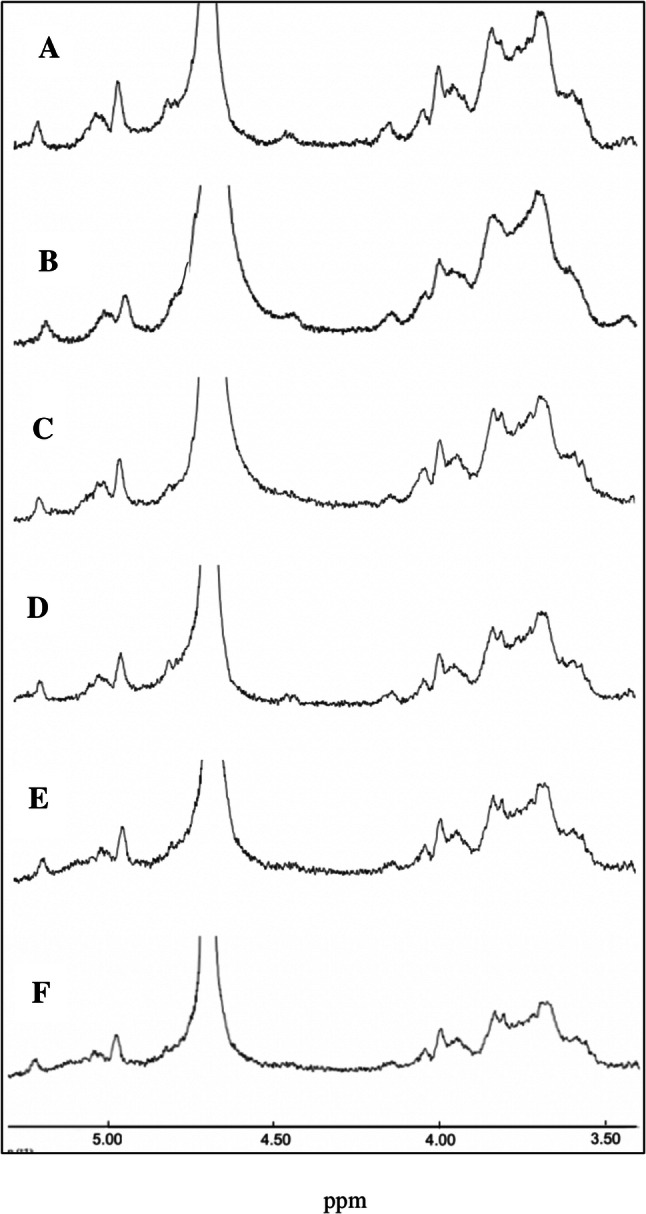
The H-NMR spectrum of EPSs produced by L. plantarum strains (A) PFC308, (B) PFC309, (C) PFC310, (D) PFC311, (E) PFC312 and (F) PFC313
As a conclusion, EPSs produced by different L. plantarum strains isolated from a traditional food Tarhana were discussed in terms of their structural, thermal and rheological properties. Lactobacillus plantarum strains isolated in this study were able to produce ropy EPSs with different characteristics in strain-dependent but EPS production significantly increased in the presence of sucrose and maltose. Lactobacillus plantarum PFC311 strain was one of the highest EPS producers reported for this species. The EPS produced in L. plantarum PFC311 is different for structural, rheological and thermal properties and reveals potential to be used in food industry as well as during the fermentation of different products including Tarhana.
Acknowledgements
The Scientific and Technogical Research Council of Turkey (TÜBİTAK) supported this study with the Project number 1160525. We also thank to Prof. Dr. Nazım Usta for giving opportunities to do the thermal analysis of EPSs and also interpreting the results.
Compliance with ethical standards
Conflict of interest
The authors declare that they have no conflict of interest.
Footnotes
Publisher's Note
Springer Nature remains neutral with regard to jurisdictional claims in published maps and institutional affiliations.
Contributor Information
Duygu Zehir Şentürk, Email: dzehir@pau.edu.tr.
Enes Dertli, Email: edertli@bayburt.edu.tr.
Hüseyin Erten, Email: herten@cu.edu.tr.
Ömer Şimşek, Email: omers@pau.edu.tr.
References
- Agrawal PK. NMR spectroscopy in the structural elucidation of oligosaccharides and glycosides. Phytochemistry. 1992;31:3307–3330. doi: 10.1016/0031-9422(92)83678-R. [DOI] [PubMed] [Google Scholar]
- Ahmed Z, Wang Y, Anjum N, Ahmad A, Khan ST. Characterization of exopolysaccharide produced by Lactobacillus kefiranofaciens ZW3 isolated from Tibet kefir–part II. Food Hydrocoll. 2013;30:343–350. doi: 10.1016/j.foodhyd.2012.06.009. [DOI] [Google Scholar]
- Amjres H, Béjar V, Quesada E, Carranza D, Abrini J, Sinquin C, Rastiskol J, Colliec-Jouault S, Llamas I. Characterization of haloglycan, an exopolysaccharide produced by Halomonas stenophila HK30. Int. J. Biol. Macromol. 2015;72:117–124. doi: 10.1016/j.ijbiomac.2014.07.052. [DOI] [PubMed] [Google Scholar]
- Arendt EK, Ryan LA, Dal Bello F. Impact of sourdough on the texture of bread. Food Microbiol. 2007;24:165–174. doi: 10.1016/j.fm.2006.07.011. [DOI] [PubMed] [Google Scholar]
- Caggianiello G, Kleerebezem M, Spano G. Exopolysaccharides produced by lactic acid bacteria: from health-promoting benefits to stress tolerance mechanisms. Appl. Microbiol. Biotechnol. 2016;100:3877–3886. doi: 10.1007/s00253-016-7471-2. [DOI] [PubMed] [Google Scholar]
- De Vries MC, Vaughan EE, Kleerebezem M, de Vos WM. Lactobacillus plantarum—survival, functional and potential probiotic properties in the human intestinal tract. Int. Dairy J. 2006;16:1018–1028. doi: 10.1016/j.idairyj.2005.09.003. [DOI] [Google Scholar]
- Dertli E, Colquhoun IJ, Côté GL, Le Gall G, Narbad A. Structural analysis of the α-D-glucan produced by the sourdough isolate Lactobacillus brevis E25. Food Chem. 2018;242:45–52. doi: 10.1016/j.foodchem.2017.09.017. [DOI] [PubMed] [Google Scholar]
- Dertli E, Colquhoun IJ, Gunning AP, Bongaerts RJ, Le Gall G, Bonev BB, Mayer MJ, Narbad A. Structure and biosynthesis of two exopolysaccharides produced by Lactobacillus johnsonii FI9785. J. Biol. Chem. 2013;288:31938–31951. doi: 10.1074/jbc.M113.507418. [DOI] [PMC free article] [PubMed] [Google Scholar]
- Dertli E, Yilmaz MT, Tatlisu NB, Toker OS, Cankurt H, Sagdic O. Effects of in situ exopolysaccharide production and fermentation conditions on physicochemical, microbiological, textural and microstructural properties of Turkish-type fermented sausage (sucuk) Meat Sci. 2016;121:156–165. doi: 10.1016/j.meatsci.2016.06.008. [DOI] [PubMed] [Google Scholar]
- Dubois M, Gilles KA, Hamilton JK, Rebers PT, Smith F. Colorimetric method for determination of sugars and related substances. Anal. Chem. 1956;28:350–356. doi: 10.1021/ac60111a017. [DOI] [Google Scholar]
- Galle S, Arendt EK. Exopolysaccharides from sourdough lactic acid bacteria. Crit. Rev. Food Sci. Nutr. 2014;54:891–901. doi: 10.1080/10408398.2011.617474. [DOI] [PubMed] [Google Scholar]
- Groenewald JH, Botha FC. Down-regulation of pyrophosphate: fructose 6-phosphate 1-phosphotransferase (PFP) activity in sugarcane enhances sucrose accumulation in immature internodes. Trans. Res. 2008;17:85–92. doi: 10.1007/s11248-007-9079-x. [DOI] [PubMed] [Google Scholar]
- Kavita K, Singh VK, Mishra A, Jha B. Characterisation and anti-biofilm activity of extracellular polymeric substances from Oceanobacillus iheyensis. Carbohydr. Polym. 2014;101:29–35. doi: 10.1016/j.carbpol.2013.08.099. [DOI] [PubMed] [Google Scholar]
- Kivanc M, Funda EG. A functional food: a traditional tarhana fermentation. Food Sci. Technol. 2017;37:269–274. doi: 10.1590/1678-457x.08815. [DOI] [Google Scholar]
- Kumar CG, Joo HS, Choi JW, Koo YM, Chang CS. Purification and characterization of an extracellular polysaccharide from haloalkalophilic Bacillus sp. I-450. Enzym. Microb. Technol. 2004;34:673–681. doi: 10.1016/j.enzmictec.2004.03.001. [DOI] [Google Scholar]
- Leroy F, De Vuyst L. Lactic acid bacteria as functional starter cultures for the food fermentation industry. Trends Food Sci. Technol. 2004;15:67–78. doi: 10.1016/j.tifs.2003.09.004. [DOI] [Google Scholar]
- Maeda H, Zhu X, Suzuki S, Suzuki K, Kitamura S. Structural characterization and biological activities of an exopolysaccharide kefiran produced by Lactobacillus kefiranofaciens WT-2BT. J. Agric. Food Chem. 2004;52:5533–5538. doi: 10.1021/jf049617g. [DOI] [PubMed] [Google Scholar]
- Özel S, Sabanoğlu S, Çon AH, Şimşek Ö. Diversity and stability of yeast species during the fermentation of tarhana. Food Biotechnol. 2015;29:117–129. doi: 10.1080/08905436.2014.996895. [DOI] [Google Scholar]
- Pingitore EV, Pessione A, Fontana C, Mazzoli R, Pessione E. Comparative proteomic analyses for elucidating metabolic changes during EPS production under different fermentation temperatures by Lactobacillus plantarum Q823. Int. J. Food Microbiol. 2016;238:96–102. doi: 10.1016/j.ijfoodmicro.2016.08.010. [DOI] [PubMed] [Google Scholar]
- Ruas-Madiedo P, De Los Reyes-Gavilán CG. Invited review: methods for the screening, isolation, and characterization of exopolysaccharides produced by lactic acid bacteria. J. Dairy Sci. 2005;88:843–856. doi: 10.3168/jds.S0022-0302(05)72750-8. [DOI] [PubMed] [Google Scholar]
- Sengun IY, Nielsen DS, Karapinar M, Jakobsen M. Identification of lactic acid bacteria isolated from tarhana, a traditional Turkish fermented food. Int. J. Food Microbiol. 2009;135:105–111. doi: 10.1016/j.ijfoodmicro.2009.07.033. [DOI] [PubMed] [Google Scholar]
- Settanni L, Tanguler H, Moschetti G, Reale S, Gargano V, Erten H. Evolution of fermenting microbiota in tarhana produced under controlled technological conditions. Food Microbiol. 2011;28:1367–1373. doi: 10.1016/j.fm.2011.06.008. [DOI] [PubMed] [Google Scholar]
- Şimşek Ö, Özel S, Çon AH. Comparison of lactic acid bacteria diversity during the fermentation of tarhana produced at home and on a commercial scale. Food Sci. Biotechnol. 2017;26:181–187. doi: 10.1007/s10068-017-0024-3. [DOI] [PMC free article] [PubMed] [Google Scholar]
- Tallon R, Bressollier P, Urdaci MC. Isolation and characterization of two exopolysaccharides produced by Lactobacillus plantarum EP56. Res. Microbiol. 2003;154:705–712. doi: 10.1016/j.resmic.2003.09.006. [DOI] [PubMed] [Google Scholar]
- Torino MI, de Valdez GF, Mozzi F. Biopolymers from lactic acid bacteria. Novel applications in foods and beverages. Front. Microbiol. 2015;6:834–849. doi: 10.3389/fmicb.2015.00834. [DOI] [PMC free article] [PubMed] [Google Scholar]
- Wang J, Zhao X, Tian Z, Yang Y, Yang Z. Characterization of an exopolysaccharide produced by Lactobacillus plantarum YW11 isolated from Tibet kefir. Carbohydr. Polym. 2015;125:16–25. doi: 10.1016/j.carbpol.2015.03.003. [DOI] [PubMed] [Google Scholar]
- Wang X, Shao C, Liu L, Guo X, Xu Y, Lü X. Optimization, partial characterization and antioxidant activity of an exopolysaccharide from Lactobacillus plantarum KX041. Int. J. Biol. Macromol. 2017;103:1173–1184. doi: 10.1016/j.ijbiomac.2017.05.118. [DOI] [PubMed] [Google Scholar]
- Wang Y, Li C, Liu P, Ahmed Z, Xiao P, Bai X. Physical characterization of exopolysaccharide produced by Lactobacillus plantarum KF5 isolated from Tibet kefir. Carbohydr. Polym. 2010;82:895–903. doi: 10.1016/j.carbpol.2010.06.013. [DOI] [PubMed] [Google Scholar]
- Zhang L, Liu C, Li D, Zhao Y, Zhang X, Zeng X, Yang Z, Li S. Antioxidant activity of an exopolysaccharide isolated from Lactobacillus plantarum C88. Int. J. Biol. Macromol. 2013;54:270–275. doi: 10.1016/j.ijbiomac.2012.12.037. [DOI] [PubMed] [Google Scholar]
- Zhou F, Wu Z, Chen C, Han J, Ai L, Guo B. Exopolysaccharides produced by Rhizobium radiobacter S10 in whey and their rheological properties. Food Hydrocoll. 2014;36:362–368. doi: 10.1016/j.foodhyd.2013.08.016. [DOI] [Google Scholar]