Abstract
Purpose:
We generate 12 models from 4 pregnant individuals to evaluate individual differences in local SAR for differing body habitus and fetal and maternal positions.
Methods:
Structural MR images from four pregnant subjects (including supine and left-lateral maternal positions) were manually segmented to create 12 body models by rotating the fetus, modifying the fat content and altering the maternal arm position in one of the subjects. Electromagnetic simulations modeled at 3T determined the average and peak local SAR in the maternal trunk, fetus, fetal brain, and amniotic fluid.
Results:
We observed a significant range of fetal and maternal peak local SAR across the models (maternal trunk: 19.14 to 44.03 W/kg, fetus: 9.93 to 18.79 W/kg, fetal brain 3.36 to 10.3 W/kg). We found that maternal body habitus changes introduced a significant variation in the maternal peak local SAR, but not the fetal local SAR. However, the maternal position (either rotating the mother to left-lateral position or altering the arm position) introduced changes in fetal peak local SAR (range: 11.9 to 17.9 W/kg). Rotating the fetus also introduced variation in the fetal and fetal brain peak local SAR.
Conclusion:
The observed variation in SAR emphasizes the need for more anatomical models to enable better safety management of individuals during fetal MRI, including a wider range of gestational ages.
Keywords: MRI safety, SAR, pregnant body models, fetus
Introduction
Magnetic resonance imaging (MRI) has become a clinically useful complement to ultrasound for fetal evaluations as it provides higher soft tissue contrast and a larger field of view. In fact, fetal MRI is now recommended by the American College of Radiology (ACR) and the Society for Pediatric Radiology (SPR) to further assess many fetal abnormalities not fully assessed by fetal ultrasound (1). As the use of fetal MRI continues to grow and with the increasing use of 3T, further guidelines for the safe use of MRI for fetal evaluations have been introduced (2,3).
The determination of fetal MRI safety involves the assessment of the biological risks to the fetus associated with all aspects of the MRI examination, but potential heating from the applied radiofrequency (RF) fields is a prominent concern since temperature increases can cause fetal harm (4,5). To protect against this, the IEC limits pregnant human subjects exposure to whole body RF transmission by defining a normal operating mode whole-body specific absorption rate (SAR) of 2 W/kg (6). While whole-body SAR can be measured from total applied power, extensive modeling or invasive measurements are needed to translate these limits to local SAR and local heating.
Two invasive studies used porcine models to measure local temperature change within the pregnant uterus following RF exposure during MRI (7,8). Measurements were performed using temperature probes placed in the fetal brain, fetal abdomen and amniotic sac while the mother pig was under anesthesia. Levine et al. (7) reported no significant temperature change at the end of a ~5 minute half-Fourier single-shot turbo spin-echo (HASTE) acquisition at 1.5T, a commonly used protocol for fetal imaging. In another study, Cannie et al. (8) performed measurements for different SAR 3T regimens and reported temperature increases approaching critical values (i.e. >1°C) during high SAR regimens (i.e. 4W/kg whole body average SAR) lasting longer than 30 minutes, while during normal-mode SAR regimens (i.e. 2W/kg whole body average SAR) the increase remained below 1°C. However, it is difficult to extrapolate these studies to human fetuses due to differences in conductive tissue morphology and the effect of general anesthesia on physiology, temperature regulation and blood perfusion in the porcine studies.
Because of the difficulties of translating the results of invasive studies to the clinical case, most of the work on RF safety has been performed in electromagnetic simulation platforms using pregnant body models and RF coil models (9–16). Different pregnant body models covering a population with different body habitus, maternal and fetal body positions, and gestational age need to be investigated to achieve a reliable safety assessment and to better understand the local SAR variation in the patient population (17). Unfortunately, current work is limited to a few pregnant body models. The models are often built by merging uterus/fetal models with existing supine position non-pregnant body models (18–21), or by scaling for different pregnancy stages (9,13,14).
This study verifies the need to extend the variety of body models available for MR safety studies in pregnancy and extends the models available. We generate 12 new models with different body habitus and maternal and fetal body positions and evaluate the effect of model differences on local SAR.
Method
Anatomical Models
Informed consent was obtained from four pregnant subjects, one whom was scanned twice (once in supine position and again in a left lateral position). The scans used a 3T Skyra scanner (Siemens Healthcare, Erlangen, Germany) and a combined 18-channel body matrix and 12-channel spine-receive arrays. This scanner has a 70cm diameter patient bore. A total of 248 axial HASTE images were acquired with TR/TE = 1600ms/117ms, 2.6×2.6 mm2 in plane resolution and 3 mm slice thickness. The interleaved acquisition of 2D slices results in motion artifacts between the slice stacks. To alleviate this motion artifact, we separated the imaging volume into the three stacks of time-sequential slices and then applied 3D linear interpolation to each stack to generate an image volume from each stack. We compared these reconstructed volumes and removed the stack with the most motion before recombining the remaining two stacks. After this operation, volumes were interpolated to 2×2×2 mm3 resolution, which is consistent with other body models in the literature (20,22). Resampled volumes were manually segmented in ITK Snap (23) to identify tissue types in mother and fetus. Further motion artifacts at the organ boundaries were corrected manually. A smoothing kernel of 3 voxels was applied to each segmented tissue to smooth out the tissue boundaries (17).
Table 1 lists the 12 body models and describes the subjects and maternal positions used. Each model name is designated by the subject number, maternal position (S=supine or L=Left lateral), maternal BMI and arm position information. For patient comfort, we allowed the subjects to place their arms in the position of maximal comfort. Most preferred to lie with their arms above their chest. Only subject 4 (also lowest BMI) chose to place her arms by her side while lying on her back. Thus, the model name designates whether the arms have been removed or otherwise outside of the imaging FOV (NA for “no arms”), arms on the chest (OC), arms at side (AS), or ASwS for “arms at side with shift” of 5cm. In cases where the fetus was manually rotated within the model, the name designates the rotation angle.
Table 1:
Subject properties, their positions during MRI scan, model IDs generated for each subject.
| Subjects | Model ID | Position | Maternal BMI | GA | Arms Position | Fetus # |
|---|---|---|---|---|---|---|
| Subject1 | BCH1-S-BMI42-NA (BCH1) | Supine | 42 | 28 | No arms (above chest) | 1 |
| Subject2 | BCH2-L-BMI26-NA (BCH2) | Left | 26 | 27 | No arms (above chest) | 2 |
| Subject3 | BCH3-S-BMI28-NA (BCH3) | Supine | 28 | 35 | No arms (above chest) | 1 |
| Subject4 | BCH4-S-BMI20-AS (BCH4-1-1) | Supine | 20 | 29 | At side | 1 |
| BCH4-S-BMI23-AS (BCH4-1-2) | Supine | 23 | 29 | At side | 1 | |
| BCH4-S-BMI20-ASwS (BCH4-1-3) | Supine | 20 | 29 | At side, with shif (up, anterior direction) | 1 | |
| BCH4-S-BMI23-ASwS (BCH4-1-4) | Supine | 23 | 29 | At side, with shift (up, anterior direction) | 1 | |
| BCH4-S-BMI20-NA-0° (BCH4-2-1) | Supine | 20 | 29 | No arms (removed) | 1 | |
| BCH4-S-BMI20-NA-20° (BCH4-2-2) | Supine | 20 | 29 | No arms (removed) | 1 | |
| BCH4-S-BMI20-NA-160° (BCH4-2-3) | Supine | 20 | 29 | No arms (removed) | 1 | |
| BCH4-S-BMI20-NA-180° (BCH4-2-4) | Supine | 20 | 29 | No arms (removed) | 1 | |
| Subject4 | BCH5-L-BMI20-OC (BCH5) | Left | 20 | 29 | On the chest | 1 |
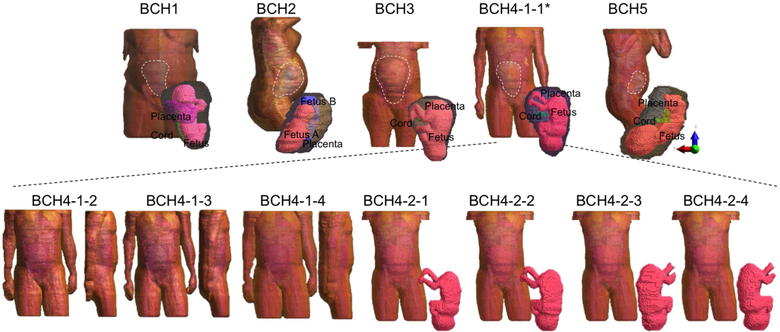
The model generated from subject 4’s supine position scan was modified to provide a version with removed arms (BCH4-S-BMI20-NA). We also derived a version of subject 4 by morphing the fat tissue to generate an additional model with BMI of 23. Finally, additional fetal positions for subject 4 were generated by rotating the fetus within the uterus. The model name indicates the clockwise rotation of the fetus around the scanner z-axis. Note that, while reporting the results we used the shortened names for each model listed in parenthesis in Table 1 under Model ID column.
Figure 1 shows the steps of the model generation. Only 6 tissue types were segmented within the uterus: fetus, fetal brain, umbilical cord, amniotic fluid, placenta and uterine wall. For the mother, 20 tissue types were segmented: muscle, fat, skin, bone, lungs, heart, liver, stomach, spleen, kidney, pancreas, gallbladder, large intestine, small intestine, rectum, vagina, bladder, aorta and vena cava, spinal cord and intervertebral discs. Thus, each model has 26 tissues/organs except the models generated with the data collected from Subject 4 who did not have a gallbladder. Since the resolution and contrast was inadequate to distinguish the ribs, ribs were excluded. A radiologist verified the position and shape of identified tissues.
Figure 1:
Steps for model generation
In addition to the models generated in this study, we examined the pregnant human model “Ella” (at 7 months of gestation) from the Virtual Population (i.e. IT’IS 7M) (21,24). Besides simulating the original IT’IS 7M model (i.e. IT’IS-7M-O), we simulated a more homogenous version of it (i.e. IT’IS-7M-H), to be consistent with our models such that the fetal body in IT’IS 7M was rendered homogeneous by assigning the same conductivity and dielectric properties to each fetal organ.
Electromagnetic simulations
Electromagnetic (EM) simulations were performed in Sim4Life Version 3.0.1 (ZMT, Zurich, Switzerland). The simulations used a two-port feed coil model with 32 rungs 123.2 MHz resonant shielded high-pass birdcage coil (714 mm diameter and 450 mm length). The feed ports were placed 90° apart in the head-side end-ring. We assigned a relative phase of 90° and amplitude of 1 to the ports for a circularly polarized (CP) mode exposure. Each segmented body model was uploaded as a raw file to Sim4life together with its associated descriptor file. The dielectric tissue properties for maternal tissues were assigned according to the IT’IS database (www.itis.ethz.ch/database). The bones were assigned the electrical properties of bone marrow following previous work (15). Dielectric tissue properties for homogenous fetus and fetal brain tissues were assigned as suggested in (15). Amniotic fluid conductivity and relative permittivity values were assigned as 1.4 S/m and 74 following (25).
Based on the subjects’ MR images, the iso-center in A-P direction was measured as 13.6 cm away from the scanner table surface and the models were positioned accordingly. The center of the coil was right over the fetus. For each model, a broadband RF sweep was simulated to monitor for any change in the coil tuning. The variable EM solver grid size was kept < 3.5 mm within the birdcage coil. The generated voxels were checked using the voxel visualization and connectivity analysis toolbox in the Sim4Life package.
For the inter-subject SAR comparison, the local SAR results are reported as the local power deposition (in 10g) at the maximum allowable (normal operating mode) whole body SAR of 2 W/kg. For the normal operating mode normalization, the subjects’ whole body weights were used. The peak local SAR per 10g of tissue (pSAR10g) in maternal trunk, fetus, fetal brain, and amniotic fluid was calculated as the peak spatial SAR averaged over the mass of 10 g of tissue in Sim4life. Additionally, average SAR (aveSAR) over maternal trunk, fetus, fetal brain and amniotic fluid was calculated by calculating the total absorbed power in these tissues and dividing by their mass. The mass was calculated using the voxel volume and assigned density for each voxel in the ROI in Sim4life.
The magnitude of electric field and B1+(i.e. |B1+|) were calculated when whole body aveSAR was set to 2 W/kg. To report the |B1+| in the uterus (i.e., ), the average value was estimated when the uterus was selected as a region of interest.
For comparisons where groups of 3 or more models were compared to other groups, we employed Student’s t-test and linear regression. Statistical analyses were performed using Prism 6.0g (GraphPad Software, San Diego, CA). P < 0.05 was considered statistically significant.
Results:
Anatomical models
Figure 2 shows the body models, with the five unique subject models in top row. The models of uterus, placenta and fetuses are shown as an inset in the same figure. The seven models shown in the lower row were generated using the fourth model in the upper row. In the last four of these seven, the fetus was rotated as shown in the inset figures.
Figure 2:
Pregnant Body Models: Models generated from 4 different subjects (upper row); Models modified from BCH4-1-1 by extending the maternal fat volume, shifting the arms upwards in the anterior direction, extending the volume and shifting the arms, removing the arms, rotating the fetus by an angle of 20°, 160° and 180° clockwise around the scanner z-axis, from left to right (lower row).
Electromagnetic simulations
SAR estimates for different body models
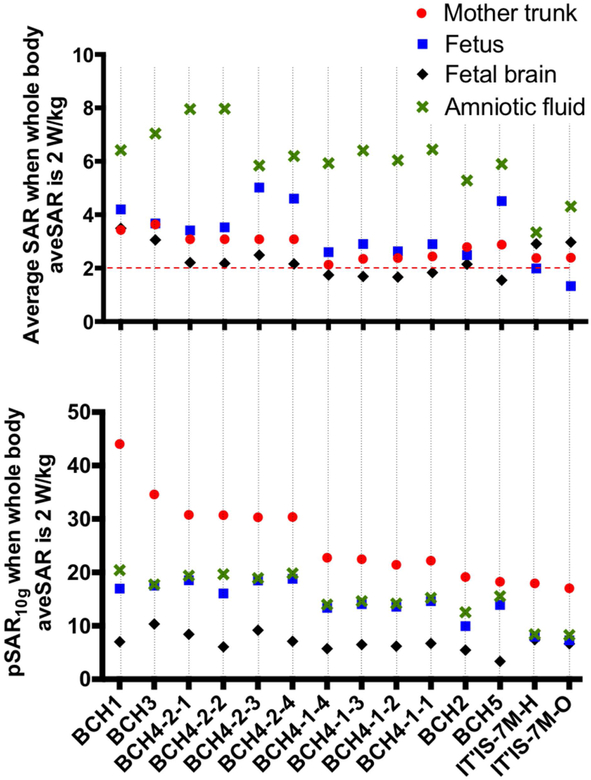
Figure 3 shows normalized pSAR10g and aveSAR values estimated in mother trunk, fetus, fetal brain, and amniotic fluid. Estimated pSAR10g values reach up to 44 W/kg in mother trunk, 18 W/kg in fetus, 10 W/kg in fetal brain and 20 W/kg in amniotic fluid within the developed models. Averaging over all models, pSAR10g in the mother trunk, fetus, fetal brain and amniotic fluid was estimated as 27.25±7.55 W/kg (min: 19.14 W/kg; max: 44.03 W/kg), 15.48±2.7 W/kg (min: 9.93 W/kg; max: 18.79 W/kg), 6.84±1.83 W/kg (min: 3.36 W/kg, max: 10.3 W/kg), and 16.82±2.77 W/kg (min: 12.55 W/kg, max: 20.4 W/kg), respectively. The lowest pSAR10g in the fetus was observed in model BCH2, twin pregnancy, and the lowest pSAR10g in the fetal brain was observed in model BCH5. For IT’IS 7M, pSAR10g in mother trunk, fetus, fetal brain and amniotic fluid was estimated as 17.93 W/kg, 7.95 W/kg, 7.42 W/kg, and 8.43 W/kg, respectively. These values are lower than the values estimated in our in-house built body models. Including all models the fetal pSAR10g changes are in the range of 7.95 W/kg to 18.79 W/kg. Note that the local SAR is not limited by the IEC standard for volume transmit coils (6). Models holding maternal arms at side and models placed at left lateral position have lower fetal pSAR10g values compared to supine without arms at the side. Effect of maternal arm positioning, fetal and maternal body positions and maternal body habitus on pSAR10g and aveSAR are discussed below in detail.
Figure 3:
Normalized average SAR and pSAR10g estimated in mother trunk, fetus, fetal brain, and amniotic fluid for each model.
Effect of maternal position
Rotating the mother from supine to left-lateral position in the bore:
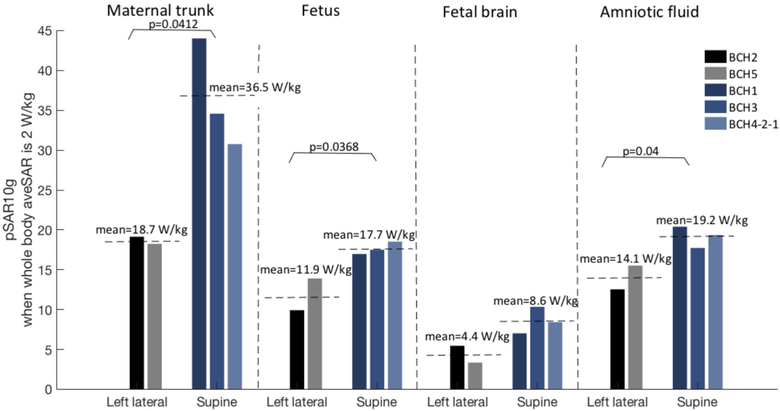
Figure 4 shows the comparison of pSAR10g estimated in mother trunk, fetus, fetal brain, and amniotic fluid for the models grouped according to maternal positions in the bore. Note that for supine position only the models with arms up have been included (i.e., BCH1, BCH3, BCH4-2-1) to exclude the effect of the maternal arm position. For the models in the left lateral position, lower pSAR10g values were estimated compared to models in supine position. The decreases were significant for mother trunk, fetus and amniotic fluid (P=0.0412, P=0.0368 and P=0.04, respectively).
Figure 4:
Normalized pSAR10g values in mother trunk, fetus, fetal brain, and amniotic fluid for the models in left lateral and supine positions.
Altering the maternal arm position:
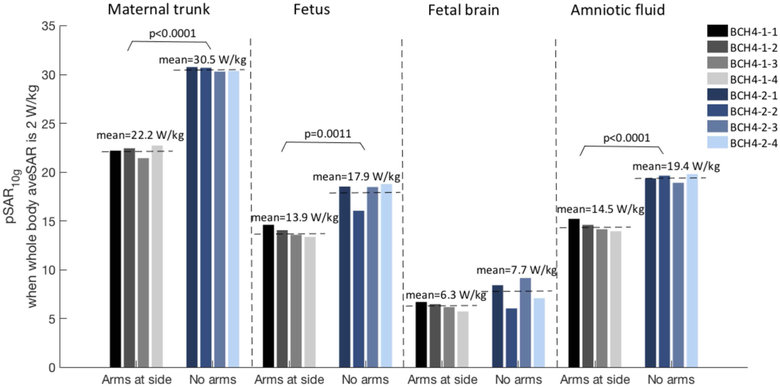
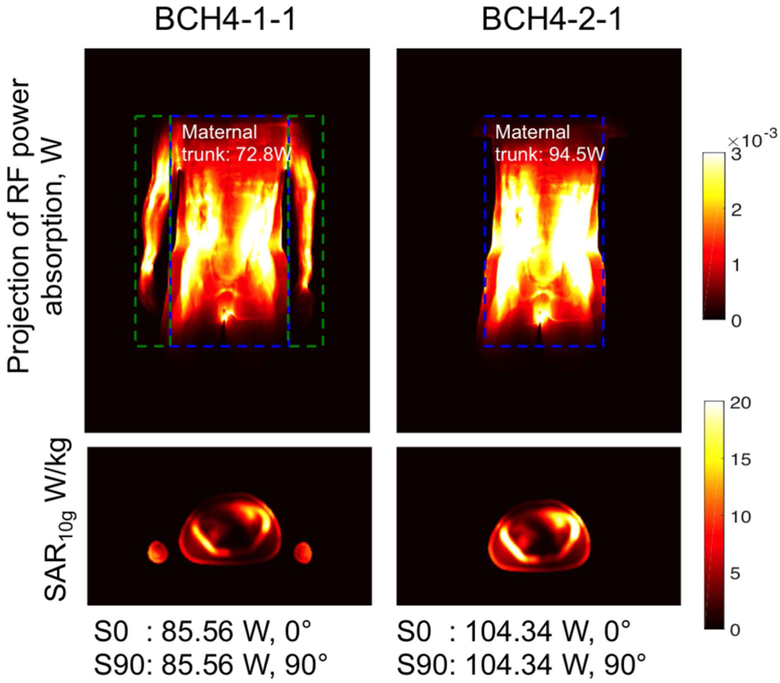
Figure 5 shows the comparison of pSAR10g estimated in mother trunk, fetus, fetal brain, and amniotic fluid for the models generated from subject 4 and grouped according to the maternal arm position. Lower pSAR10g values were estimated in the models with the arms at side due to the fact that the RF power absorption was distributed in the maternal trunk and the arms. Lower RF power absorption was estimated in maternal trunk in the models with arms at side compared to the ones with arms up after the normalization for normal operating mode (Figure 6). The decrease in pSAR10g was significant for mother trunk, fetus and amniotic fluid (P<0.0001, P=0.0011 and P<0.0001, respectively). Note that removing arms from BCH4-1-1 didn’t change the location of the pSAR10g in fetus, fetal brain or amniotic fluid in the other models. In IT’IS-7M-H, similar to BCH4-1-1, RF power absorption was distributed in the maternal trunk (83.7 W) and arms (35.92 W), which resulted in lower pSAR10g estimates in maternal trunk, fetus, and amniotic fluid compared to the other models without arms at side in supine position (i.e., BCH1, BCH4-2-1).
Figure 5:
Normalized pSAR10g values in mother trunk, fetus, fetal brain, and amniotic fluid for the models with arms at side and no arms.
Figure 6:
A projection of RF power absorption in x-y plane and spatial SAR averaged over 10 g of tissue (SAR10g) in the transversal-center slice for BCH4-1-1 and BCH4-2-1 after the normalization to 2W/kg whole body average SAR with the normalization factors indicated at the end of each column.
Additionally, shifting the arms upwards in the anterior direction (BCH4-1-3) decreased the pSAR10g in fetus (7%), fetal brain (8%) and amniotic fluid (7%) compared to BCH4-1-1.
Effect of rotating the fetus in the uterus
Rotating the fetus 20° decreased the pSAR10g in fetus by 13% and fetal brain by 28% and slightly increased the pSAR10g in amniotic fluid (1.4%) compared to the original position. After 160° rotation of the fetus, there is only a slight change in pSAR10g values in fetus (0.3% decrease) and fetal brain (8% increase). In contrast, aveSAR in amniotic fluid decreased by 27% and in fetus increased by 47%. 180° rotation of the fetus decreased the pSAR10g in fetal brain by 18% while slightly increasing the pSAR10g in fetus (1.4%) and amniotic fluid (2.3%). Similar to 160° rotation, with 180° rotation aveSAR in amniotic fluid decreased by 22% and in fetus increased by 35%. To understand these changes it is important to note that although rotation of the fetus only slightly changed fetal position relative to the coil, it changed the amniotic fluid distribution around the fetus while the amount of the fluid remains the same. After fetal rotation, the relative position of the conductive amniotic fluid and the less conductive placenta changed. This appears to modulate the total power absorption in the fetus.
Effect of maternal body habitus
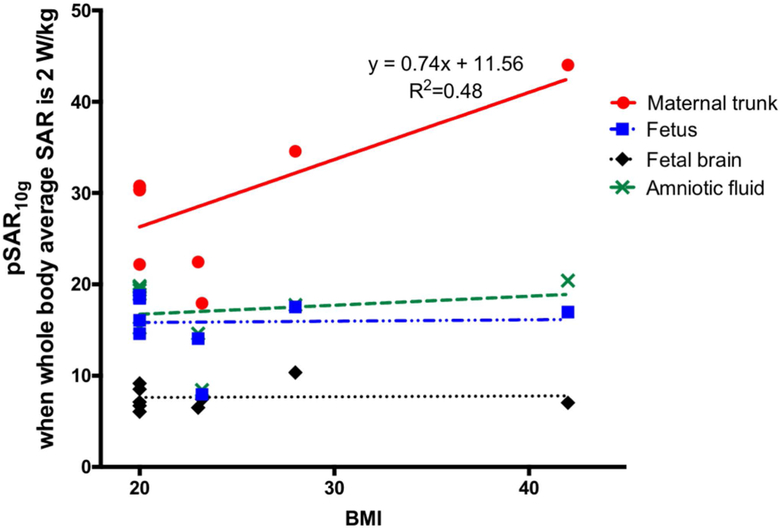
We observed a positive linear relationship only between pSAR10g in maternal trunk and maternal BMI as shown in Figure 7 such that pSAR10g in maternal trunk increased with maternal BMI at a rate of 0.74. The slope was significantly different from zero, with P=0.04, R2=0.48. On the other hand there is no significant correlation between maternal BMI and pSAR10g in fetus, amniotic fluid or fetal brain.
Figure 7:
Change in normalized pSAR10g with maternal BMI for the models in supine position.
Extending maternal fat volume in BCH4–1-2 slightly decreased the pSAR10g in fetus (1.6%), fetal brain (7.4%) and amniotic fluid (1.5%) and increased the pSAR10g in maternal trunk (2.4%) compared to BCH4-1-1.
EM field distribution in different body models
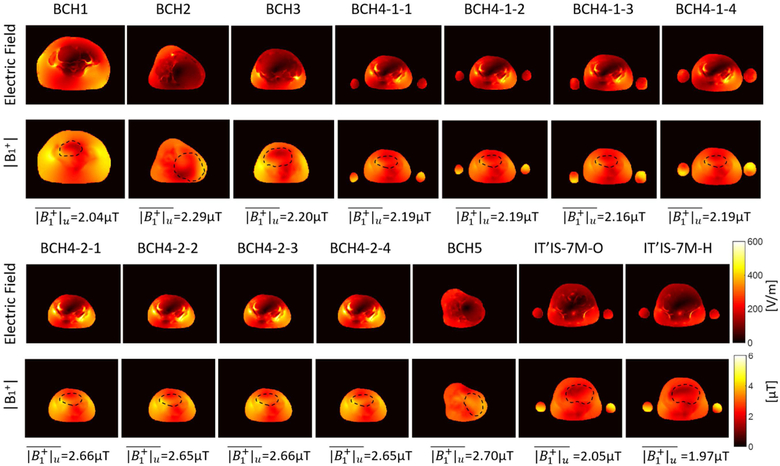
Figure 8 shows the spatial variation in the magnitude of electric field and B1+ in iso-center slice when whole body aveSAR is 2 W/kg. For each subject, average | B1+| in the uterus was reported at the bottom of each column and also in Supporting Information Table S1. Uterus position was indicated with black dashed circle on | B1+| maps. For the models with arms at side (BCH4–1), average | B1+| estimate in the uterus was lower compared to the ones with no arms (BCH-4–2). Similarly for those models with arms at side pSAR10g in the fetus was lower compared to the ones with no arms. On the other hand when the models for the subject (subject 4) at different maternal positions were compared, the average | B1+| estimate in the uterus was higher for the model in left lateral position (BCH5) compared to the model in supine position (BCH4–2) while pSAR10g in the fetus was lower for the model in left lateral position (BCH5) compared to the model in supine position (BCH4–2). Note that, magnitude of electric field was lower in the models in left lateral position (i.e. BCH2, BCH5) compared to the models in supine position.
Figure 8:
Magnitude of E-field and B1+ in iso-center slice when whole body average SAR is 2 W/kg..
Average SAR estimates during a clinical fetal examination
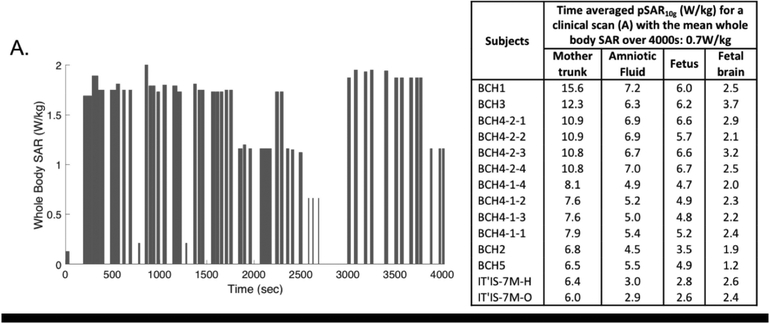
Figure 9 shows an example of whole body SAR versus time recorded during a clinical fetal scan for which the time averaged whole body SAR over the scan duration of 4000s was 0.7 W/kg. In the same figure, the corresponding time averaged pSAR10g values for mother trunk, amniotic fluid, fetus and fetal brain for each model are reported. We obtained proportionally lower time-averaged pSAR10g values compared to the values achieved for whole body SAR of 2 W/kg while the whole-body SAR to local or regional SAR ratios reported were unaffected.
Figure 9:
Maternal whole-body SAR versus time recorded during a clinical fetal scan (including different sequences with various power levels and duty cycles) over a period of 4000s total scan duration and the corresponding time averaged pSAR10g values.
Discussion and Conclusion
In this study, we built realistic pregnant body models using MR images of subjects with different body habitus, and body position, performed EM simulations using these models and investigated the inter-subject variation in pSAR10g and aveSAR values in mother, fetus, fetal brain and amniotic fluid. We found a significant variation in pSAR10g values in the mother trunk (min: 19.14 W/kg; max: 44.03 W/kg), fetus (min: 9.93 W/kg; max: 18.79 W/kg), fetal brain (min: 3.36 W/kg, max: 10.3 W/kg), and amniotic fluid (min: 12.55 W/kg, max: 20.4 W/kg) within these models. This large variation shows that a variety of models are needed to better understand SAR distributions in pregnant mothers and to fully characterize an individual subject’s safety.
We also explored the effect of maternal positioning during the scan. We observed that maternal positioning in the scanner affected pSAR10g such that the lowest pSAR10g in maternal trunk and fetus was computed for the subjects at the left lateral position. We also observed that keeping the arms at side during the scan decreased pSAR10g in maternal trunk, fetus, fetal brain and amniotic fluid (while it remained high in the arms) as the RF power deposition was distributed over a larger volume (i.e. maternal trunk and arms). Although the SAR implications of changing maternal posture from supine to lateral have not been previously examined, multiple studies have examined the effect of shifting a body model within the body coil with pregnant (11,26) and non-pregnant models (11) or changing the arms position with non-pregnant models (27,28). Non-pregnant body models with different postures (i.e. sitting position) have been only developed and used to explore posture effects on SAR estimation for applications different than MRI (e.g. wireless communication devices) (29–33). The effect of maternal position needs to be further investigated with additional models built by using the same subject in multiple different maternal postures.
Fetal rotational movement resulted in a fetal pSAR10g change of up to 47% and a fetal aveSAR change up to 28%. A previous study showing the effect of a 17 mm fetal shift (34) reported a change of only up to 5% in pSAR10g in fetal tissue. A more recent study (35) investigated the effect of fetal rotation (i.e. head down, head up, head down and 20° rotated) on the temperature change and reported a decrease in the fetal peak temperature only after 20° rotation. In our model, the changes in SAR are likely related to the change in the distribution of the conductive amniotic fluid around the fetus. Thus fetal motion, which results in changes in the distribution of amniotic fluid around the fetus, can result in changes in how the fetus is shielded from the electric field and thus altered SAR distribution and levels. The potential magnitude of this effect needs to be further explored with additional models with changing amounts of amniotic fluid such as in polyhydramnios. Note that fetal motion may impose a temporal averaging effect that could either decrease or increase time-averaged pSAR10g and aveSAR compared to the initial values in the stationary position according to the distribution of time spent in regions of high or low pSAR10g and aveSAR. This was not modeled in the current study.
Finally, we also investigated the impact of maternal habitus on SAR distribution. We observed an increase in pSAR10g in the maternal trunk with increasing maternal BMI. Similarly, a previous study with non-pregnant body models (17) reported the highest pSAR10g in a model with highest BMI. However, we didn’t find a correlation between maternal BMI and pSAR10g in fetus, amniotic fluid and fetal brain. Thus, maternal BMI is unlikely to have a significant independent effect on fetal SAR distribution.
As this study mainly concentrates on the relationship between whole-body SAR and the local SARs in the mother and fetus, the local and regional SAR values were reported for a power level and duty cycle corresponding to a whole body aveSAR at the regulatory limit of 2 W/kg. In other words we reported the local and regional SARs assuming imaging parameters are set to give a whole body SAR of 2 W/kg (e.g. the single shot fast spin echo (SSFSE) sequences, repeated at maximum allowed duty-cycle with no additional pauses to locate and prescribe the slice orientation). In practice, a combination of different acquisitions with varying whole-body SAR values (<= 2 W/kg) and additional pauses between acquisitions will proportionally lower time-averaged SAR values as we demonstrated with an example scenario. However, in this more realistic scenario, the ratio of whole-body SAR to local or regional SAR remains the same as when we used a constant whole body SAR of 2W/kg. Thus, different acquisition strategies will result in different whole-body SAR values but the data provided here on the ratios will remain accurate and informative.
While this study examines local and regional SAR values estimated at 3T, it can not be assumed that local SAR is lower at 1.5T.
A limitation of the study stemmed from the use of MR images in pregnant subjects to form the additional body models. This led to truncated models with limited number of maternal tissue types compared to the models presented in previous studies (10,11). However, in an earlier study, Homann et al. (27) demonstrated that the SAR pattern of a simplified model with muscle, fat and lung tissues is highly consistent with a fully segmented whole-body model during 3T abdominal imaging. Wolf et al. (36) explored the effect of truncated models in brain SAR simulations including only the shoulders outside the coil while excluding the rest of the body, and compared the results with the whole body simulations. They observed pSAR10g at the same location in the head with an increase less than 1.7% in the truncated model. Similarly, we kept the size of all the truncated models longer that the coil length by at least 15% in each direction. Additionally, we note that the power absorption outside of the coil volume was less than 4% for the full-body IT’IS 7M model. We calculated higher SAR values in the IT’IS 7M model compared to the ones reported in (11). The effect of tissue class simplification could be tested in the IT’IS 7M model, in this case by comparing SAR before and after simplifying that model. Reducing IT’IS 7M to a homogeneous fetus model increased pSAR10g in the fetus by 9.3% similar to the previous study (34). Thus, using truncated body models with limited number of maternal and fetal tissues as used here are likely to result in only a small overestimation of pSAR10g. Note that tissue parameters in the uterus may change with different factors such as the gestational age, tissue water and phospholipid contents (37,38), which was not within the scope of this study.
The Student t-tests reported were performed on relatively small N sample sizes of unknown underlying distribution. While the Student t distribution is wider than a Gaussian distribution and therefore considered relatively conservative, care must be taken in assessing the results of this (or any) statistical comparison.
In summary, we investigated the effect of anatomical variations, maternal body habitus, and body position on pSAR10g and aveSAR. The variation in the fetal pSAR10g between subjects (9.93 W/kg-18.79 W/kg for 2W/kg whole body average SAR) emphasizes the need for different anatomical models for better SAR management of individuals. Both maternal and fetal position contributed significantly to these variations but maternal habitus did not significantly affect fetal SAR distribution. Since global power measurements are the only SAR metric monitored during the MR examination, further studies are needed to better understand the variations in local power deposition across the subject population. Pregnant body models will be available on our webpages. (https://phantoms.martinos.org/Main_Page#MGH_voxel_numerical_models_for_download and https://github.com/FNNDSC).
Supplementary Material
Acknowledgments:
The authors would like to thank the division senior biostatistician, Henry A. Feldman, PhD at Boston Children’s Hospital for his input on statistical analysis performed in this study. This work was supported by the National Institutes of Health (NIH); grant numbers: U01 HD087211, R01 EB017337.
Footnotes
Supporting table caption
Supporting Information Table S1: pSAR10g and aveSAR values estimated in mother trunk, amniotic fluid, fetus and fetal brain for each model when whole body average SAR is 2 W/kg and average |B1+| estimated in whole uterus.
References
- 1.American College of Radiology (ACR) and the Society for Pediatric Radiology (SPR). ACR-SPR practice guideline for the safe and optimal performance of fetal magnetic resonance imaging (MRI). Resolution 2010;13:4. [Google Scholar]
- 2.The International Commission on Non-Ionizing Radiation Protection. MEDICAL MAGNETIC RESONANCE (MR) PROCEDURES: PROTECTION OF PATIENTS. Health Phys 2004;87:197. [DOI] [PubMed] [Google Scholar]
- 3.Health Protection Agency (HPA). Protection of Patients and Volunteers Undergoing MRI Procedures.; 2008. [Google Scholar]
- 4.Chambers CD, Johnson KA, Dick LM, Felix RJ, Jones KL. Maternal fever and birth outcome: a prospective study. Teratology 1998;58:251–257. [DOI] [PubMed] [Google Scholar]
- 5.Edwards MJ. Review: Hyperthermia and fever during pregnancy. Birth Defects Res. A Clin. Mol. Teratol 2006;76:507–516. [DOI] [PubMed] [Google Scholar]
- 6.International Electrotechnical Commission. Medical electrical equipment-Part 2–33: Particular requirements for the basic safety and essential performance of magnetic resonance equipment for medical diagnosis. IEC 60601-2-33 Ed. 3.0; 2010. [Google Scholar]
- 7.Levine D, Zuo C, Faro CB, Chen Q. Potential heating effect in the gravid uterus during MR HASTE imaging. J. Magn. Reson. Imaging 2001;13:856–861. [DOI] [PubMed] [Google Scholar]
- 8.Cannie MM, De Keyzer F, Van Laere S, et al. Potential Heating Effect in the Gravid Uterus by Using 3-T MR Imaging Protocols: Experimental Study in Miniature Pigs. Radiology 2016;279:754–761. [DOI] [PubMed] [Google Scholar]
- 9.Shamsi S g., Wu D, Chen J, Liu R, Kainz W SAR Evaluation of Pregnant Woman Models in 64 MHz MRI Birdcage Coil. In: 2006 IEEE MTT-S International Microwave Symposium Digest. ieeexplore.ieee.org; 2006. pp. 225–228. [Google Scholar]
- 10.Hand JW, Li Y, Hajnal JV. Numerical study of RF exposure and the resulting temperature rise in the foetus during a magnetic resonance procedure. Phys. Med. Biol 2010;55:913–930. [DOI] [PubMed] [Google Scholar]
- 11.Murbach M, Neufeld E, Samaras T, et al. Pregnant women models analyzed for RF exposure and temperature increase in 3TRF shimmed birdcages: Impact of RF Shimming on MRI Exposure of Pregnant Women. Magn. Reson. Med 2017;77:C1–C1. [DOI] [PMC free article] [PubMed] [Google Scholar]
- 12.Kikuchi S, Saito K, Takahashi M, Ito K. Temperature elevation in the fetus from electromagnetic exposure during magnetic resonance imaging. Phys. Med. Biol 2010;55:2411–2426. [DOI] [PubMed] [Google Scholar]
- 13.Wang Z, Xu GX, Taracila V, Jin J, Robb FJ. Numerical evaluation of SAR within whole-body pregnant woman models in MRI birdcage coil. In: Proc. Intl Soc. Magn. Reson. Med Vol. 17 cds.ismrm.org; 2009. p. 300. [Google Scholar]
- 14.Wu D, Shamsi S, Chen J, Kainz W. Evaluations of specific absorption rate and temperature increase within pregnant female models in magnetic resonance imaging birdcage coils. IEEE Trans. Microw. Theory Tech 2006;54:4472–4478. [Google Scholar]
- 15.Hand JW, Li Y, Thomas EL, Rutherford MA, Hajnal JV. Prediction of specific absorption rate in mother and fetus associated with MRI examinations during pregnancy. Magn. Reson. Med 2006;55:883–893. [DOI] [PubMed] [Google Scholar]
- 16.Saito K, Kikuchi S, Takahashi M, Ito K, Ikehira H. SAR distributions in the abdomen of a pregnant woman generated in a bird cage coil for the MRI system In: 2006 First European Conference on Antennas and Propagation. ; 2006. pp. 1–4. [Google Scholar]
- 17.Murbach M, Neufeld E, Kainz W, Pruessmann KP, Kuster N. Whole-body and local RF absorption in human models as a function of anatomy and position within 1.5 T MR body coil. Magn. Reson. Med 2014;71:839–845. [DOI] [PubMed] [Google Scholar]
- 18.Nagaoka T, Togashi T, Saito K, Takahashi M, Ito K, Watanabe S. An anatomically realistic whole-body pregnant-woman model and specific absorption rates for pregnant-woman exposure to electromagnetic plane waves from 10 MHz to 2 GHz. Physics in Medicine & Biology 2007;52:6731. [DOI] [PubMed] [Google Scholar]
- 19.Xu XG, Taranenko V, Zhang J, Shi C. A boundary-representation method for designing whole-body radiation dosimetry models: pregnant females at the ends of three gestational periods—RPI-P3,-P6 and-P9. Physics in Medicine & Biology 2007;52:7023. [DOI] [PubMed] [Google Scholar]
- 20.Cech R, Leitgeb N, Pediaditis M. Fetal exposure to low frequency electric and magnetic fields. Phys. Med. Biol 2007;52:879–888. [DOI] [PubMed] [Google Scholar]
- 21.Gosselin M-C, Neufeld E, Moser H, et al. Development of a new generation of high-resolution anatomical models for medical device evaluation: the Virtual Population 3.0. Phys. Med. Biol 2014;59:5287–5303. [DOI] [PubMed] [Google Scholar]
- 22.Nagaoka T, Saito K, Takahashi M, Ito K, Watanabe S. Anatomically realistic reference models of pregnant women for gestation ages of 13, 18, and 26 weeks. Conf. Proc. IEEE Eng. Med. Biol. Soc 2008;2008:2817–2820. [DOI] [PubMed] [Google Scholar]
- 23.Yushkevich PA, Piven J, Hazlett HC, et al. User-guided 3D active contour segmentation of anatomical structures: significantly improved efficiency and reliability. Neuroimage 2006;31:1116–1128. [DOI] [PubMed] [Google Scholar]
- 24.Christ A, Guldimann R, Bühlmann B, et al. Exposure of the human body to professional and domestic induction cooktops compared to the basic restrictions. Bioelectromagnetics 2012;33:695–705. [DOI] [PubMed] [Google Scholar]
- 25.Peyman A, Gabriel C. Dielectric properties of rat embryo and foetus as a function of gestation. Phys. Med. Biol 2012;57:2103–2116. [DOI] [PubMed] [Google Scholar]
- 26.Saito K, Kikuchi S, Takahashi M, Ito K, Ikehira H. SAR estimations of pregnant woman during MR imaging for abdomen by numerical calculations. In: 2007 18th International Zurich Symposium on Electromagnetic Compatibility. ieeexplore.ieee.org; 2007. pp. 45–48. [Google Scholar]
- 27.Homann H, Börnert P, Eggers H, Nehrke K, Dössel O, Graesslin I. Toward individualized SAR models and in vivo validation. Magn. Reson. Med 2011;66:1767–1776. [DOI] [PubMed] [Google Scholar]
- 28.Wang Z, Penney CW, Luebbers RJ, Collins CM. Poseable Male and Female Numerical Body Models for Field Calculations in MRI. In: Proc. Intl Soc. Magn. Reson. Med ; p. 75. [Google Scholar]
- 29.Findlay RP, Dimbylow PJ. FDTD calculations of specific energy absorption rate in a seated voxel model of the human body from 10 MHz to 3 GHz. Phys. Med. Biol 2006;51:2339–2352. [DOI] [PubMed] [Google Scholar]
- 30.Findlay RP, Dimbylow PJ. Effects of posture on FDTD calculations of specific absorption rate in a voxel model of the human body. Phys. Med. Biol 2005;50:3825–3835. [DOI] [PubMed] [Google Scholar]
- 31.Uusitupa T, Laakso I, Ilvonen S, Nikoskinen K. SAR variation study from 300 to 5000 MHz for 15 voxel models including different postures. Phys. Med. Biol 2010;55:1157–1176. [DOI] [PubMed] [Google Scholar]
- 32.Nagaoka T, Watanabe S. Voxel-Based Variable Posture Models of Human Anatomy. Proc. IEEE 2009;97:2015–2025. [Google Scholar]
- 33.Shimamoto T, Laakso I, Hirata A. In-situ electric field in human body model in different postures for wireless power transfer system in an electrical vehicle. Phys. Med. Biol 2015;60:163–173. [DOI] [PubMed] [Google Scholar]
- 34.Malik SJ, Hand JW, and Hajnal JV. The effect of variable amniotic fluid conductivity and fetal tissues properties on B1+ and local SAR for fetal imaging at 3T. In: Proc Intl Soc Mag Reson Med ; 2017. p. 5578. [Google Scholar]
- 35.Malik SJ, Hand JW, and Hajnal JV. The effect of fetal dielectric properties, position and blood-flow in maternal tissues on fetal temperature for fetal MRI at 3T. In: Proc Intl Soc Mag Reson Med ; 2018. p. 1460. [Google Scholar]
- 36.Wolf S, Diehl D, Gebhardt M, Mallow J, Speck O. SAR simulations for high-field MRI: how much detail, effort, and accuracy is needed? Magn. Reson. Med 2013;69:1157–1168. [DOI] [PubMed] [Google Scholar]
- 37.De Luca F, Cametti C, Zimatore G, Maraviglia B, Pachì A. Use of low-frequency electrical impedance measurements to determine phospholipid content in amniotic fluid. Phys. Med. Biol 1996;41:1863–1869. [DOI] [PubMed] [Google Scholar]
- 38.Smith SR, Foster KR. Dielectric properties of low-water-content tissues. Physics in Medicine & Biology 1985;30:965. [DOI] [PubMed] [Google Scholar]
Associated Data
This section collects any data citations, data availability statements, or supplementary materials included in this article.


