

Summary
Metabolic imaging using hyperpolarized magnetic resonance can increase the sensitivity of MRI, though its ability to inform on relevant changes to biochemistry in humans remains unclear. In this work, we image pyruvate metabolism in patients, assessing the reproducibility of delivery and conversion in the setting of primary prostate cancer. We show that the time-to-max of pyruvate does not vary significantly within patients undergoing two separate injections or across patients. Furthermore, we show that lactate increases with Gleason grade. RNA sequencing data demonstrate a significant increase in the predominant pyruvate uptake transporter, monocarboxylate transporter 1. Increased protein expression was also observed in regions of high lactate signal, implicating it as the driver of lactate signal in vivo. Targeted DNA sequencing for actionable mutations revealed the highest lactate occurred in patients with PTEN loss. This work identifies a potential link between actionable genomic alterations and metabolic information derived from hyperpolarized pyruvate MRI.
Keywords: Metabolic Imaging, glycolytic flux, in vivo kinetics, hyperpolarized pyruvate
eTOC
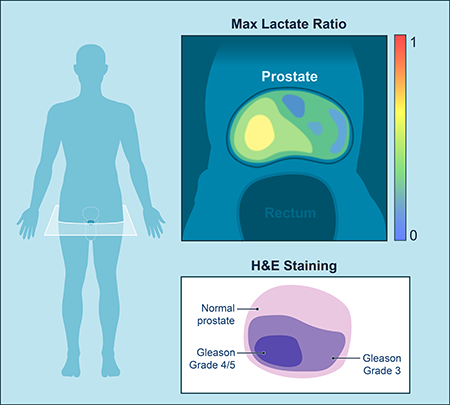
Non-invasive tools are needed to reveal metabolic phenomena in humans. In this translational study, Granlund and Tee utilize metabolic imaging to interrogate prostate cancer, finding a mechanistic link between increased metabolism and tumor grade. Thus, real-time metabolic imaging in humans can not only provide clinically relevant tools, but also uncover new biology.
Graphical Abstract
Introduction
Prostate cancer is the second most common cancer worldwide (Bray et al., 2018). Widespread use of serum prostate-specific antigen (PSA) testing and transrectal ultrasound (TRUS)-guided biopsies have raised concerns about over-diagnosis and overtreatment of potentially indolent cancers, particularly given the trend toward earlier detection and more favorable staging at the time of diagnosis (Han et al., 2001; Siegel et al., 2018). However, prostate cancer is biologically diverse, with some tumors behaving aggressively and progressing rapidly; therefore, the decision of how to best manage prostate cancer patients is complex. Risk stratification is further complicated by the manifestation of aggressive features, characteristic of high-grade disease at a late stage, presenting at earlier stages of tumor progression.
There are multiple management options for patients with localized prostate cancer, ranging from “active surveillance” when the disease is thought to be indolent and clinically insignificant to surgery, radiation therapy and a variety of focal therapies when the disease is considered more aggressive (McNeal et al., 1986). Choosing the appropriate treatment for each patient is challenging, in particular because neither the natural progression of tumors nor their response to therapy can be confidently predicted or assessed with available clinical or imaging biomarkers or risk-stratification systems (Bill-Axelson et al., 2005; Johansson et al., 2004). The ability to precisely diagnose clinically insignificant cancer (a tumor that can be left untreated and remain indolent without progression to metastasis or death) would measurably benefit patients and their families by sparing unnecessary morbidity and maintaining quality of life as well as provide tremendous cost savings to society.
While changes in metabolism have the potential to inform on prostate biology, methodologies to evaluate such changes are currently lacking. Metabolic imaging utilizing hyperpolarized (HP) magnetic resonance imaging (MRI) can address this need by enabling non-invasive measurement of metabolic substrates and their products in vivo (Golman et al., 2003; Keshari and Wilson, 2014). HP MRI detects the generation of labeled metabolic products at micromolar concentrations in short scan times without ionizing radiation. The background signal is negligible, such that the detected signal is due to the injected hyperpolarized substrate, allowing the measurement of metabolic dynamics non-invasively and in real time. This metabolic information can provide information complementary to that obtained from conventional multi-parametric MRI (Starobinets et al., 2017).
The most widely used substrate in preclinical studies has been HP [1-13C] pyruvate, which is rapidly taken up and catabolized to lactate on a time scale compatible with HP MRI (Kurhanewicz et al., 2019). Preliminary in vitro and in vivo studies in prostate cancer models suggest that increased lactate production, which is affected by uptake of pyruvate by the monocarboxylate transporters (MCT1 and MCT4) and catalyzed by lactate dehydrogenase (LDH), may be useful as a marker for prostate cancer metabolism (Albers et al., 2008; Keshari et al., 2013; Keshari et al., 2015). The safety and feasibility of imaging in vivo human prostate metabolism using HP pyruvate has been demonstrated (Nelson et al., 2013). High levels of HP lactate in regions of biopsy-proven prostate cancer suggested that HP MRI could be of great use in characterizing this disease, though the ability of HP MRI to non-invasively identify and characterize human prostate cancer lesions has yet to be validated.
In this study, we developed the necessary methodologies to image in vivo HP pyruvate metabolism, demonstrated that HP MRI of prostate metabolism is repeatable within patients, and showed that the timing of HP pyruvate delivery to prostate cancers between patients is consistent when corrected for the arterial input function. We introduced repeat injections in patients in order to evaluate test/re-test variability and demonstrated that HP MRI is safe and reproducible. We also compared the HP signal to matched step-section pathology and found that increased lactate production correlates with prostate cancer Gleason grade. Immunohistochemical analysis of tumor regions revealed up-regulated expression of the predominant pyruvate uptake transporter, monocarboxylate transporter 1 (MCT1), in patients with high lactate signal, implicating it as the driver of increased lactate signal in vivo. In support of this finding, RNA sequencing data on primary prostate cancers from The Cancer Genome Atlas cohort indicates increased expression of the predominant pyruvate uptake transporter, monocarboxylate transporter 1 (MCT1), in high-Gleason-grade prostate tumors. Interestingly, this increased lactate does not correlate strongly with traditional clinical markers of prostate cancer, suggesting possible molecular mechanisms for the increased metabolism observed (Lee et al., 2014; Massie et al., 2011; Priolo et al., 2014; Valencia et al., 2014). Therefore, we performed targeted DNA sequencing for actionable somatic mutations in these patients. Sequencing data revealed the highest lactate in patients with homozygous PTEN loss, potentially identifying a group of patients that may benefit most from HP-MRI.
Results
Design and Implementation of Hyperpolarized MRI in prostate cancer patients
Twelve patients (Table S1) with biopsy-proven prostate cancer were imaged with hyperpolarized MRI following a bolus injection of [1-13C] pyruvate. Five patients were injected and imaged twice, for a total of seventeen injections (Table S2). Patient doses were hyperpolarized for at least 2 hours before dissolution (Figure 1), passed a quality control check, and were released by a pharmacist prior to injection after terminal sterilization. An echo-planar spectroscopic imaging (EPSI) sequence (Chen et al., 2007) was designed to acquire spatially resolved dynamic spectra within 2 minutes of dissolution, with a temporal resolution of 4.9 s resulting in a 4D dataset. Due to the acquisition of spatial and spectral information following a single excitation pulse, the EPSI sequence enables acquisition of MR data that can resolve the temporal dynamics of pyruvate delivery and lactate production and conserves HP signal by limiting the number of excitation pulses. The 1×1×1.5-cm3 voxel size allows visualization of lesions with diameters >1 cm with adequate SNR.
Figure 1. Hyperpolarization and acquisition.

The [1-13C] pyruvate is polarized using dissolution dynamic nuclear polarization: microwave irradiation is used to transfer the high polarization of the radical achieved at high magnetic field and low temperature to the 13C nuclei (red circles). Following dissolution, the sample must pass a Quality Control check before injection, which measures pyruvate and residual radical concentrations, temperature, pH, and polarization. A power injector is used to deliver a bolus of pyruvate with a saline flush. An EPSI sequence is repeated to acquire 2D dynamic spectra with 1.5 cm3 nominal spatial resolution and 4.9 s temporal resolution.
2D arrays of spectra were registered to T2-weighted images to localize the HP signal (Figure 2A). Representative spectra from one of the voxels (Figure 2B) show pyruvate delivery at an early time point (17 s post-injection) and its subsequent conversion to lactate (33 s post-injection). (Two-dimensional arrays of spectra for additional time points are shown in Supplementary Figure S1A.) The spectra were fit with Lorentzian curves to estimate the areas under the pyruvate and lactate peaks and generate metabolite maps (Figure 2C). Dynamic curves were generated by summing the maps over the prostate for each time point and allow for an assessment of delivery and real-time conversion (Figure 2D). The primary metric for temporal analysis was time-to-max (dotted lines), and the primary metric for spatial analysis was the maximum lactate ratio (Lacmax)—that is, the ratio of lactate to total carbon signal (lactate/(lactate+pyruvate)) at the time point with the largest such ratio. The tissue type (Normal, Primary Gleason grade 3, Primary grade ≥4) was defined using regions identified by a pathologist on the histology slices (Figure 2E) and matched to anatomic MRI.
Figure 2. Data processing.

(A) Array of spectra overlaid on a T2-weighted image shows HP signal localized in the prostate. (B) Early and late spectra from one of the voxels in the right peripheral zone show pyruvate delivery and subsequent conversion to lactate. (C) Spectra are automatically fit with Lorentzian curves, which are used to calculate the area of the pyruvate and lactate peaks for each voxel (in space and time). (D) Pyruvate and lactate curves for the whole prostate show delivery of pyruvate and its conversion to lactate. (E) The maximum lactate to total carbon ratio (Lacmax) is shown and was used as the primary metric for analysis. A pathologist marked regions of Primary Gleason grades 3 and 4/5 on histology slides.
HP pyruvate is reproducible across patients and in test/re-test injections
Using our dynamic hyperpolarized MRI acquisition strategy, we assessed the delivery of HP pyruvate to the prostate. The time to arrival of HP pyruvate varied considerably across patients, even at the time scale of the hyperpolarized MRI experiment (Figure 3A). The time-to-max pyruvate within the gland ranged from 11.2–33.5 s (21.8±5.4 s) post-injection. The internal pudendal artery, which supplies the prostate, was identified as an input function source due to its visibility in the imaging field of view and the low occurrence of anatomic variations (Hricak and Carrington, 1991) (Supplementary Figure S1B). When corrected for the arrival time of pyruvate in the supplying blood vessels, the range and standard deviation of time-to-max pyruvate decreased: 6.2–12.4 s (10.1±2.4 s) post-input. Furthermore, the delivery curves show a bimodal distribution (6.7±0.4 s and 11.6±0.6 s, Figure 3B). The two clusters are separated by the temporal resolution of the 2D dynamic acquisition, suggesting that the correction is limited by the temporal resolution of the sequence. With a finer temporal resolution, it should be possible to improve the correction for perfusion differences.
Figure 3. Quantified Metabolic Dynamics and Comparison to Primary Gleason Grade in Prostate Cancer Patients.

(A) Pyruvate delivery to the prostate varies across patients (N=16 patient injections) as measured from the time of injection (time-to-max standard deviation = 5.4 s). When corrected for delivery, the delivery curves align, both in shape and time-to-max (standard deviation = 2.4 s). (B) The range of time-to-max decreases for both pyruvate (22.3 s to 6.2 s) and lactate (21.4 s to 14.3 s) when corrected for the input timing (N=16 patient injections). The time-to-max pyruvate shows a bimodal distribution with a separation of 4.9 s, corresponding to the temporal resolution of the acquisition. (C) There is no significant difference in time-to-max pyruvate and lactate between injections in the same patient (p=0.24,0.78, N=5 patients). 4 of the 5 patients were injected and imaged again 1 hr after the first injection, while 1 patient (labeled in blue) was injected and imaged for the second time on a different day. (D) The maximum lactate ratio (Lacmax) maps show similar spatial distributions to the regions marked on histology slides by a pathologist. Furthermore, regions of high-grade tumor (Gleason grade 4/5) show higher ratios than those of low-grade tumor (Gleason grade 3). (E) The Lacmax increases with tumor Gleason grade. The ratios are significantly lower in normal tissue than in tumors (p=0.0001 for Gleason grade 3, p<0.0001 for Gleason grade ≥4). (F) There is no significant difference in Lacmax between test/re-test injections within individual patients (N=5 patients, 2 injections per patient). All plotted data is represented as mean and SD. Significance was tested using a 2-sided Student’s T-test and p-values < 0.05 were considered signficant.
In addition to variability across patients, it is also important to consider the possible variability in measurements of the same patient, as this would impact the potential for assessing longitudinal metabolic changes. To explore this, 5 patients were injected twice and the dynamics of delivery and conversion were assessed. Of these patients, 4 were injected twice 1 hour apart on the same day, demonstrating the ability to rapidly re-evaluate subjects using HP MRI. The time-to-max pyruvate and time-to-max lactate did not differ significantly between the two injections when corrected for perfusion (p=0.24,0.78) (Figure 3C). This provides evidence that the technique we applied is a reproducible method to explore the dynamic delivery of hyperpolarized pyruvate to the prostate on the sub-minute timescale of this experiment.
The variability of pyruvate delivery times across patients indicates the need for bolus tracking for static acquisitions, which has been successfully used in animal studies (Durst et al., 2014). A non-localized or lower spatially resolved bolus-tracking acquisition would enable a higher temporal resolution, which would be better able to detect the true time-to-max pyruvate. This would result in more consistent metabolite maps, which would facilitate comparisons between injections and, more importantly, be critical for treatment monitoring and future multi-center trials.
In addition, the acquisition was robust to variations in the magnetic field (B0) and errors in setting the center frequency given its spectral width. These are common considerations in the spectroscopic imaging field and important for assessing future imaging acquisition strategies. This spectral width allowed us to evaluate the presence of other metabolites, such as bicarbonate, without their being specified a priori; thus we were able to visualize putative conversion to bicarbonate in the prostate of 1 patient (Supplementary Figure S1E). Bicarbonate appears aliased near the pyruvate hydrate peak but can be readily annotated by comparing the phase, peak position, and magnitude relative to pyruvate in time. Alanine, produced via transamination of pyruvate, was not observed in our patient dynamics. While we were unable to compare bicarbonate levels across patients, we anticipate that future studies will explore the presence of bicarbonate as a marker for pyruvate dehydrogenase flux.
HP lactate is elevated with increased Gleason grade
Previous pre-clinical studies have suggested both increased levels of steady-state lactate and increased glycolytic flux to lactate as potential biomarkers of prostate cancer and aggressiveness (Keshari et al., 2013; Levin et al., 2009; Tessem et al., 2008). In order to conceptualize the biochemical conversion of HP pyruvate to lactate, we derive intuition from the standard flux-force relationship applied to metabolic flux analysis (MFA) (Noor et al., 2014). Typically, metabolite ratios, which change in time, reflect the flux through the reaction and in the case of this reaction, the highest net generated lactate would capture the closest to maximum forward flux. Furthermore, given the bolus injection of pyruvate at a supraphysiologic dose, we expect that this approach is measuring the maximum capacity of the system. This should not be confused with the physiologic use of steady-state blood pyruvate, which exist at approximately an order of magnitude lower concentration. Motivated by this and by recent work comparing quantitation of rate conversions of HP substrates, we utilized the Lacmax as a metric to infer transport and subsequent flux to lactate in vivo. We then compared the spatial distribution of the Lacmax to the distribution of prostate cancer on step-section histopathology. Comparing only one measurement per patient, we found that the Lacmax is elevated in tumor regions compared to non-cancerous prostatic tissue (Figure 3D). The Lacmax was significantly lower in normal prostate than in regions of prostate cancer (p=0.0001 for Gleason grade 3, p<0.0001 for Gleason grade ≥4, Figure 3E). For patients with two injections, the Lacmax was not significantly different between the two injections (p=0.2, Figure 3F). While there was increased Lacmax with higher Gleason grades, a larger sample size is needed to establish cutoffs for distinguishing low-grade and high-grade tumors using HP lactate signal. Acquiring higher-resolution data may also facilitate distinguishing tumor grade by reducing partial volume effects.
Metabolic imaging has the potential to reveal regions missed on anatomic MRI
Standard non-invasive approaches typically perform well in regions where there is an obvious malignant mass. While this is useful for confirming diagnostic accuracy, the ability to non-invasively identify lesions that are not visible on conventional imaging would be a major benefit of HP MRI. Anterior apical prostate tumors are common but present challenges for both detection and treatment. These lesions are difficult to sample with a standard transrectal biopsy; a number of studies found improved detection rates with an extended biopsy protocol (Moussa et al., 2010; Wright and Ellis, 2006). The size and location of the apex at the periphery of the prostate make it challenging to image with conventional MRI, but using multiple different types of contrast can improve detection rates (Nix et al., 2012; Rosenkrantz et al., 2015). Anterior apical tumors have a high rate of residual cancer for surgical resection and high-intensity focused ultrasound treatment (Boutier et al., 2011; Smith et al., 2007). Supplementary Figure S1F shows an example of a lesion that is not clearly visible on conventional T2-weighted or diffusion-weighted images, typically considered the MRI sequences most sensitive for detecting peripheral zone lesions. However, the HP lactate signal is co-localized with the lesion as identified on pathology. This indicates that the information derived from the hyperpolarized MRI is different from that of anatomic scans and may provide distinct, orthogonal information that can be used to assess tumor grade and characterize the underlying pathology.
Increased lactate does not correlate with standard clinical markers, suggesting a molecular mechanism mediates the flux
The lactate ratio was compared to PSA, prostate volume, total tumor volume, and maximum tumor dimension (Supplementary Figure S2). The correlation was strongest for Lacmax and PSA (R2=0.26; R2<0.20 for the spatial measurements). The weak correlations suggest that another mechanism, such as a change in metabolism, is responsible for the increase in lactate production.
In order to address the possible mechanistic contributors to the increased conversion of HP pyruvate to lactate in vivo, we first explored the levels of RNA expressed for the putative enzymes that govern its conversion (Figure 4A). When analyzing previously published RNA sequencing data, MCT1 and lactate dehydrogenase A (LDHA), the isoform predominantly responsible for the forward reaction of LDH, were significantly upregulated in prostate cancer in comparison to matched controls (Figure 4B, Supplementary Figure S3). Given their role in the mechanism of hyperpolarized pyruvate imaging, we hypothesized that expression of the rate limiting transporter (MCT1) would be upregulated in regions of high lactate. Previous work in animal models of prostate cancer has suggested the monocarboxylate transporters (MCT1 and MCT4) as possible candidates that govern lactate signal intensity. In immunohistochemical staining of patient samples, MCT1 was highly expressed in regions of cancer across all of our patients (Figure 4C) yielding a correlation to cancer analogous to that seen for Lacmax in Figure 3E. A subanalysis of our patient cohort (Supplementary Table S3), demonstrated elevated HP lactate kinetics and Lacmax in regions of high MCT1 (Figure 4D–E). We used a threshold of 30% of an ROI as stained positive for MCT1 to identify ROIs with high MCT1 levels. Lacmax was 60% higher in ROIs of high MCT1 than of low MCT1 (0.38 ± 0.3 vs. 0.23 ± 0.04, P=0.028), further supporting a correlation between elevated MCT1 and increased HP lactate.
Figure 4.

(A) Schematic for conversion of HP pyruvate to lactate and potential mediators of this reaction in vivo (B) Analysis of RNA sequencing data from the TCGA (Cancer Genome Atlas Research, 2015) showing elevated MCT1 in regions of prostate cancer as compared to regions of normal prostate tissue in the same patient plotted as mean and SD. (C) Representative images from MCT1 immunohistochemistry in matched benign and tumor regions of 7 patients demonstrating an increase in MCT1 in tumor regions. White scale bar represents 500 μm. (D) T2-weighted anatomic MRI with representative regions of interest and corresponding dynamics of HP lactate and pyruvate. The regions of green, red and orange correspond to the ROIs on the anatomic MRI. (E) MCT1 immunohistochemistry for the corresponding regions in (D) showing higher MCT1 staining in the orange and red regions, both of which were Gleason grade 4/5 as confirmed by H&E staining. Scale bar represents 500 μm. (F) Lacmax is shown for each ROI quantified. 5 ROIs had loss of PTEN (red) and 4 demonstrated TMPRSS-ERG fusion (blue) as measured by IMPACT sequencing (G) The average Lacmax is shown for PTEN wildtype (wt, n=11 ROIs) versus PTEN loss (n=5 ROIs, 2 homozygous loss and 3 heterozygous loss) with a P=0.059. (H) The average Lacmax is shown for TMPRSS-ERG fusion (n=4 ROIs) versus wildtype (wt, n=12 ROIs) with a P=0.730. Significance was tested for all data using a 2-sided Student’s T-test and p-values are reported for each comparison.
Elements of the PI3-kinase pathway, which regulates cellular metabolism and proliferation, are often mutated in prostate cancer (Taylor et al., 2010). An increase in the expression of PI3-kinase or, more commonly, a decrease in the expression of PTEN results in upregulation of anaerobic glycolysis and an increase in lactate production. PTEN loss is associated with aggressive prostate tumors (Berger et al., 2011; Di Cristofano and Pandolfi, 2000), and it is likely that upregulation of this pathway results in increased hyperpolarized lactate production in high-Gleason-grade lesions. To confirm the role of PTEN loss, we performed targeted DNA sequencing for actionable somatic mutations in these patients using the IMPACT assay. Sequencing revealed a subset of patients with loss of PTEN (n=2 ROIs with homozygous loss and n=3 with heterozygous loss) and a correlation between loss of PTEN and Lacmax approaching significance (P=0.059, Figure 4FG, Supplementary Figure S4). A subset of patients also revealed TMPRSS2-ERG gene fusions, though these did not yield increased lactate relative to non-fusions (Figure 4H). These findings hint at the potential for utilizing HP metabolic flux as a strategy for discerning regions of genomic heterogeneity as well as gleaning information about the role of each mutation in controlling metabolic flux.
Discussion
Hyperpolarized pyruvate imaging has been safely performed in humans for prostate, brain and cardiac studies (Cunningham et al., 2016; Miloushev et al., 2018; Nelson et al., 2013). These preliminary studies tested the safety and feasibility of in vivo HP pyruvate imaging, with pyruvate and lactate signal detectable in the prostate and pyruvate, bicarbonate, and lactate detectable in the heart. For HP MRI to be clinically useful, it is necessary to demonstrate the repeatability of the technique and the correlation with pathologic findings. The current study addressed these issues by imaging pre-prostatectomy patients following initial and, in some cases, repeat HP pyruvate injections, allowing us to not only correlate signal with histopathologic grade but also to compare data from test/re-test injections.
To ensure sufficient SNR, we acquired images with a native resolution of 1×1×1.5-cm3 voxels. This voxel size allowed us to acquire multiple voxels within the prostate. However, this resolution limited the size of tumors that we were able to visualize and resulted in partial volume effects when comparing to whole-mount pathology specimens. Furthermore, the spatial resolution limited our ability to evaluate intratumoral heterogeneity. With higher resolution, we expect the correlation between Lacmax and histopathologic grade to be stronger due to voxels being more homogeneous and increasing the number of voxels that can be confidently classified according to tumor grade. Higher in-plane spatial resolution is limited for the EPSI acquisition due to the gradient limitations of the scanner; however, the through-plane resolution could be improved by using a thinner slab or phase encoding in the slice direction. A non-spectroscopic imaging acquisition would allow higher in-plane resolution; a number of different fast imaging readout gradient trajectories, such as spiral and echo-planar, could be combined with a multi-echo acquisition to reconstruct single-metabolite images (Cho et al., 2017). With the SNR achieved in the current study, we primarily see pyruvate and lactate, with bicarbonate detected in a single case (Supplementary Figure S1E). In future studies we aim to use an imaging acquisition, where one could acquire the same field of view with fewer acquisitions, allowing the use of larger flip angles, multiple slices, or more temporal data.
A dynamic acquisition provided flexibility in the timing of the acquisition relative to the injection; slight differences in patient-specific perfusion were accommodated by the acquisition of multiple time points. The 2D acquisition had the advantage of being fast relative to the acquisition of a multi-slice or 3D volume. A triggered acquisition would help adjust the acquisition time to best capture the metabolic information of interest. Using a triggered acquisition would also help preserve signal by minimizing the number of excitation pulses used before the metabolic conversion has occurred. Based on these data, an imaging acquisition should be initiated 15–20 seconds after the input signal is detected to capture the peak lactate signal. This approach offers the added benefit of avoiding the peak pyruvate signal, which can reduce the dynamic range of data. Within our chosen field of view and the sensitivity region of the receive coil, we observed no signal outside of the supplying vessels and the prostate. Therefore, a non-localized acquisition could be used to detect the arrival of the signal and trigger the acquisition. The advantages of a non-localized scout are that the temporal resolution could be much higher, improving the quality of the correction and fewer and/or smaller flip angle excitation pulses could be used to preserve longitudinal magnetization for the main acquisition. Recent studies have also attempted to use inputless methods to calculate flux in prostate cancer (Larson et al., 2018), though further studies with comparison to validated regions of tumor are needed. We anticipate a combination of the inputless method and a known input function will be used for accurate flux calculations.
With these technical achievements, hyperpolarized MRI shows great potential as a non-ionizing, minimally invasive technique for monitoring metabolic changes over time, which could potentially be relevant for treatment response assessment. We also demonstrated that HP data are repeatable within a short time (during which no physiological changes are expected), with a variability on the order of that found in large studies using 18F-flurodeoxyglucose positron emission tomography (FDG PET) (Fraum et al., 2019), suggesting that any changes observed over time would be related to changes in tumor metabolism, such as tumor progression or response to treatment. Prior studies have shown that hyperpolarized MRI can be used to detect response to treatment in preclinical models (Day et al., 2007; Tee et al., 2018). A significant change in metabolism can be observed earlier than changes in tumor volume (Di Gialleonardo et al., 2017; Dong et al., 2019). Moreover, a case report in a prostate cancer patient before and after androgen deprivation therapy showed reduced HP lactate (Aggarwal et al., 2017), providing some evidence that it is feasible to acquire pre- and post-treatment HP-MRI data during the course of treatment.
The correlation of Lacmax and histopathologic grade suggests that lactate has potential as a direct imaging biomarker for tumor aggressiveness. We have also demonstrated that the magnitude of hyperpolarized lactate is increased with increased expression of MCT1 in patient samples, likely the rate-limiting step in generation of HP lactate. MCT1 was the first member of the proton-linked monocarboxylate transporter described and has been shown to have a broad specificity for short-chain monocarboxylates (Halestrap and Price, 1999). It has been shown to be over-expressed in many types of cancer and is also associated with poor prognosis and high mortality (San-Millan and Brooks, 2017). Excretion of lactate through MCT1 has been postulated to allow LDH-catalyzed lactate flux from pyruvate to persist, regenerating NAD+ consumed during glycolysis (DeBerardinis et al., 2008). More recently, MCT1 has been implicated as a mechanism by which cancer cells can utilize circulating lactate to fuel the energetic needs of the cell (Faubert et al., 2017; Hui et al., 2017). It is therefore possible that hyperpolarized lactate production provides a non-invasive functional biomarker of this mechanism in humans. In combination with MCT1 immunohistochemistry, HP lactate might become a useful biomarker not only for prostate cancer detection and characterization, but also for the development of relevant therapeutics for targeting this mechanism and a basis for fundamentally understanding the metabolic requirements of prostate cancer.
We have also shown that with loss of PTEN, lactate formation increased in our patients. PI3K and downstream signaling proteins have long been known as master regulators of metabolism (Cairns et al., 2011), suggesting that patients with loss of repression of this pathway would show increased metabolism and ultimately benefit from hyperpolarized MRI. While these data suggest that the titration of PTEN plays a role in the metabolic phenotype observed in vivo, study of more patients is necessary to quantify this change with respect to pathway output. Targeted sequencing also revealed a subset of patients with the TMPRSS2-ERG gene fusion. Recent studies in lung cancer (Updegraff et al., 2018) have shown a role for this fusion gene in regulating lactate export and glycolytic metabolism. It will be intriguing to investigate the ability of hyperpolarized MRI to serve as an imaging platform to stratify patients who could potentially benefit from treatment with inhibitors of TMPRSS-ERG versus those who could benefit from treatment with inhibitors of the PI3K pathway.
We have demonstrated that hyperpolarized MRI with [1-13C] pyruvate is clinically feasible. The timing for substrate delivery and its metabolism is repeatable when corrected for the arterial input and does not differ significantly between injections in the same patient. The maximum lactate ratio increases with tumor grade and is significantly higher in tumors than in normal prostate. The ratio is also repeatable for test/re-test injections in the same patient, suggesting that HP pyruvate MRI can be used to accurately assess prostate cancer grade in patients. Identifying MCT1 as the likely driver of increased lactate in regions of prostate cancer provides both an avenue for further investigations of the fundamental metabolism that drives prostate cancer energetics and a companion biomarker, HP lactate, to guide such investigations.
Limitations of Study
While this study further lays the foundation for using HP pyruvate in prostate cancer patients, the patient population limits its ability to assess the level of subtlety in metabolic changes that can be detected across patients. With widespread adoption, future studies with large patient numbers are needed, akin to those currently underway for PET imaging. Furthermore, a large scale genomic and proteomic effort, in conjunction with metabolic imaging of patients, is needed to validate the findings of this first study. Lesion sizes analyzed in this study were also limited by the spatial resolution achievable with our current technology. With greater signal strengths provided by newer polarization and detection approaches, higher spatial and temporal resolution images can be acquired. This along with more sophisticated modeling approaches has the potential to provide an even deeper understanding of in vivo cancer metabolism.
Star Methods
Lead Contact and Materials Availability
Further information and requests for resources and reagents should be directed to Kayvan R. Keshari, Ph.D. (rahimikk@mskcc.org).
Lead Contact and Materials Availability: This study did not generate new unique reagents.
Experimental Model and Subject Details
In this prospective study, men (average age of 62 ± 7 yrs, range 51–72 yrs) with histologically confirmed prostate cancer (>1 cm) scheduled for radical prostatectomy were included and the patient characteristics are listed in Supplementary Table S1. (Patient 3 subsequently opted for brachytherapy and was included in the imaging repeatability analysis, but was excluded from analyses comparing imaging and tissue samples). Patients were required to have blood tests within 2 weeks of the pyruvate study demonstrating sufficient hepatic and renal function. Exclusion criteria included prior treatment for prostate cancer, acute major illness, diabetes mellitus, and inability to tolerate an MRI exam with intravenous contrast administration.
The Institutional Review Board of Memorial Sloan Kettering Cancer Center approved the study (IRB#14–205). Participants were enrolled at Memorial Sloan Kettering Cancer Center (MSKCC) in New York, New York, USA from May 2015 to July 2018. All participants provided written, informed consent.
Method Details
Dose preparation
The use of [1-13C] pyruvate for human injection was in accordance with an Investigational New Drug application that was acknowledged by the U.S. Food and Drug Administration (IND#125947). The pyruvate prep consisted of 14.2 M [1-13C] pyruvate (GMP Isotech) and 15 mM of free radical (GE Healthcare). The prep was dissolved with 38 mL sterile water and neutralized with 41.2 g of Tris buffer and sodium hydroxide. Patient doses were prepared using single-use, sterile fluid paths (GE Healthcare) that include a filter to remove the radical and a terminal sterilization filter (ZenPure). The fluid paths were prepared in a clean room the morning of the injection and were loaded into the polarizer approximately 4 h prior to the MR exam. A pharmacist evaluated the quality assurance results to ensure the dose met the specifications for injection and dispensed the syringe with the proper dose volume. A sample was saved from each dose for sterility testing. Patients were injected intravenously with 0.43 mL/kg of 250 mM [1-13C] pyruvate followed by a 20 mL saline flush to provide a bolus of pyruvate. A power injector (Medrad) was used to control the injection volume and rate (5 mL/s).
MR Acquisition
All MR data were acquired on a wide-bore 3T scanner (MR750w, GE Healthcare). The body coil was used for proton (1H) excitation, and an insertable clamshell volume transmit coil was used for carbon (13C) excitation (Tropp et al., 2011). A dual-tuned H/13C endorectal coil was used for signal detection. Patients were imaged supine and feet first with their arm outside the bore for the intravenous pyruvate injection. Axial T2-weighted images were acquired for anatomic reference using a 2D or 3D fast spin-echo sequence. Carbon-13 spectra were acquired using a 2D dynamic echo-planar spectroscopic imaging (EPSI) sequence (Chen et al., 2007). A 16-cm axial field of view was centered on the prostate at a superior-inferior location (15-mm slice thickness) corresponding to the index lesion identified on standard-of-care prostate MRI. A native in-plane resolution of 1 cm×1 cm was achieved using an EPSI readout trajectory covering 16 voxels in the left-right dimension and 16 phase encoding steps in the anterior-posterior dimension. The EPSI waveform acquired 16 voxels with a spectral resolution of 0.3 ppm and a sweep width of 18 ppm. The center frequency was set halfway between where [1-13C]pyruvate and [1-13C]lactate are expected. The 2D EPSI was repeated every 4.9 s. For injections 1–5, a 10° flip angle was used for all time points. For injections 6–18, a variable flip angle scheme was used to improve signal at the later time points. A 5° flip angle was used for the first three time points, 10° for subsequent time points, and 30° for the final time point. To test intrapatient repeatability, patients were imaged at least 1 h after the first injection to allow time for the body to clear the introduced pyruvate. (Patient 1 was injected on two separate days three weeks apart.) The EPSI acquisition was initiated 5 seconds following the completion of the saline injection.
Reconstruction
Data were reconstructed offline using MATLAB (Mathworks). The data were zero-filled in the spectral and spatial dimensions, to 256 spectral points and 32×32 spatial points. The free induction decay signals were apodized using a 10 Hz exponential function prior to Fourier transformation. The dynamic spectra were processed using the SIFT technique to separate persistent signal from noise (Doyle et al., 1994). The pyruvate and lactate peaks were fit with a Lorentzian function to further denoise the data (Figure 2). The pyruvate and lactate signals were then corrected for flip angle, to allow comparison between the two flip angle schemes. The areas of the pyruvate and lactate peaks were used to generate maps for analysis. Using ratios obviated the need to correct for coil sensitivity and polarization.
Pathologic assessment
Following surgical resection, the entire gland was embedded and axially step-sectioned (Pucar et al., 2005). Whole mount prostatectomies were fixed overnight in 10% neutral buffered formalin (Fisher). The samples were dehydrated in graded alcohol, embedded in paraffin and 5 μm sections used for analysis. Sections were stained with haemotoxylin and eosin (H & E) and used for immunohistochemical analysis performed on an automated Ventana machine (Discovery, Ventana Medical Systems Inc.).
Quantification And Statistical Analysis
HP MRI Analysis
Regions of interest were defined using a T2-weighted image as an anatomic reference. The pudendal arteries and prostate were defined based on anatomy, and tumors were defined using the regions identified by a pathologist on whole-mount pathology specimens. For the dynamic curves, the signals were fit with a spline to estimate the time-to-max in MATLAB (Mathworks). For repeatability measures, the data from the five patients with two injections were analyzed using a paired Student’s T-test using Prism 8 (GraphPad). Correlations with clinical parameters were evaluated using the Pearson correlation coefficient using Prism 8 (GraphPad).
Pathologic Analysis
Sections were stained with hematoxylin and eosin (H&E) and an experienced genitourinary pathologist identified the sites of prostate cancer lesions, measured their volume, and assigned a Gleason grade. The hyperpolarized MRI field of view was matched to corresponding anatomic images and histology slices by two radiologists. The HP data were analyzed by tissue type (Normal prostate tissue, Gleason grade 3 prostate cancer, and Gleason grade ≥4 prostate cancer) as segmented on the matched anatomical images. The primary antibodies used were MCT-1 (Santa Cruz Biotechnology) at 1:100 dilution. For the purposes of comparing MCT-1 staining to Lacmax, the section was considered positive for MCT-1 expression if more than 30% of the area was stained and analyzed using a paired Student’s T-test using Prism 8 (GraphPad). Due to the coarse resolution of the HP data compared to the images of histological sections, several of the sections corresponded to the same HP MRI voxels. Only one section was compared to each HP MRI ROI. Redundant sections were excluded from analysis and are labeled as such in Supplemental Table S3.
RNA Analysis
TCGA RNA sequencing (RSEM normalized) data and associated clinical data was downloaded from the Broad Institute’s firebrowse server for the PRAD TCGA study. Differential expression was completed using the limma voom R package (Law et al., 2014).
Genomic Analysis
Samples were sequenced using the MSK-IMPACT prospective clinical sequencing platform (Cheng et al., 2015). This hybridization capture-based assay targets 468 cancer associated genes for mutational analysis and tiles the genome with common heterozygous SNPs at sufficient density to call allele-specific copy number changes. Allele-specific copy number changes were determined using the FACETS algorithm run in a sequential mode. First, FACETs was run at a higher critical value of 100 to accurately determine purity. This purity was input directly to the FACETS algorithm in the subsequent FACETS run with a higher sensitivity critical value of 50. All FACETS output was manually reviewed to ensure accuracy of the inferred diplogR. PTEN copy number status was determined by examination of major and minor copy number of the PTEN locus from the FACETS output.
No methods were used to determine whether the data met assumptions of the statistical approach.
Data And Code Availability
The Raw IMPACT sequencing data generated during this study are available at the European Variation Archive (EVA, Accession code: PRJEB33969) as well as through cbioportal.org at the following links:
Additional Resources
This work involves an ongoing clinical trial () which can be found at the following link: https://clinicaltrials.gov/ct2/show/NCT02421380.
Supplementary Material
Key Resources Table.
| REAGENT or RESOURCE | SOURCE | IDENTIFIER |
|---|---|---|
| Biological Samples | ||
| Prostate sections | Patients | N/A |
| Chemicals | ||
| [1-13C] pyruvic acid | Isotech Stable Isotopes | 113–24–6 |
| Radical | Syncom | SY01 |
| Sodium hydroxide 1N | Fisher | SS266 |
| Tris (Hydroxymethyl) Aminomethane, ACS Reagent | Sigma-Aldrich | 252859 |
| Sterile Water | Hospira or B. Braun | NDC# 0409–7990–09 or NDC# 0264–7850–00 |
| Critical Commercial Assays | ||
| MCT-1 Antibody | Santa Cruz Biotechnology | sc-365501 |
| Software and Algorithms | ||
| MATLAB | MathWorks | https://www.mathworks.com/ |
| Prism | GraphPad | https://www.graphpad.com/scientific-software/prism/ |
| Other | ||
| Clinical fluid path | GE Healthcare | SFP |
| Medrad Syringe | Bayer | SQK65VS |
| Millex-GS Filter, 25mm, 0.22 μm, Vented Inlet | Millipore | SLGSV255F |
| 65mm 0.2uM Syringe Filter (sterilizing filter) | ZenPure | D65RS020LMLFNV-PH-ET0–1 |
| 3 way Stopcocks | Smith Medical | MX9311L |
Context and Significance.
While metabolic parameters are of great interest as diagnostic tools for prostate cancer, non-invasive methods to investigate in vivo metabolism in humans are limited. Here, utilizing the emerging modality of metabolic imaging known as hyperpolarized MRI, researchers at Memorial Sloan Kettering Cancer Center and their collaborators trace the fate of a glycolytic metabolite, pyruvate, in prostate cancer patients. They find that metabolic imaging of pyruvate’s conversion to lactate has the potential to annotate grades of prostate cancer, implying a relationship between tumor grade and metabolic rate. Further, they connect the increased generation of lactate to the overexpression of a transport protein which imports pyruvate and lactate into cells. These findings provide evidence that metabolic imaging can be used clinically to assess cancer patients. Moreover, it reveals underlying biochemistry which plays a role in prostate cancer biology and can yield novel therapeutic strategies.
Highlights.
HP pyruvate can be safely infused multiple times and measures reproducible kinetics
Tumors with higher Gleason grades had higher levels of hyperpolarized lactate
Regions of high HP lactate correlated with elevated monocarboxylate transporter 1
Conversion of HP pyruvate to lactate was higher in tumors with loss of PTEN
Key Points.
First reproducibility study of metabolic imaging using hyperpolarized [1-13C] pyruvate in patients demonstrating that patients can be infused safely multiple times and yields quantitative kinetics
When normalized for the input function, utilizing the pudendal artery signal, delivery time across patients was on the order of the imaging temporal resolution— providing evidence that this approach to HP pyruvate MRI could be developed as a biomarker
Tumors with higher Gleason grades had higher levels of hyperpolarized lactate
Regions of high lactate signal correlated with regions of elevated monocarboxylate transporter 1 (MCT1) expression
Conversion of hyperpolarized pyruvate to lactate was higher in tumors with loss of PTEN
Acknowledgments
The authors would like to acknowledge the support of the Radiochemistry and Imaging Probes (RIMP) core staff, including Phillip J. DeNoble, PharmD, as well as scientific advice from Dr. Jason Lewis. This work was sponsored by the National Institutes of Health (NIH R00 EB014328, R01 CA195476 and S10 OD016422; NIH/NCI Cancer Center Support Grant P30 CA008748), Geoffrey Beene Cancer Research Center, Center for Molecular Imaging and Nanotechnology at MSKCC, The Center for Experimental Therapeutics at MSKCC, Mr. William H. and Mrs. Alice Goodwin and the Commonwealth Foundation for Cancer Research, and the Peter Michael Foundation.
Footnotes
Declaration of Interests: APC and FR are employed by General Electric Healthcare. JT is employed by Berkshire Magnetics. HH is on the board of IBA. KRK serves on the SAB of NVision Imaging Technologies.
Publisher's Disclaimer: This is a PDF file of an unedited manuscript that has been accepted for publication. As a service to our customers we are providing this early version of the manuscript. The manuscript will undergo copyediting, typesetting, and review of the resulting proof before it is published in its final citable form. Please note that during the production process errors may be discovered which could affect the content, and all legal disclaimers that apply to the journal pertain.
References
- Aggarwal R, Vigneron DB, and Kurhanewicz J (2017). Hyperpolarized 1-[(13)C]-Pyruvate Magnetic Resonance Imaging Detects an Early Metabolic Response to Androgen Ablation Therapy in Prostate Cancer. Eur Urol 72, 1028–1029. [DOI] [PMC free article] [PubMed] [Google Scholar]
- Albers MJ, Bok R, Chen AP, Cunningham CH, Zierhut ML, Zhang VY, Kohler SJ, Tropp J, Hurd RE, Yen YF, et al. (2008). Hyperpolarized 13C lactate, pyruvate, and alanine: noninvasive biomarkers for prostate cancer detection and grading. Cancer Res 68, 8607–8615. [DOI] [PMC free article] [PubMed] [Google Scholar]
- Berger MF, Lawrence MS, Demichelis F, Drier Y, Cibulskis K, Sivachenko AY, Sboner A, Esgueva R, Pflueger D, Sougnez C, et al. (2011). The genomic complexity of primary human prostate cancer. Nature 470, 214–220. [DOI] [PMC free article] [PubMed] [Google Scholar]
- Bill-Axelson A, Holmberg L, Ruutu M, Haggman M, Andersson SO, Bratell S, Spangberg A, Busch C, Nordling S, Garmo H, et al. (2005). Radical prostatectomy versus watchful waiting in early prostate cancer. N Engl J Med 352, 1977–1984. [DOI] [PubMed] [Google Scholar]
- Boutier R, Girouin N, Cheikh AB, Belot A, Rabilloud M, Gelet A, Chapelon JY, and Rouviere O (2011). Location of residual cancer after transrectal high-intensity focused ultrasound ablation for clinically localized prostate cancer. BJU Int 108, 1776–1781. [DOI] [PubMed] [Google Scholar]
- Bray F, Ferlay J, Soerjomataram I, Siegel RL, Torre LA, and Jemal A (2018). Global cancer statistics 2018: GLOBOCAN estimates of incidence and mortality worldwide for 36 cancers in 185 countries. CA Cancer J Clin 68, 394–424. [DOI] [PubMed] [Google Scholar]
- Cairns RA, Harris IS, and Mak TW (2011). Regulation of cancer cell metabolism. Nat Rev Cancer 11, 85–95. [DOI] [PubMed] [Google Scholar]
- Cancer Genome Atlas Research, N. (2015). The Molecular Taxonomy of Primary Prostate Cancer. Cell 163, 1011–1025. [DOI] [PMC free article] [PubMed] [Google Scholar]
- Chen AP, Cunningham CH, Ozturk-Isik E, Xu D, Hurd RE, Kelley DA, Pauly JM, Kurhanewicz J, Nelson SJ, and Vigneron DB (2007). High-speed 3T MR spectroscopic imaging of prostate with flyback echo-planar encoding. J Magn Reson Imaging 25, 1288–1292. [DOI] [PubMed] [Google Scholar]
- Cheng DT, Mitchell TN, Zehir A, Shah RH, Benayed R, Syed A, Chandramohan R, Liu ZY, Won HH, Scott SN, et al. (2015). Memorial Sloan Kettering-Integrated Mutation Profiling of Actionable Cancer Targets (MSK-IMPACT): A Hybridization Capture-Based Next-Generation Sequencing Clinical Assay for Solid Tumor Molecular Oncology. J Mol Diagn 17, 251–264. [DOI] [PMC free article] [PubMed] [Google Scholar]
- Cho A, Lau JYC, Geraghty BJ, Cunningham CH, and Keshari KR (2017). Noninvasive Interrogation of Cancer Metabolism with Hyperpolarized (13)C MRI. J Nucl Med 58, 1201–1206. [DOI] [PMC free article] [PubMed] [Google Scholar]
- Cunningham CH, Lau JY, Chen AP, Geraghty BJ, Perks WJ, Roifman I, Wright GA, and Connelly KA (2016). Hyperpolarized 13C Metabolic MRI of the Human Heart: Initial Experience. Circ Res 119, 1177–1182. [DOI] [PMC free article] [PubMed] [Google Scholar]
- Day SE, Kettunen MI, Gallagher FA, Hu DE, Lerche M, Wolber J, Golman K, Ardenkjaer-Larsen JH, and Brindle KM (2007). Detecting tumor response to treatment using hyperpolarized 13C magnetic resonance imaging and spectroscopy. Nat Med 13, 1382–1387. [DOI] [PubMed] [Google Scholar]
- DeBerardinis RJ, Lum JJ, Hatzivassiliou G, and Thompson CB (2008). The biology of cancer: metabolic reprogramming fuels cell growth and proliferation. Cell Metab 7, 11–20. [DOI] [PubMed] [Google Scholar]
- Di Cristofano A, and Pandolfi PP (2000). The multiple roles of PTEN in tumor suppression. Cell 100, 387–390. [DOI] [PubMed] [Google Scholar]
- Di Gialleonardo V, Aldeborgh HN, Miloushev V, Folkers KM, Granlund K, Tap WD, Lewis JS, Weber WA, and Keshari KR (2017). Multinuclear NMR and MRI Reveal an Early Metabolic Response to mTOR Inhibition in Sarcoma. Cancer Res 77, 3113–3120. [DOI] [PMC free article] [PubMed] [Google Scholar]
- Dong Y, Eskandari R, Ray C, Granlund KL, Santos-Cunha LD, Miloushev VZ, Tee SS, Jeong S, Aras O, Chen YB, et al. (2019). Hyperpolarized MRI Visualizes Warburg Effects and Predicts Treatment Response to mTOR Inhibitors in Patient-Derived ccRCC Xenograft Models. Cancer Res 79, 242–250. [DOI] [PMC free article] [PubMed] [Google Scholar]
- Doyle M, Chapman BLW, Balschi JA, and Pohost GM (1994). Sift, a Postprocessing Method That Increases the Signal-to-Noise Ratio of Spectra Which Vary in Time. J Magn Reson Ser B 103, 128–133. [Google Scholar]
- Durst M, Koellisch U, Gringeri C, Janich MA, Rancan G, Frank A, Wiesinger F, Menzel MI, Haase A, and Schulte RF (2014). Bolus tracking for improved metabolic imaging of hyperpolarised compounds. J Magn Reson 243, 40–46. [DOI] [PubMed] [Google Scholar]
- Faubert B, Li KY, Cai L, Hensley CT, Kim J, Zacharias LG, Yang C, Do QN, Doucette S, Burguete D, et al. (2017). Lactate Metabolism in Human Lung Tumors. Cell 171, 358–371 e359. [DOI] [PMC free article] [PubMed] [Google Scholar]
- Fraum TJ, Fowler KJ, Crandall JP, Laforest RA, Salter A, An H, Jacobs MA, Grigsby PW, Dehdashti F, and Wahl RL (2019). Measurement Repeatability of (18)F-FDG-PET/CT versus (18)F-FDG-PET/MRI in Solid Tumors of the Pelvis. Journal of nuclear medicine : official publication, Society of Nuclear Medicine. [DOI] [PMC free article] [PubMed] [Google Scholar]
- Golman K, Olsson LE, Axelsson O, Mansson S, Karlsson M, and Petersson JS (2003). Molecular imaging using hyperpolarized 13C. Br J Radiol 76 Spec No 2, S118–127. [DOI] [PubMed] [Google Scholar]
- Halestrap AP, and Price NT (1999). The proton-linked monocarboxylate transporter (MCT) family: structure, function and regulation. Biochem J 343 Pt 2, 281–299. [PMC free article] [PubMed] [Google Scholar]
- Han M, Partin AW, Piantadosi S, Epstein JI, and Walsh PC (2001). Era specific biochemical recurrence-free survival following radical prostatectomy for clinically localized prostate cancer. J Urol 166, 416–419. [PubMed] [Google Scholar]
- Hricak H, and Carrington BM (1991). MRI of the pelvis: a text atlas. (Appleton & Lange; ). [Google Scholar]
- Hui S, Ghergurovich JM, Morscher RJ, Jang C, Teng X, Lu W, Esparza LA, Reya T, Le Z, Yanxiang Guo J, et al. (2017). Glucose feeds the TCA cycle via circulating lactate. Nature 551, 115–118. [DOI] [PMC free article] [PubMed] [Google Scholar]
- Johansson JE, Andren O, Andersson SO, Dickman PW, Holmberg L, Magnuson A, and Adami HO (2004). Natural history of early, localized prostate cancer. JAMA 291, 2713–2719. [DOI] [PubMed] [Google Scholar]
- Keshari KR, Sriram R, Van Criekinge M, Wilson DM, Wang ZJ, Vigneron DB, Peehl DM, and Kurhanewicz J (2013). Metabolic reprogramming and validation of hyperpolarized 13C lactate as a prostate cancer biomarker using a human prostate tissue slice culture bioreactor. Prostate 73, 1171–1181. [DOI] [PMC free article] [PubMed] [Google Scholar]
- Keshari KR, and Wilson DM (2014). Chemistry and biochemistry of 13C hyperpolarized magnetic resonance using dynamic nuclear polarization. Chemical Society reviews 43, 1627–1659. [DOI] [PMC free article] [PubMed] [Google Scholar]
- Keshari KR, Wilson DM, Van Criekinge M, Sriram R, Koelsch BL, Wang ZJ, VanBrocklin HF, Peehl DM, O’Brien T, Sampath D, et al. (2015). Metabolic response of prostate cancer to nicotinamide phophoribosyltransferase inhibition in a hyperpolarized MR/PET compatible bioreactor. Prostate 75, 1601–1609. [DOI] [PMC free article] [PubMed] [Google Scholar]
- Kurhanewicz J, Vigneron DB, Ardenkjaer-Larsen JH, Bankson JA, Brindle K, Cunningham CH, Gallagher FA, Keshari KR, Kjaer A, Laustsen C, et al. (2019). Hyperpolarized (13)C MRI: Path to Clinical Translation in Oncology. Neoplasia 21, 1–16. [DOI] [PMC free article] [PubMed] [Google Scholar]
- Larson PEZ, Chen HY, Gordon JW, Korn N, Maidens J, Arcak M, Tang S, Criekinge M, Carvajal L, Mammoli D, et al. (2018). Investigation of analysis methods for hyperpolarized 13C-pyruvate metabolic MRI in prostate cancer patients. NMR in biomedicine 31, e3997. [DOI] [PMC free article] [PubMed] [Google Scholar]
- Law CW, Chen Y, Shi W, and Smyth GK (2014). voom: Precision weights unlock linear model analysis tools for RNA-seq read counts. Genome Biol 15, R29. [DOI] [PMC free article] [PubMed] [Google Scholar]
- Lee JV, Carrer A, Shah S, Snyder NW, Wei S, Venneti S, Worth AJ, Yuan ZF, Lim HW, Liu S, et al. (2014). Akt-dependent metabolic reprogramming regulates tumor cell histone acetylation. Cell Metab 20, 306–319. [DOI] [PMC free article] [PubMed] [Google Scholar]
- Levin YS, Albers MJ, Butler TN, Spielman D, Peehl DM, and Kurhanewicz J (2009). Methods for metabolic evaluation of prostate cancer cells using proton and (13)C HR-MAS spectroscopy and [3-(13)C] pyruvate as a metabolic substrate. Magn Reson Med 62, 1091–1098. [DOI] [PMC free article] [PubMed] [Google Scholar]
- Massie CE, Lynch A, Ramos-Montoya A, Boren J, Stark R, Fazli L, Warren A, Scott H, Madhu B, Sharma N, et al. (2011). The androgen receptor fuels prostate cancer by regulating central metabolism and biosynthesis. EMBO J 30, 2719–2733. [DOI] [PMC free article] [PubMed] [Google Scholar]
- McNeal JE, Bostwick DG, Kindrachuk RA, Redwine EA, Freiha FS, and Stamey TA (1986). Patterns of progression in prostate cancer. Lancet 1, 60–63. [DOI] [PubMed] [Google Scholar]
- Miloushev VZ, Granlund KL, Boltyanskiy R, Lyashchenko SK, DeAngelis LM, Mellinghoff IK, Brennan CW, Tabar V, Yang TJ, Holodny AI, et al. (2018). Metabolic Imaging of the Human Brain with Hyperpolarized (13)C Pyruvate Demonstrates (13)C Lactate Production in Brain Tumor Patients. Cancer Res 78, 3755–3760. [DOI] [PMC free article] [PubMed] [Google Scholar]
- Moussa AS, Meshref A, Schoenfield L, Masoud A, Abdel-Rahman S, Li J, Flazoura S, Magi-Galluzzi C, Fergany A, Fareed K, et al. (2010). Importance of additional “extreme” anterior apical needle biopsies in the initial detection of prostate cancer. Urology 75, 1034–1039. [DOI] [PubMed] [Google Scholar]
- Nelson SJ, Kurhanewicz J, Vigneron DB, Larson PE, Harzstark AL, Ferrone M, van Criekinge M, Chang JW, Bok R, Park I, et al. (2013). Metabolic imaging of patients with prostate cancer using hyperpolarized [1-(1)(3)C]pyruvate. Science translational medicine 5, 198ra108. [DOI] [PMC free article] [PubMed] [Google Scholar]
- Nix JW, Turkbey B, Hoang A, Volkin D, Yerram N, Chua C, Linehan WM, Wood B, Choyke P, and Pinto PA (2012). Very distal apical prostate tumours: identification on multiparametric MRI at 3 Tesla. BJU Int 110, E694–700. [DOI] [PMC free article] [PubMed] [Google Scholar]
- Noor E, Bar-Even A, Flamholz A, Reznik E, Liebermeister W, and Milo R (2014). Pathway thermodynamics highlights kinetic obstacles in central metabolism. PLoS Comput Biol 10, e1003483. [DOI] [PMC free article] [PubMed] [Google Scholar]
- Priolo C, Pyne S, Rose J, Regan ER, Zadra G, Photopoulos C, Cacciatore S, Schultz D, Scaglia N, McDunn J, et al. (2014). AKT1 and MYC induce distinctive metabolic fingerprints in human prostate cancer. Cancer Res 74, 7198–7204. [DOI] [PMC free article] [PubMed] [Google Scholar]
- Pucar D, Shukla-Dave A, Hricak H, Moskowitz CS, Kuroiwa K, Olgac S, Ebora LE, Scardino PT, Koutcher JA, and Zakian KL (2005). Prostate cancer: correlation of MR imaging and MR spectroscopy with pathologic findings after radiation therapy-initial experience. Radiology 236, 545–553. [DOI] [PMC free article] [PubMed] [Google Scholar]
- Rosenkrantz AB, Verma S, and Turkbey B (2015). Prostate cancer: top places where tumors hide on multiparametric MRI. AJR Am J Roentgenol 204, W449–456. [DOI] [PubMed] [Google Scholar]
- San-Millan I, and Brooks GA (2017). Reexamining cancer metabolism: lactate production for carcinogenesis could be the purpose and explanation of the Warburg Effect. Carcinogenesis 38, 119–133. [DOI] [PMC free article] [PubMed] [Google Scholar]
- Siegel RL, Miller KD, and Jemal A (2018). Cancer statistics, 2018. CA Cancer J Clin 68, 7–30. [DOI] [PubMed] [Google Scholar]
- Smith JA Jr., Chan RC, Chang SS, Herrell SD, Clark PE, Baumgartner R, and Cookson MS (2007). A comparison of the incidence and location of positive surgical margins in robotic assisted laparoscopic radical prostatectomy and open retropubic radical prostatectomy. J Urol 178, 2385–2389; discussion 2389–2390. [DOI] [PubMed] [Google Scholar]
- Starobinets O, Simko JP, Kuchinsky K, Kornak J, Carroll PR, Greene KL, Kurhanewicz J, and Noworolski SM (2017). Characterization and stratification of prostate lesions based on comprehensive multiparametric MRI using detailed whole-mount histopathology as a reference standard. NMR Biomed 30. [DOI] [PMC free article] [PubMed] [Google Scholar]
- Taylor BS, Schultz N, Hieronymus H, Gopalan A, Xiao Y, Carver BS, Arora VK, Kaushik P, Cerami E, Reva B, et al. (2010). Integrative genomic profiling of human prostate cancer. Cancer Cell 18, 11–22. [DOI] [PMC free article] [PubMed] [Google Scholar]
- Tee SS, Suster I, Truong S, Jeong S, Eskandari R, DiGialleonardo V, Alvarez JA, Aldeborgh HN, and Keshari KR (2018). Targeted AKT Inhibition in Prostate Cancer Cells and Spheroids Reduces Aerobic Glycolysis and Generation of Hyperpolarized [1-(13)C] Lactate. Mol Cancer Res 16, 453–460. [DOI] [PMC free article] [PubMed] [Google Scholar]
- Tessem MB, Swanson MG, Keshari KR, Albers MJ, Joun D, Tabatabai ZL, Simko JP, Shinohara K, Nelson SJ, Vigneron DB, et al. (2008). Evaluation of lactate and alanine as metabolic biomarkers of prostate cancer using 1H HR-MAS spectroscopy of biopsy tissues. Magnetic resonance in medicine 60, 510–516. [DOI] [PMC free article] [PubMed] [Google Scholar]
- Tropp J, Lupo JM, Chen A, Calderon P, McCune D, Grafendorfer T, Ozturk-Isik E, Larson PE, Hu S, Yen YF, et al. (2011). Multi-channel metabolic imaging, with SENSE reconstruction, of hyperpolarized [1-(13)C] pyruvate in a live rat at 3.0 tesla on a clinical MR scanner. J Magn Reson 208, 171–177. [DOI] [PMC free article] [PubMed] [Google Scholar]
- Updegraff BL, Zhou X, Guo Y, Padanad MS, Chen PH, Yang C, Sudderth J, Rodriguez-Tirado C, Girard L, Minna JD, et al. (2018). Transmembrane Protease TMPRSS11B Promotes Lung Cancer Growth by Enhancing Lactate Export and Glycolytic Metabolism. Cell Rep 25, 2223–2233 e2226. [DOI] [PMC free article] [PubMed] [Google Scholar]
- Valencia T, Kim JY, Abu-Baker S, Moscat-Pardos J, Ahn CS, Reina-Campos M, Duran A, Castilla EA, Metallo CM, Diaz-Meco MT, et al. (2014). Metabolic reprogramming of stromal fibroblasts through p62-mTORC1 signaling promotes inflammation and tumorigenesis. Cancer Cell 26, 121–135. [DOI] [PMC free article] [PubMed] [Google Scholar]
- Wright JL, and Ellis WJ (2006). Improved prostate cancer detection with anterior apical prostate biopsies. Urol Oncol 24, 492–495. [DOI] [PubMed] [Google Scholar]
Associated Data
This section collects any data citations, data availability statements, or supplementary materials included in this article.
Supplementary Materials
Data Availability Statement
The Raw IMPACT sequencing data generated during this study are available at the European Variation Archive (EVA, Accession code: PRJEB33969) as well as through cbioportal.org at the following links: