

SUMMARY
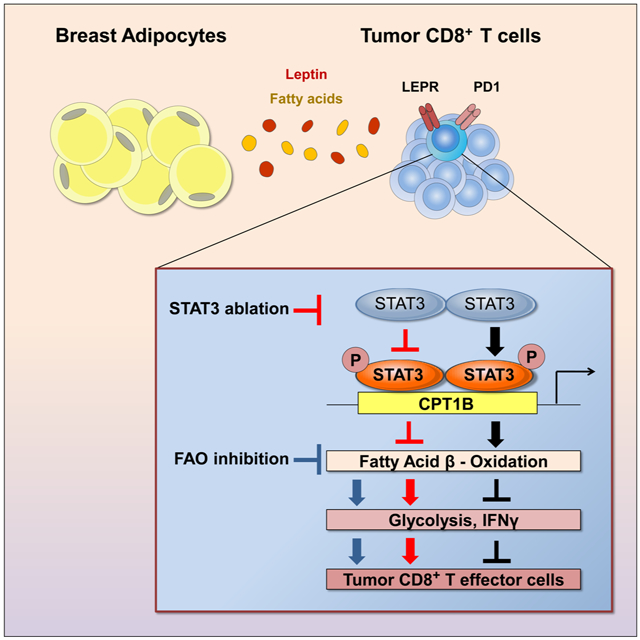
Although obesity is known to be critical for cancer development, how obesity negatively impacts antitumor immune responses remains largely unknown. Here we show that increased fatty acid oxidation (FAO) driven by activated STAT3 in CD8+ T effector cells is critical for obesity-associated breast tumor progression. Ablating T cell Stat3 or treatment with an FAO inhibitor in obese mice spontaneously developing breast tumor reduces FAO, increases glycolysis and CD8+ T effector cell functions, leading to inhibition of breast tumor development. Moreover, PD-1 ligation in CD8+ T cells activates STAT3 to increase FAO, inhibiting CD8+ T effector cell glycolysis and functions. Finally, leptin enriched in mammary adipocytes/fat tissues downregulates CD8+ T cell effector functions through activating STAT3-FAO and inhibiting glycolysis. We identify a critical role of increased oxidation of fatty acids driven by leptin and PD-1 through STAT3 in inhibiting CD8+ T effector cell glycolysis and in promoting obesity-associated breast tumorigenesis.
Graphical Abstract
In Brief
Obesity contributes to cancer development but the underlying mechanisms are not well understood. Zhang and Yue et al. show that a leptin-STAT3 axis increases oxidation of fatty acids within CD8+ effector T cells in breast cancer, leading to inhibition of antitumor immune responses. Blocking STAT3 or fatty acid oxidation increases CD8+ T cell glycolysis and antitumor function.
INTRODUCTION
Obesity has become an epidemic in diverse populations and mounting evidence indicates that obesity increases the risk of cancers and hinders therapeutic interventions (Calle et al., 2003; Calle and Thun, 2004; Font-Burgada et al., 2016; Nakagawa et al., 2014; Patel et al., 2008). A number of pioneering studies have implicated a critical role of deregulated inflammation in obesity-associated cancer progression (Font-Burgada et al., 2016; Nakagawa et al., 2014; Wolf et al., 2014). In particular, it has been demonstrated that hepatocellular carcinoma (HCC) is promoted by dietary or genetic abnormality–associated obesity in mice. Obesity-promoted HCC is largely attributed to hepatic inflammation induced by IL-6 and TNF, leading to activation of oncogenic STAT3 (Nakagawa et al., 2014). However, the mechanisms that underlie obesity-associated tumor progression and therapy resistance in other cancers, such as breast cancer and colon cancer, are to be further investigated. Furthermore, how the excess of exogenous fatty acids associated with obesity may directly contribute to cancer progression remains to be explored. A recent publication showed that obesity is linked to PD-1-mediated T cell dysfunction in cancer, which is at least in part driven by leptin (Wang et al., 2019). However, the mechanisms underlying the T cell dysfunction in obesity remain to be further investigated.
STAT3 is a transcription factor that has a critical role in upregulating tumor cell survival/proliferation in diverse human cancers (Yu et al., 2007; Yu et al., 2009). STAT3 can induce cancer-promoting inflammation, which contributes to obesity-induced HCC (Font-Burgada et al., 2016; Yu et al., 2014; Yu et al., 2009). Our recent study has also implicated that STAT3 intrinsic to T cells promotes obesity, insulin resistance and type 2 diabetes (Priceman et al., 2013). STAT3 has been demonstrated to be an important checkpoint that blocks anti-tumor immune responses in a variety of immune cells (Herrmann et al., 2010; Iwata-Kajihara et al., 2011; Kortylewski et al., 2005; Kortylewski et al., 2009; Moreira et al., 2018; Zhang et al., 2016). An important role of STAT3 in Th17, CD4+ follicular helper cells and regulatory T cells as well as CD8+ effector and memory T cells has also been shown (Cui et al., 2011; Hossain et al., 2013; Ray et al., 2014; Wang et al., 2009b). Ablating/silencing Stat3 in CD4+ and CD8+ T cells enhances the frequency of Th1 and granzyme B+ (GzmB) CD8+ T cells, which can significantly increase tumor infiltration of CD8+ TEFF cells and antitumor immunity (Herrmann et al., 2015; Kujawski et al., 2010; Wei et al., 2013; Yu et al., 2007; Yu et al., 2009; Yue et al., 2015). The Th1 immune responses induced by STAT3 silencing/knockout in various immune cells including T cells are associated with increased expression of IFNγ, and many of its inducible molecules, such as IL-12 and CXCL10 (Herrmann et al., 2010; Kortylewski et al., 2009; Lee et al., 2011; Wang et al., 2004; Yu et al., 2009; Yue et al., 2015). Because STAT3 is a transcription activator, how STAT3 inhibits expression of Th1 stimulating molecules remains to be further explored.
Metabolic reprogramming plays a critical role in regulating T cell functions (Chang et al., 2015; Chowdhury et al., 2018; Gemta et al., 2019; Ho et al., 2015; Hu et al., 2019; Le Bourgeois et al., 2018; Ma et al., 2019; Patsoukis et al., 2015; Zhang et al., 2017). Several recent publications provide strong evidence that reduced glycolysis in CD8+ T effector (TEFF) cells inhibits their activity, including antitumor effector functions (Chang et al., 2015; Gemta et al., 2019; Hu et al., 2019; Ho et al., 2015; Siska et al., 2017). High glucose consumption by rapidly proliferating tumor cells reduces CD8+ T cell glycolysis, which in turn inhibits IFNγ production. Expression and availability of IFNγ is essential for CD8+ TEFF cell proliferation and antitumor immunity. Reducing tumor size by anti-PD-1/PD-L1 antibody therapy restores glucose availability in the tumor microenvironment, thereby enabling CD8+ TEFF cell glycolysis and IFNγ production (Chang et al., 2015). Fat metabolism, which requires FAO, has been linked to longevity of cells (van der Windt and Pearce, 2012; Wang et al., 2008; Zaugg et al., 2011). In contrast to CD8+ TEFF cells that are highly proliferative and short-lived, memory CD8+ T cells are long-lived and require FAO as well as STAT3 to maintain their phenotype (Cui et al., 2011; O'Sullivan et al., 2014; Pearce et al., 2009; Siegel et al., 2011; Sukumar et al., 2013; van der Windt et al., 2012). It has also been reported that PD-1 can reprogram T-cell metabolism by inhibiting glycolysis and promoting FAO, leading to suppression of antitumor immune responses (Patsoukis et al., 2015).
Although it has been well documented that glycolysis is critical for CD8+ TEFF cell antitumor activities while FAO is essential for CD8+ T memory cell phenotype, there are reports suggesting that increasing FAO can enhance the efficacy of adoptively transferred CD8+ effector T cells or PD-1 blockade (Chowdhury et al., 2018; Zhang et al., 2017). While PPAR-induced FAO in T cells led to an increase in the number of tumor-reactive CD8+ T cells, an upregulation of glycolysis in the T cells by the PPAR agonist was also observed (Chowdhury et al., 2018). The other publication supporting the role of FAO in increasing T cell antitumor effects was done within a metabolically challenging tumor microenvironment (Zhang et al., 2017). Taken together, these studies suggest an important and complex role of metabolic regulation in CD8+ T cells in cancer, warranting further studies on the role of FAO on CD8+ T cell effector functions.
Our recent studies demonstrated that JAK/STAT3 regulates FAO pathway in breast cancer stem cells (CSCs) and chemo-resistant tumor cells, promoting self-renewal and resistance to therapy (Wang et al., 2018). Because CD8+ TEFF cells are capable of utilizing exogenous fatty acids (FAs), we hypothesized that the excess FAs made available by obesity may also favor CD8+ TEFF cells to use FA oxidation as an energy source, which may in turn affect glycolysis within TEFF cells. Since STAT3 inhibition-induced Th1 antitumor immune responses are largely mediated by IFNγ, its inducible cytokines and other mediators, we considered the possibility that STAT3 may inhibit tumor-associated CD8+ TEFF cells by switching CD8+ T cell metabolism from mainly glycolytic to FAO and thereby promoting obesity-associated breast tumor progression.
RESULTS
Obesity-promoted breast tumor development is associated with loss of functional tumor CD8+ TEFF cells
The cellular and molecular mechanisms underlying obesity-promoted breast cancer remain to be further identified. Tumor progression, in general, is greatly contributed by compromised immune surveillance (Matsushita et al., 2012; Vesely and Schreiber, 2013). A recent study showed that obesity associated tumor progression is associated with T cell exhaustion in transplantation tumor models (Wang et al., 2019). However, it remains to be explored whether obesity-associated T cell suppression contributes to breast tumor development. We chose the Mouse Mammary Tumor Virus-Polyoma Virus Middle T antigen (MMTV-PyMT, later referred as PyMT) transgenic female mice for our studies, because they develop spontaneous palpable mammary tumors that mimic human breast cancers (Lin et al., 2003). We used a high fat diet (HFD) to induce obesity in the PyMT mice. Mice on a HFD gained significantly more body weight, relative to their counterparts fed on low fat diet (LFD) (Figure 1A). HFD-induced obese mice showed significant earlier onset of breast tumors (Figure 1B) and increased tumor weight (Figure 1C) and lung metastasis (Figure 1D). In addition, tumors from mice on HFD showed significantly decreased expression of the apoptotic marker cleaved caspase-3 in CD45− cells, which are mainly tumor cells (Figure S1A-B). In contrast, cleaved caspase-3 expression in CD45+ immune cells was increased in tumors from HFD-fed mice (Figure S1C). This is accompanied by a significant restriction in functional CD8+ TEFF cells in the tumors developed in obese mice, as indicated by a significant reduction of CD8+ T cells percentages with markers for cytolytic activity, including IFNγ, granzyme B (GzmB) and CD107a (Figure 1E). Similar results were observed in tumor antigen specific CD8+ T cells from PyMT ChOVA transgenic mice, in which tumor cells express ovalbumin (OVA) (Figure S1D). Furthermore, the absolute number of activated CD8+ T cells was decreased in tumor from HFD-induced obese mice (Figure S2A). To assess whether the difference in tumor size might impact CD8+ TEFF cell functions, we analyzed CD8+ TEFF cell numbers using tumors with similar weights from HFD- and LFD-fed tumor bearing mice (Figure S2B-C).
Figure 1. Obesity-promoted breast cancer is associated with inhibition of tumor infiltrating CD8+ TEFF cells.

Wild type (WT) or PyMT mice were fed on HFD or LFD from 8-10 weeks of age. (A) Body weights (n = 4), and (B) tumor onsets were monitored at indicated times (n = 14-16). Mammary tumors were collected for measurement of (C) tumor weights (n = 16-20); and (D) lung metastasis (n = 16) as well as (E) analysis by flow cytometry for TEFF (IFNγ+ or GzmB+ or CD107a+) in CD3+CD8+ T cells (n = 3; n is for number of samples, each of which was pooled from 2-3 mice) . (F) Representative immunofluorescence images of tumor sections from lean (BMI<25) or obese (BMI>32.5) breast cancer patients; CD8 (green), GzmB (red), Hoechst (blue), scale bar =10 μm. Data shown are average positive counts from five random views (CD8+ areas) per section from 4 patient tumors (n = 4). (G) Flow cytometry analysis of CD3+CD8+ T cells from TDLNs of lean (BMI<25) and obese (BMI>32.5) breast cancer patients (n = 7). All data are shown with mean ± SEM. See also Figure S1 and Figure S2.
To assess whether lack of functional antitumor CD8+ TEFF cells might also have a role in promoting obesity-associated breast tumors in patients, we examined tumor-infiltrating functional CD8+ T cells in lean (BMI<25) and obese (BMI>32.5) breast cancer patients. Data from immunofluorescent staining followed by microscopic analysis indicated that the expression of GzmB in CD8+ T cells in the tumor specimens from obese breast cancer patients was significantly decreased (Figure 1F). Flow cytometry analysis further indicated a significant loss of CD8+ T cells in the tumor draining lymph nodes (TDLNs) of obese breast cancer patients (Figure 1G). These findings suggest that breast tumor infiltrating CD8+ TEFF cells are inhibited in obesity, which may contribute to obesity-promoted breast cancer development.
Inhibition of TEFF cells via STAT3 is critical for obesity-promoted breast tumor development
We next tested whether inhibition of CD8+ TEFF cells is required for obesity-promoted breast tumor development. STAT3 in T cells has been shown to be critical for diet-induced obesity and insulin resistance (Priceman et al., 2013), and STAT3 is known to inhibit expression of factors and molecules critical for Th1 immune responses in various immune subsets including CD8+ T cells in the tumor microenvironment (Herrmann et al., 2010; Herrmann et al., 2015; Kortylewski et al., 2009; Kujawski et al., 2010; Lee et al., 2011; Wang et al., 2004; Wei et al., 2013; Yu et al., 2007; Yu et al., 2009; Yue et al., 2015). Therefore, we examined whether T cells, via STAT3 signaling, are a critical contributor for obesity-promoted breast cancer development. We generated PyMT mice with either Stat3+/+ or Stat3−/− (Stat3 functional knockout involving a small deletion that affects phospho-STAT3 (Tyr 705) (p-STAT3) (Kortylewski et al., 2009; Priceman et al., 2013; Takeda et al., 1999; Takeda et al., 1998) T cells. The significant increase of tumor burdens due to obesity in PyMT mice was abrogated by functional ablation of Stat3 in T cells (Figure 2A). Loss of Stat3 function in T cells also reduced breast tumor lung metastasis incidence and burdens in the obese PyMT mice (Figure 2B). Moreover, percentages of tumor-infiltrating functional CD8+ TEFF cells were increased in the PyMT obese mice when T cell Stat3 signal was absent (Figure 2C). In addition, CD8+ T cells cultured with breast tumor supernatant (TSN) showed enhanced proliferation when Stat3 was ablated (Figure 2D), which is in agreement with previous findings (Kujawski et al., 2010). Tumor supernatant was used to boost Stat3 activity in the T cells. Analyses of breast cancer patient tumor tissues also showed an increased p-STAT3 level in CD8+ T cells from obese patients (Figure S3A).
Figure 2. Ablating Stat3 in T cells enhanced tumor infiltrating TEFF accumulation, proliferation and inhibited tumor development.

PyMT/Stat3+/+ and PyMT/Stat3−/− mice were fed on a HFD or LFD and tumors were collected. (A) Tumor weights were measured (n = 7- 9), and (B) Counts of lung metastasis and H&E staining, scale bar =50 μm, n = 3; (C) Single-cell suspensions prepared from the tumors were analyzed by flow cytometry for activated TEFF (IFNγ+ or GzmB+ or CD107a+) in CD3+CD8+ T cells, n = 3. n is for number of samples, each of which was pooled from 2-3 mice)(D) Proliferation analysis of PyMT tumor-primed splenic CD3+CD8+ T cells cultured in vitro with 10% tumor supernatant (TSN) for 24 h. (E-F) PyMT mice were fed on a HFD from 8-10 weeks of age followed by treating with PBS (vehicle), Luc (CTLA4 (apt)-Luciferase siRNA) or siRNA (CTLA4 (apt)-Stat3 siRNA) from day 120, once every two days for three weeks, n = 6. Tumors were then harvested for weight measurement (E) and for generating single-cell suspensions for flow cytometry analysis of TEFF cells (F), n = 3. All data are shown with mean ± SEM. See also Figure S3.
Our group has developed an in vivo T cell-specific siRNA delivery approach by covalently linking an siRNA to an aptamer (apt) that selectively binds to cytotoxic T lymphocyte-associated antigen 4 (CTLA4). CTLA4-siRNA conjugate administration in vivo allows gene silencing in T cells, especially those in the tumor microenvironment (Herrmann et al., 2015). We utilized CTLA4 (apt)-Stat3 siRNA to inhibit Stat3 activity in T cells in PyMT mice. Silencing Stat3 reduced p-Stat3 level in tumor-infiltrating CD8+ T cells (Figure S3B). We further showed that CTLA4 (apt)-Stat3 siRNA treatments in high-fat diet fed mice and restricted PyMT breast tumor growth (Figure 2E) and facilitated functional tumor infiltrating CD8+ TEFF cells, compared to those groups treated by PBS (vehicle control) or CTLA4 (apt)-luciferase siRNA (Luc) (Figure 2F). These results support that STAT3 activation intrinsic to T cells is crucial for obesity-induced breast tumor progression.
STAT3 mediates CD8 TEFF cell inhibition by promoting FAO while reducing glycolysis
An important unanswered question is whether STAT3 could regulate metabolism in CD8+ TEFF cells in the tumor microenvironment, especially in the presence of excess fatty acids associated with obesity. Although CD8+ central memory T (TCM) cells are known to utilize FAO as an energy source for survival, CD8+ TEFF cells depend on aerobic glycolysis for their effector functions (Cham et al., 2008; Chang et al., 2013; Lochner et al., 2015). CD8+ TEFF cell glycolysis leads to IFNγ upregulation and TEFF activation. A critical role of STAT3 in inhibiting CD8+ TEFF cell functions in tumors has been associated with blocking expression of IFNγ and many of its inducible factors (Herrmann et al., 2015; Kujawski et al., 2010; Wei et al., 2013; Yu et al., 2007; Yu et al., 2009; Yue et al., 2015). We have recently identified that JAK-STAT3 activates the FAO pathway selectively in breast CSCs and chemo-resistant tumor cells (Wang et al., 2018). Since fatty acids are the substrates for FAO, and CD8+ TEFF cells are able to acquire exogenous FAs (O'Sullivan et al., 2014), we assessed whether STAT3 could also upregulate FAO in tumor-associated TEFF cells, which in turn, could lead to inhibition of glycolysis and expression of IFNγ and its inducible Th1 mediators.
Our studies in breast tumor CSCs and/or chemo-resistant tumor cells showed that Carnitine palmitoyltransferase 1B (CPT1B), which encodes the critical and rate-limiting enzyme for FAO, is a direct target gene of STAT3 (Wang et al., 2018). We sorted tumor infiltrating CD3+CD8+ T cells from PyMT mice with Stat3+/+ or Stat3−/− T cells. Ablating Stat3 in T cells led to downregulation of CPT1B in the breast tumor infiltrating CD3+CD8+ T cells (Figure 3A, left). Additionally, FAO activity in CD8+ T cells was significantly repressed in the breast tumors from the mice with Stat3−/−T cells (Figure 3A, right). Furthermore, by comparing splenic CD8+ T cells from tumor-free mice to tumor-infiltrating CD8+ T cells, we showed that the metabolic changes observed are specifically in response to the tumor microenvironment (Figure S4A and S4B). To further address the effects of Stat3 functional ablation on FAO in CD8+ T cells, we adoptively transferred CD8+ T cells with or without functional Stat3 into Rag1−/− obese mice, followed by establishing PyMT tumors with Py8119 tumor cells. Furthermore, ablating Stat3 in CD8+ T cells led to inhibition of FAO, which was also accompanied by an increase of CD8+ TEFF cells with functional markers, including IFNγ, GzmB and CD107a, the last of which measures T cell cytotoxicity, and a decrease in tumor growth (Figure 4). In vitro tumor-primed Stat3−/− CD3+CD8+ T cells also showed a decrease in FAO when compared to their Stat3+/+ counterparts (Figure S4C). We also showed that silencing Stat3 in tumor-associated T cells resulted in a decrease in FAO (Figure 3B). Immunofluorescence analysis of tumor sections from HFD-fed PyMT mice with Stat3+/+ or Stat3−/− T cells demonstrated that CPT1B expression in CD8+ T cells was significantly reduced when Stat3 was functionally ablated (Figure 3C). In a similar fashion, treatments with CTLA4 (apt)-Stat3 siRNA resulted in CPT1B expression downregulation in the tumor infiltrating CD3+CD8+ T cells (Figures S4E). Furthermore, IL-6-induced Stat3 activation in CD8+ T cells led to inhibition of IFNγ and upregulation of CPT1b gene expression (Figure S5). Tumors from obese breast cancer patients, which showed enhanced STAT3 activity in CD8+ T cells (Figure S3A), also exhibited increased CPT1B expression (Figure S4F). These results showed that, in addition to breast CSCs, STAT3 upregulates CPT1B-FAO in tumor-associated CD8+ T cells. Since STAT3 activity upregulates FAO in tumor-associated CD8+ T cells, we addressed whether Stat3 in TEFF cells would repress glycolysis. We performed qPCR using tumor infiltrating Stat3+/+ and Stat3−/− CD3+CD8+ T cells of critical glycolic indicators, including Glyceraldehyde 3-phosphate dehydrogenase (GAPDH) and Hexokinase II (HK2). Results showed that loss of Stat3 expression led to elevated expression of GAPDH and HK2 (Figure 3D-3E and Figure 4B). We also identified an increased level of GAPDH in Stat3−/− tumor-primed splenic CD3+CD8+ T cells cultured in vitro compared to their Stat3+/+ counterparts (Figure S4D). We confirmed that Stat3 inhibits glycolysis in CD8+ T cells by direct measurement of the extracellular acidification rate (ECAR), an indicator of glycolic level, in Stat3+/+ and Stat3−/− tumor-primed splenic CD3+CD8+ T cells cultured in vitro with TSN. Stat3−/− CD3+CD8+ T cells displayed elevated glycolytic capacity when compared to their Stat3+/+ counterparts (Figure 3F). These results suggest that STAT3 inhibits TEFF cell glycolysis in the tumor microenvironment.
Figure 3. STAT3 promotes tumor TEFF cell FAO while inhibiting glycolysis.

(A) Tumors were harvested from HFD-fed PyMT/Stat3+/+ and PyMT/ Stat3−/− PyMT mice (n = 6), and intra-tumor CD3+CD8+ T cells were sorted for measurement of FAO and CPT1B mRNA expression (n= 2-3, n is for number of samples, each of which was pooled from 2-3 mice). (B) PyMT mice (n = 6) treated with indicated controls or CTLA4 (apt)-Stat3 siRNA (as in Figure 2), and intra-tumor CD3+CD8+ T cells were sorted for FAO measurement (n = 3). (C) Representative immunofluorescence images of CD8 (green), CPT1B (red) and Hoechst (blue) on tumor sections from Stat3+/+ or Stat3−/− PyMT mice, scale bar = 10 μm. (D) CD3+CD8+ T cells sorted same as in (A) were analyzed for expression of the indicated genes by qPCR (n = 2-3). (E) Flow cytometric analysis of GAPDH and HK2 in tumor infiltrated CD8+ T cell from Stat3+/+ or Stat3−/− mice (n = 4-6). Splenic CD3+CD8+ T cells were cultured in vitro with 10% TSN, followed by measurement of extracellular acidification rate (ECAR). All data are shown with mean ± SEM. See also Figure S4 and Figure S5
Figure 4. Ablating STAT3 in CD8+ T cell enhanced CD8+ T cell anti-tumor effect by reducing FAO while promoting glycolysis.

(A-B) Purified CD8+T cells from mice with or without functional Stat3 were adoptively transferred into Rag1−/− obese mice, followed by tumor establishment with Py8119 tumor cells. Sorted tumor-infiltrating CD8+ T cells from tumor-bearing mice were analyzed for FAO and CPT1B (A) and GAPDH, HK2 gene expression (B) (n = 3, n is for number of samples, each of which was pooled from 2-3 mice). (C) Tumors were collected and tumor weight was measured (n = 8). (D) Single-cell suspensions prepared from the tumors were analyzed by flow cytometry for activated TEFF (IFNγ+ or GzmB+ or CD107a+) in CD3+CD8+ T cells (n = 7-8) . All data are shown with mean ± SEM. See also Figure S4 and Figure S5.
FAO inhibition promotes glycolysis and restores tumor TEFF cell function
To directly address whether Stat3-mediated FAO upregulation inhibits glycolysis in tumor-infiltrating TEFF cells to compromise their antitumor functions in obese PyMT mice, we used CPT1-FAO inhibitors to determine their effects on CD8+ T cell glycolysis. We measured FAO levels in tumor-primed splenic CD3+CD8+ T cells (derived from tumor-bearing obese PyMT mice) cultured in vitro in the presence of TSN. Treating the cultured splenic CD3+CD8+ T cells with CPT1 inhibitor, etomoxir, significantly reduced FAO (Figure 5A) while increasing expression of glycolic genes, GAPDH and HK2 (Figure 5B). Furthermore, we utilized perhexiline, another CPT1 inhibitor, to treat PyMT mice fed on HFD. Our results showed that perhexiline treatments inhibited breast tumor growth and increased IFNγ and GzmB expressing tumor-infiltrating CD3+CD8+ T cells (Figure 5C-D).
Figure 5. Inhibition of FAO restores tumor TEFF cell functions, leading to restriction of tumor growth.

(A-B) PyMT tumor-primed splenic CD3+CD8+ T cells were cultured in vitro with anti-CD3ε (1 μg/ml), anti-CD28 antibody (1 μg/ml) and IL-2 (20 ng/ml), and 10% TSN for 5 days followed by addition of PBS or etomoxir. FAO levels and GAPDH mRNA expression are shown. Representative data from four independent experiments are shown (n = 3). (C-D) PyMT mice were fed on a HFD from 8-10 weeks of age followed by treating with PBS (vehicle), or perhexiline (5mg/kg) from day 120, once every two days for three weeks. Tumors were then collected for weight measurement (C) (n = 6), and single-cell suspensions for flow cytometry analysis of TEFF cells (D) (n = 3). All data are shown with mean ± SEM. See also Figure S6 and Figure S7.
To test whether CPT1B inhibition could restore tumor CD8+ T cell function, we treated the PyMT tumor-bearing mice with CTLA4 (apt)-CPT1B siRNA, CTLA4 (apt)-luc siRNA control construct or PBS. CPT1B was partially knockdown in the tumor-infiltrating CD8+ T cells by CTLA4 (apt)-CPT1B siRNA treatment, which was accompanied by a reduction of FAO rate (Figure S6A-C), as well as an increase in IFNγ and GzmB producing CD8+ TEFF cells (Figure S6D). We also observed partial inhibition of tumor growth by CTLA4 (apt)-CPT1B siRNA treatment (Figure S6E). However, the antitumor effects failed to reach significance when compared with the control groups, and were not as strong as the small-molecule CPT1/FAO inhibitor, which inhibits CPT/FAO in tumor cells and in other cell types in the tumor microenvironment (Figure 5C). The partial inhibitory effects on tumor growth could be due to the lack of strong efficacy of CTLA4(apt)-CPT1B siRNA approach for delivering siRNA into tumors in mammary fat pads (only partial knockdown, Figure S6A) or Cpt1b is not the only enzyme responsible for FAO upregulation in the tumor-infiltrating CD8+ T cells. We therefore performed experiments to determine if Cpt1a and Cpt1c are also regulated by STAT3 in the breast tumor setting. Our results indicated that STAT3 only regulates Cpt1b in the PyMT breast tumor microenvironment, and STAT3 directly binds to the Cpt1b promoter, but not the Cpt1a or Cpt1c promoters (Figure S7).
PD-1 engagement-induced FAO dominance requires STAT3
PD-1 is critical for TEFF cell inhibitory function (Francisco et al., 2010; Shin et al., 2005; Topalian et al., 2015). A recent study showed that, in activated CD4+ T cells in cell culture, PD-1 promotes FAO and inhibits glycolysis (Patsoukis et al., 2015). However, the underlying molecular mechanism remains to be identified. Thus, we tested the hypothesis that PD-1-mediated metabolic programming involves STAT3. Adding PD-L1 or leptin to cultured Stat3+/+ CD8+ T cells increased Stat3 activity, which was abrogated by Stattic, a small molecule STAT3 inhibitor (Figure 6A). PD-L1-induced STAT3 activation was dependent on PD-1 expression on CD8+ T cells (Figure 6A). Furthermore, PD-1 engagement enhanced FAO in Stat3+/+ CD8+ T cells cultured in vitro with TSN. In stark contrast, Stat3−/− CD8+ T cells, cultured under the same conditions, failed to respond to PD-L1/PD-1-induced FAO production (Figure 6B). In addition, although PD-L1/PD-1 ligation inhibited expression of glycolic genes, GAPDH and HK2, it failed to reduce the expression of the two glycolic genes in Stat3−/− CD8+ T cells (Figure 6C). PD-L1/PD-1 ligation increased CPT1B expression in Stat3+/+ but not in Stat3−/−CD8+ T cells (Figure 6D). These findings provide evidence that STAT3 plays a role in PD-1 mediated glycolytic inhibition in CD8+ T cells.
Figure 6. PD-1-mediated TEFF cell FAO promotion and glycolysis inhibition requires STAT3.

(A) CD8+ T cells harvested from spleens of the indicated mice were treated with leptin (200 ng/ml) or IL-6 (20ng/ml) for 30 min, PD-L1 (500 ng/ml) for 3 h and 6h, or pretreated with Stattic (10 μM) for 30 min followed by PD-L1 for 3 has indicated. Cell lysates were analyzed by Western blotting for indicated proteins. (B-D) PyMT tumor-primed splenic CD3+CD8+ T cells were cultured in vitro with anti-CD3ε (1 μg/ml), anti-CD28 antibody (1 μg/ml) and IL-2 (20 ng/ml), and 10% TSN for 5 days followed by addition of PBS or PD-L1 (100 ng/ml) for 8 days, and measurement of FAO (B), GAPDH and HK2 mRNA expression (C) and CPT1B mRNA expression (D). All data shown are representative of four independent experiments, mean ± SEM.
Leptin-induced STAT3 activation contributes to metabolic reprogramming in TEFF cells
Adipocytes are abundant in the breast tumor microenvironment, especially in obese patients (D'Esposito et al., 2016; Wang et al., 2012). Adipocytes are known to secrete adipokines, including leptin, to mediate crosstalk between cancer cells and host cells in the tumor microenvironment (Ando et al., 2014; Gilbert and Slingerland, 2013). Leptin receptors are highly expressed in activated T cells (Maciolek et al., 2014). Although somewhat controversial, several recent studies suggest an important role of leptin/leptin receptor signaling in breast cancer (Assiri et al., 2015; Battle et al., 2014; Iyengar et al., 2016; Miyoshi et al., 2006; Surmacz, 2007; Wang et al., 2019). Leptin has been shown to activate STAT3 in breast CSCs, leading to FAO activity (Wang et al., 2018). We therefore performed a leptin neutralization experiment using anti-leptin antibody treatments in PyMT mice fed on HFD. We observed restricted tumor growth (Wang et al., 2018), and enhanced functional tumor CD8+ TEFF cells (Figure 7A). Neutralization of leptin in obese PyMT mice resulted in reduced Stat3 activity and FAO in CD8+ TEFF cells (Figure 7B and 7C), as well as elevated expression of GAPDH and HK2 and reduced CPT1B expression (Figure 7D).
Figure 7. Leptin contributes to STAT3-upregulated FAO and tumor TEFF cell function inhibition.

(A-D) PyMT mice were fed on a HFD from 8-10 weeks of age followed by treating with PBS (vehicle), or anti-leptin antibody (250 μg/kg) from day 120 once every two days for three weeks. Tumors were then harvested to prepare single-cell suspension for flow cytometry analysis to measure activated TEFF cells (A) (n = 3); p-STAT3 (Y705) level (B) (n = 4); as well as FAO (C) (n = 3). GAPDH, HK2 and CPT1B mRNA expression levels were determined by qPCR (D) (n = 2-3). All data are shown with mean ± SEM. (E-H) Purified CD8+T cells from C57BL/6 wild type or db/db (leptin-receptor deficient) mice were adoptively transferred into Rag1−/− obese mice, followed by establishing tumors using Py8119 tumor cells (n = 8). Sorted tumor-infiltrating CD8+ T cells from tumor-bearing mice were analyzed for FAO rate and expression of the CPT1B, GAPDH and HK2 genes (E) (n = 3). Tumors were collected to prepare single-cell suspension for flow cytometry analysis of p-STAT3+, IFNγ and GzmB-producing CD8+ T cells (F) (n = 3). Levels of p-Stat3 in tumor infiltrating CD8+ T cells were shown by flow cytometry. Quantification of mean fluorescence intensity (MFI) is shown (n = 6) (G). Tumors were collected and tumor weights were measured (H) (n = 8). All data are shown with mean ± SEM.
Due to the effects of the anti-leptin antibody on tumor cells, we further tested whether inhibition of leptin-leptin receptor signaling in CD8+ T cells could improve tumor CD8+ T cell function by reducing FAO. We adoptively transferred CD8+ T cells purified from C57BL/6 wild-type and db/db (leptin-receptor deficient) mice into Rag1−/− obese mice, followed by establishing PyMT tumors with Py8119 tumor cells. In the absence of leptin receptor signaling in CD8+ T cells, CPT1B expression and FAO rate were reduced in the tumor-infiltrating CD8+ T cells (Figure 7E), while expression levels of GAPDH and HK2, as well as IFNγ and GzmB in the CD8+ T cells were increased (Figure 7E and 7F), which was also accompanied by a decrease in level of p-Stat3 (Figure 7G) and tumor growth (Figure 7H). Taken together, we find leptin derived from adipocytes activates STAT3 in tumor-infiltrating TEFF cells, which increases FAO and inhibits glycolysis, which is associated with dampened TEFF cell functions and enhanced breast tumor development.
DISCUSSION
It has been well established that obesity promotes various solid tumor progression. Mechanistically, this has been mainly attributed to dysregulated chronic inflammation (Font-Burgada et al., 2016; Nakagawa et al., 2014; Park et al., 2010). Recently, it has been reported that obesity is associated with T cell dysfunction in various types of cancer, which is mediated at least in part by increased leptin in the diet-induced obese microenvironment (Wang et al., 2019). Nevertheless, how excess fatty acids in obesity contribute to tumor development and progression requires further exploration. Our work revealed a new mechanism linking elevated fatty acids in obesity with inhibition of CD8+ TEFF cell glycolysis through the leptin/PD-1-STAT3-FAO pathway, thereby restricting CD8+ T cell antitumor functions.
Recent pioneering studies showed that high glucose consumption by rapidly proliferating tumor cells inhibits CD8+ T cell glycolytic activity, leading to inhibition of IFNγ production and effector functions (Chang et al., 2015; Ho et al., 2015). These studies emphasize the lack of glucose availability for CD8+ T cell consumption in the tumor microenvironment. Our findings suggest that the intrinsic metabolic reprogramming in tumor-associated CD8+ T cells by STAT3 also restricts antitumor CD8+ T effector cells. Our data on the role of STAT3 in inhibiting glycolysis in CD8+ TEFF cells also provide a new mechanism by which STAT3 inhibits IFNγ and Th1 cytokines. These findings provide an explanation to the paradoxical observations that lack of STAT3 in CD8+ T cells in the tumor microenvironment enables CD8+ T cell proliferation and upregulation of IFNγ and Th1 cytokines (Kujawski et al., 2010; Yue et al., 2015).
Raising glucose levels in the tumor microenvironment enables T cells to use glycolysis for energy, thereby increasing their antitumor immune responses (Chang et al., 2015; Ho et al., 2015). Our results suggest that regulating T cell intrinsic metabolic reprogramming, including targeting STAT3 and FAO, can reactivate CD8+ T cells in tumors via upregulating glycolysis. However, there are some published studies suggesting that FAO upregulation could support CD8+ T cell functions/activities against tumors (Chowdhury et al., 2018; Zhang et al., 2017). In particular, an agonist of PGC-1a/PPAR complexes can increase the number of tumor reactive CD8+ T cells. Although the agonist was shown to increase FAO, it also activated glycolysis (Chowdhury et al., 2018). Additionally, it has been shown that increasing fatty acid catabolism through FAO prior to adoptive transfer can increase antitumor effects of CD8+ T cells, and that upregulating FAO can increase anti-PD-1 antibody treatment (Zhang et al., 2017). Nevertheless, these studies were performed in a metabolically challenging tumor microenvironment (hypoglycemic and hypoxic) (Zhang et al., 2017). Our findings are from breast tumors in mammary fat pads with enriched adipocytes especially in obese hosts. In contrast to the studies cited above, the data we presented are mostly derived from the spontaneously developed PyMT breast tumor model, not subcutaneously implanted tumors. These seemingly opposing findings may reflect importance of different metabolic tumor microenvironment and/or types of tumor.
Our recent study demonstrates that blocking FAO also inhibits breast CSCs and breast tumor growth, as well as re-sensitizes drug-resistant breast cancer cells (Wang et al., 2018). These observations taken together suggest that blocking the STAT3-FAO pathway can have multi-pronged antitumor effects in breast tumor. Checkpoint immune-blockade therapy, including antibodies against PD-1 and PD-L1, are used in clinic to restore T cell proliferation and function. Chang et al showed that blocking PD-1 or PD-L1 in tumor microenvironment promoted T cell function by making glucose available for T cell glycolysis (Chang et al., 2015). The study on the activation of CD8+ TEFF cells in the tumor microenvironment by PD-1 and PD-L1 antibodies is attributed to the inhibition of tumor cells, which enables T cells to better compete for glucose (Chang et al., 2015). Our study identifies that PD-1 engagement by PD-L1 activates the STAT3-FAO pathway within CD8+ TEFF cells, which leads to inhibition of glycolysis. Patsoukis et al showed that PD-1 signaling promotes FAO and inhibits glycolysis in activated primary human CD4+ T cells (Patsoukis et al., 2015). Our results support their findings and provide a molecular mechanism by which PD-1 promotes FAO while inhibiting glycolysis in tumor-associated T cells.
Obese breast cancer patients have more adipocytes surrounding primary breast tumors. The adipocytes can produce excess fatty acids and adipokines, both of which are known to promote tumor progression (D'Esposito et al., 2016; Wang et al., 2012). Our recent study identified leptin as one of the key adipokines produced by breast adipocytes that can promote breast CSCs (Wang et al., 2018). Leptin is known to be able to activate JAK2/STAT3 (Vaisse et al., 1996) in T cells (Sanchez-Margalet and Martin-Romero, 2001). In activated T cells, leptin receptors are highly expressed, leading to their sensitivity to nutrient availability and differentiation (Maciolek et al., 2014). Leptin has also been recently shown to mediate obesity-associated T cell dysfunction in various tumor models (Wang et al., 2019). In this study, we show that leptin-STAT3 signaling promotes FAO and further inhibits glycolysis to reprogram CD8+ TEFF cell metabolism and its effector functions. A highly activated FAO pathway, in turn, should facilitate the use of fatty acids elevated in obesity as energy source, thereby impeding glycolysis. It has also been shown that leptin induces mTOR, which in turn defines a specific molecular signature controlling CD4+ effector T cells response (Procaccini et al., 2012). The apparently different roles of leptin in regulating effector T cells could be attributed to tumor vs. non-tumor contexts. A similar case is Myc, which has been shown to promote T cell glycolysis in non-tumor setting (Wang et al., 2011), but is critically involved in elevating FAO in triple-negative breast cancer cells (Camarda et al., 2016).
An important role of FAO in the maintenance of CD8+ memory T cells and hematopoietic stem cell (HSC) has been shown (Gattinoni et al., 2011; Ito et al., 2012; Lugli et al., 2013; Pearce et al., 2009; Sukumar et al., 2013; van der Windt and Pearce, 2012). CD8+ memory T cells and stem cells share several phenotypes (Gattinoni et al., 2011). In the case of T cells, FAO inhibition prevents differentiation toward the memory T cell lineage (Lochner et al., 2015; Priyadharshini and Turka, 2015). As for HSCs, blocking FAO depletes the HSC population (Ito et al., 2012). In contrast, glycolysis upregulation is needed to sustain the high anabolic needs of proliferating cells, such as TEFF cells and cancer cells (Lochner et al., 2015; Priyadharshini and Turka, 2015). STAT3 has been shown to be important for both CSC and memory T cell maintenance (Cui et al., 2011; Herrmann et al., 2014a; Schonberg et al., 2015; Schroeder et al., 2014; Siegel et al., 2011; Wang et al., 2009a). Our studies in tumor-infiltrating CD8+ T cells and in breast CSCs suggest that STAT3 regulates these distinct cell populations through a common pathway—leptin-STAT3-FAO. This pathway is favorable for sustaining homeostatic survival rather than rapid proliferation. STAT3 has also been reported to be critical for inhibition of T effector cells in viral infectious models (Cui et al., 2011; Siegel et al., 2011) as well as in the tumor microenvironment (Kujawski et al., 2010). Our current study showing STAT3 inhibition of glycolysis via upregulation of FAO provides a novel mechanism by which STAT3 accomplishes this inhibitory effect in T effector cells. Our data further suggest that mammary adipocyte-produced leptin, and fatty acids, both of which are in excess in obesity, support FAO pathway activation and/or utilization at the expense of glycolysis. In addition, we show that targeting leptin-STAT3-FAO may lead to potent antitumor T cell immune responses in addition to inhibition of CSCs and chemo-resistant tumor cells in breast cancer
Limitations of Study
Multiple approaches were used to show the importance of STAT3 in T cells in upregulating FAO. However, we did not show an increase in STAT3 without other stimuli can upregulate FAO. Our data suggest that the increase in FAO in CD8+ T cells is mediated by CPT1B, which is upregulated by STAT3. But direct targeting CPT1B in vivo using CTLA4 (apt)-Stat3 siRNA did not reach significance in terms of tumor growth inhibition. In this particular case, silencing of CPT1B in the tumor infiltrating T cells in vivo was partial, and activation of CD8+ T cells was significant. Although the partial inhibitory effects on tumor growth by CTLA4 (apt)-CPT1B siRNA could be caused by incomplete gene silencing via in vivo systemic delivery (Figure S6A), we cannot rule out the involvement of other pathways in addition to FAO in inhibiting CD8+ T cell Th1 antitumor immune responses. Another limitation of the current study is that in a set of adoptive transfer experiments we used T cells derived from db/db (Lepr-KO) mice with the goal to complement the data derived from depleting leptin with antibodies—confining leptin blocking effects in CD8 T cells. A potential better choice for the experiment is to use CD8+ T cells from T cell conditional Lepr-KO mice. However, both Lepr-KO mice display several immune anomalies. If one adds back leptin in the KO mice, it also impacts tumor cells and other immune cells. Thus, we did not find a way to rule out the potential complications from immune anomalies during mouse development.
STAR ★ METHODS
LEAD CONTACT AND MATERIALS AVAILABILITY Lead Contact
Further information and requests for resources and reagents should be directed to the lead contact, Dr. Hua Yu (hyu@coh.org)
Materials Availability
This study did not generate new unique reagents.
EXPERIMENTAL MODEL AND SUBJECT DETAILS
Mice
Mouse care and experimental procedures were performed under pathogen-free conditions in accordance with established institutional guidance and approved protocols from Institutional Animal Care and Use Committee at Beckman Research Institute of City of Hope Medical Center. Stat3loxp/loxp (Stat3+/+) mice were kindly provided by Drs. Shizuo Akira and Kiyoshi Takeda (Osaka University, Japan) (Takeda et al., 1998) and crossed with CD4-Cre mice (Taconic) to generate CD4-Cre/Stat3loxp/loxp mice with Stat3 deletion in T cells (Stat3−/−) as previously described (Kujawski et al., 2010; Priceman et al., 2014). MMTV-PyMT (PyMT)/B6 mice were kindly provided by Dr. Lesley G.Ellies (University of California, San Diego) (Davie et al., 2007) PyMT mice were bred with Stat3+/+ and Stat3−/− mice to generate PyMT/Stat3+/+ and PyMT/Stat3−/− mice. PyMT ChOVA transgenic C57BL/6 mice were kindly provided by Dr. Matthew F. Krummel (University of California, San Francisco) (Boldajipour et al., 2016), and offspring were screened for the PyMT ChOVA gene by PCR. C57BL/6, Rag1−/− and db/db mice were obtained from Jackson Laboratory. PD-1−/− CD8+ T cell were enriched from spleens of PD-1−/− C57BL/6 mice developed by Dr. Tasuku Honj`s lab (Kyoto University) and provided by Dr. Defu Zeng`s lab (City of Hope Medical Center). Mouse care and experimental procedures were performed in accordance with established institutional guidance and approved protocols from Institutional Animal Care and Use Committee at the Beckman Research Institute of City of Hope National Medical Center. For some studies, mice were fed either a Low Fat Diet (LFD, normal diet) or a High-Fat Diet (HFD, 60 kcal% fat; Research Diets D12492) generally from 8-10 weeks of age, for up to 130, 155 days as indicated. Body weight was measured weekly and food intake was monitored on both diets. All mice were housed in the Animal Resource Center (ARC) of Beckman Research Institute/City of Hope, under care by veterinarians. The ARC staff provided feeding & watering for animals; cleaning and/or changing animal cages; observing & reporting illness or death; maintaining facility at room temperature. The ARC staff performed breeding of mice to generate some knockout mice used in the experiments. Light cycle for the duration of the study was set to 12-h light/12-h darkness. The temperature and relative humidity levels were at 20-25°C and 40%-60%, respectively. Female mice were used in all of the in vivo experiments.
Cell culture
Py8119 cells were derived from tumors in PyMT transgenic C57BL/6 female mice and kindly provided by Dr. Lesley Ellies of University of San Diego and maintained in F12K nutrient medium with 5% fetal bovine serum (FBS), 50 μg/ml gentamycin, 2.5 μg/ml fungizone and MITO (Fisher). Tumor supernatant (TSN) was obtained by culturing Py8119 cells (~80% confluence) overnight with serum-free RPMI 1640 medium. For CD8+ T cell culture, spleens were gently dissociated under 70 μm mesh followed by blood cell lysis (Sigma-Aldrich), single-cell suspensions were then enriched by magnetic beads enrichment using CD8+ T cell negative selection EasySep kits (StemCell Technologies), and cultured in RPMI 1640 media containing 10% FBS supplemented with anti-CD3ɛ (1 μg/ml), anti-CD28 antibody (1 μg/ml) and IL-2 (20 ng/ml) in the presence of 10% TSN for 12-15 days as indicated. For some experiments, etomoxir (50 or 100 μM) was added after 5 days of activation for 8 days. All cells were cultured in a humidified incubator at 37°C and 5% CO2.
Patient samples
Breast tumor/lymph node tissues archived at City of Hope Medical Center were obtained with informed consent, and the analyses performed were approved by City of Hope Institutional Review Board (COH IRB11142). Briefly, tumor biopsies (from lean and obese patients) were selected. Paraffin-embedded tissue from primary tumors were obtained and prepared at 4 um sections on unstained slides for subsequent analyses. Average ages and BMIs of the obese patients (7) whose lymph nodes were analyzed were 58 and 37.6, respectively. We analyzed lymph nodes from lean patients (7) with average age 53 and BMI 22.4, respectively. Average ages and BMIs of the obese patients (4) whose tumor tissues were analyzed for CD8+/CPT1B and CD8+/Granzyme B were 57.3 and 38.9, respectively. Tumor tissues from lean patients (4) with average age 49.8 and BMI 22, respectively, were used to study CD8+/CPT1B and CD8+/Granzyme B. For p-STAT3/CD8+ T cell study, tumor tissues were from obese patients (5) with average age 54.8 and BMI 39.7; tumor tissues used from lean patients (5) were 51.2 years old on average with an average BMI of 22.7.
METHOD DETAILS
In vivo and ex vivo studies
PyMT mice were euthanized on day 155 or otherwise as indicated, followed by harvesting tumors, tumor-draining lymph nodes (TDLNs) and spleens for further analysis as indicated. For some experiments, mice were treated with PBS (vehicle), Luc (CTLA4 (apt)-luciferase siRNA) or CTLA4 (apt)-Stat3 siRNA (782.5 pmol/dose/mouse), or perhexiline (5 mg/kg) or anti-leptin antibody (250 μg/kg) from day 120 when tumors are not palpable once every two days for three weeks. For Py8119 tumor cell bearing mouse model, 5 × 10⁵ Py8119 breast cancer cells were injected into C57BL/6 mice mammary fat pad. Mice were treated with PBS (vehicle), Luc (CTLA4 (apt)-luciferase siRNA) or CTLA4 (apt)-CPT1B siRNA (2 nmol/dose/mouse) when tumors are palpable once every other days for 2 weeks. For adoptive transfer experiment, Rag1−/− mice were fed with HFD for 8-12 weeks, then 107 sorted CD8+ T cells from C57BL/6, Stat3−/−CD4Cre or db/db (leptin-receptor deficient) mice were adoptively transfer into Rag1−/− obese mice, followed by establishing PyMT tumors with Py8119 breast tumor cells mammary fat pad injection.
For some ex vivo assays, to increase the number of tumor-infiltrating CD8 T cells, tumor mixtures prepared from two to three mice were pooled before sorting by flow cytometry.
Immunostaining
Formalin-fixed paraffin-embedded sections were deparaffinized, followed by antigen (Ag) retrieval with Citrate Ag retrieval solution (Vector Labs) and stained with Rabbit antibody against mouse cleaved caspase-3 (Cell Signaling), followed by incubation with biotinylated anti-rabbit antibody and then developed with DAB substrate and counter-stained with Hematoxilin (Vector Labs). For immunoflourensence, sections were deparaffinized, followed by Ag retrieval with Citrate or high pH Ag retrieval solution (Vector Labs) and stained with mouse anti-human granzyme B (1:100, Santa Cruz) or mouse anti-human CD8 (1:50, Abcam) or biotinylated anti-mouse CD8 (1:100, Biolegend), with Rabbit anti-human CD8 (1:100, Abcam) or Rabbit anti-human/mouse CPT1B (1:100, Abcam), followed by incubation with Alexa 488-labeled goat anti-rabbit IgG, Alexa 546-labeled goat anti-mouse (or rabbit) IgG or Strepavidin-Alexa 488 with Hoechest 33342. For human p-STAT3 staining, sections were stained with Rabbit anti-human p-STAT3 (1:50, Cell signaling), Mach 2 -Rabbit HRP polymer (Biocare) was used as secondary antibody. Opal amplification was performed using Opal 520 fluorophore (PerkinElmer). Quantification was performed by acquiring images of three or five random fields per sample under magnifications with Nikon Eclipse TE2000-U microscope and ZEISS LSM 880 microscopy followed by analysis with Image-Pro Plus (Media Cybernetics) and ZEN 2.3 lite software.
Intracellular Staining and Flow Cytometry
To prepare single-cell suspensions for flow cytometry, tumor tissue was dissected into approximately 1–5 mm3 fragments and digested with collagenase Type D (2 mg/ml; Roche) and DNase I (1 mg/ml; Roche) for 30–45 min at 37°C. Digests were filtered through 70 μm cell strainers, centrifuged at 1,500 rpm for 5 min. Single-cell suspensions from spleens and lymph nodes were prepared as mentioned above. After red blood cell lysis (Sigma-Aldrich), single-cell suspensions were filtered, washed, and resuspended in FACS Wash Buffer (2%FBS in Hank’s balanced salt solution without Ca, Mg, and phenol red). Single-cell suspensions (some of which were pooled from tumors harvested from two mice) were stimulated for 4 h with PMA (5 ng/ml, Sigma) and ionomycin (500 ng/ml, Sigma) in the presence of protein transport inhibitor (monensin 1000x, Biolegend). Cells were blocked with CD16/CD32 and incubated for 30 min on ice with FITC-, PE-, APC-, PECy7-, Alexa Fluor-700, Pacific Blue (or v450), and APC-Cy7 (or Alexa Fluor-e780)-conjugated antibodies (1:100, CD3, CD8, CD107a, IFNγ, and granzyme B,) purchased from Biolegend, eBioscience, or BD Bioscience. Aqua LIVE/DEAD used for cell viability was purchased from Invitrogen. For H-2Kb-SIINFEKL Tetramer staining (Zhang et al., 2015), cells were incubated at 4°C for 1 h. Alexa 4 88- labeled H-2Kb-SIINFEKL Tetramer was kindly provided by the NIH Tetramer Core at Emory University (Atlanta, GA, USA). Cells were washed twice before analysis on the BD LSR Fortessa flow cytometer (Beckman Coulter Genomics).
Real-time quantitative PCR
Total RNA was extracted using RNAqueous Micro kit column purification (Ambion). cDNA was produced from RNA using cDNA synthesis kit (Bio-Rad). Quantitative RT-PCR was performed using SYBR Green Supermix (Bio-Rad) and quantified using Chromo4 real-time detector (Bio-Rad). RT-PCR primers were purchased from RealTimePrimers.com. Each primer set was validated using a standard curve across the dynamic range of interest with a single melting peak.
Chromatin Immunoprecipitation (ChIP)
Chromatin immunoprecipitation (ChIP) was performed as previously described (Herrmann et al., 2014b). Briefly, splenic CD8+ T cells were isolated from C57BL/6 mice or PymT tumor-bearing mice with/without Stat3. The CD8+ T cells from C57BL/6 mice were stimulated with PBS or IL-6 (20 ng/mL) for 30 mins. The cells were fixed with 1% formaldehyde at 37°C for 10 mins and lysed in ChIP lysis buffer. The lysates were sonicated to shear DNA, and the sonicated chromatin solutions were incubated with 4 μg of p-Stat3 or control rabbit IgG antibodies. After immunoprecipitation and reversed crosslinking, DNAs were extracted and analyzed by qPCR and PCR using primer sets for mouse Cpt1a, Cpt1b, and Cpt1c: Cpt1a fwd: 5’-GCGTTTGGGTGTGTCAGAAC-3’, Cpt1a rev: 5’-AAGGAAGAGTCGCAGCTCTG-3’, Cpt1b fwd: 5’-CCAAGGTGGGCATCTGAGAG-3’, Cpt1b rev: 5’-TCAATGAGCGGAATGGACCC-3’, Cpt1c fwd: 5’-AGAGTAAGGGCGAGACCAGT-3’, Cpt1c rev: 5’-GGAGGGCTCTTGCTTGGAAT-3’.
In vitro T cell proliferation assay
Stat3+/+ and Stat3−/− CD8+ T cells were enriched from spleens of Py8119 tumor bearing mice, followed by activation with anti-CD3ε, anti-CD28 antibody and IL-2 plus 10% TSN mentioned above for two days. Cells were then plated on a 96-well plate in triplicate at 1×10⁵ cells per well for 24 h. Cell proliferation was assessed by using CellTiter 96-Aqueous One Solution Reagent (Promega, Madison, WI). Absorbance was measured at 490 nm using an Infinite M1000 Pro plate reader (Tecan, Switzerland). Background values were first subtracted from each well before proceeding with determination of percent of cell growth fold change.
Fatty Acid Oxidation Assay and ECAR
For the oxidation assay, tumor-infiltrating CD8+ T cells were resuspended in 3H-labeled palmitic acid, L-carnitine, and fatty-acid free BSA and divided into wells of a 24-well plate. Cells were pulsed for 2 hours with radioactive mix. The supernatant was collected and precipitated with trichloroacetic acid. Supernatant was neutralized with NAOH then passed through an ion exchange column loaded with Dowex 1X2 chloride form resin (Sigma Aldrich). The radioactive product was eluted with water. Flow-through was collected and radiation was quantified using liquid scintillation counting. Radiation count was normalized to cell number. The rate of β-oxidation was calculated and expressed as CPM per 1 × 10⁶ cells. ECAR were measured at 37°C using an XF24 extracellular analyzer (Seahorse Bioscience). Briefly, 106 cultured CD8+ T cells were initially plated on poly-L-Lysine coated XF24 well plate in unbuffered DMEM (DMEM with 25 mM glucose as indicated, 1 mM sodium pyruvate, 32 mM NaCl, 2 mM GlutaMax, pH 7.4) and incubated in a non-CO2 incubator for 30 minutes at 37°C. ECAR was calculated using Seahorse XF-24 proprietary software.
Western blotting
CD8+ T cells were negatively enriched as mentioned above. Cells were lysed in 1% Nonidet P-40 lysis buffer containing protease inhibitor cocktail (Sigma-Aldrich) and 1mMsodium orthovanadate (Sigma-Aldrich). Protein lysates (20 μg) were subjected to SDS-PAGE, probed with indicated antibodies, and detected using an enhanced chemiluminescence substrate (Pierce). Monoclonal β-actin antibody (1:10000) was purchased from Sigma-Aldrich. Polyclonal antibody against p-STAT3 (Y705) (1:1000) was from Cell Signaling. Stattic was purchased from EMD Chemicals and recombinant mouse Leptin and PD-L1 were purchased from R&D Systems.
QUANTIFICATION AND STATISTICAL ANALYSIS
Statistical Analysis
We did not use statistical method to predetermine sample size. No special method such as blinding was used for the experiments. Statistical analyses were performed using GraphPad Prism 7 software. Statistical comparisons between groups were performed using the unpaired Student’s t test to calculate two-tailed p-value. Statistical significance values were set as *p<0.05. **p<0.01. ***p<0.001. A p-value less than 0.05 would be considered statistically significant, ns = not significant. Data are presented as mean ± standard error of the mean (SEM). P-value and n can be found in main and supplementary figure legends.
DATA AND CODE AVAILABILITY
This study did not generate unique code or datasets.
Supplementary Material
KEY RESOURCES TABLE
| REAGENT or RESOURCE | SOURCE | IDENTIFIER |
|---|---|---|
| Antibodies | ||
| Alexa Fluor 700 Rat anti- mouse CD3 (clone 17A2) | Biolegend | Cat# 100216; RRID: AB_493697 |
| APC Rat anti-mouse CD8α ( clone 53-6.7) | Biolegend | Cat#100712; RRID: AB_312751 |
| FITC Mouse anti-human/mouse Granzyme B (clone GB11) | Biolegend | Cat# 515403; RRID: AB_2114575 |
| APC/Cy7 Rat anti-mouse CD45 (clone 30-F11) | Biolegend | Cat# 103116; RRID: AB_312981 |
| FITC Rat anti-mouse CD45 (clone 30-F11) | Biolegend | Cat# 103108; RRID: AB_312973 |
| APC Rat anti-mouse CD274 (PD-L1) (clone 10F.9G2) | Biolegend | Cat# 124312; RRID: AB_10612741 |
| APC Rat IgG2b, k isotype ctrl (clone RTK4530) | Biolegend | Cat# 400612; RRID: RRID:AB_326556 |
| APC Mouse anti-human CD3 (clone UCHT1) | Biolegend | Cat# 300458; RRID: RRID: AB_2564151 |
| Pacific Blue Mouse anti-human CD8 (SK1) | Biolegend | Cat# 344718; RRID: AB_10551438 |
| Purified anti-mouse CD3ε (clone 145-2C11) | Biolegend | Cat# 100314; RRID: AB_312679 |
| Purified anti-mouse CD28 (clone 37.51) | Biolegend | Cat# 102116; RRID: AB_11147170 |
| Biotin Rat anti-mouse CD8a ( clone 53-6.7) | Biolegend | Cat# 100704; RRID: AB_312743 |
| BD Phosflow™ Alexa Fluor® 647 Mouse Anti-Stat3 (pY705) | BD Biosciences | Cat# 562071; RRID: AB_10893358 |
| BD Phosflow™ Alexa Fluor® 647 Mouse IgG2a, κ Isotype Control | BD Biosciences | Cat# 558053; RRID: AB_1645617 |
| V450 Rat anti-mouse CD107α(clone 1D4B) | BD Biosciences | Cat# 560648; RRID: AB_1727420 |
| FITC Rat anti-mouse IFN-γ (clone XMG1.2) | BD Biosciences | Cat# 562019; RRID: AB_10893998 |
| PE-Cyanine7 Rat anti-mouse IFN-γ (clone XMG1.2) | BD Biosciences | Cat# 557649; RRID: AB_396766 |
| PE Rat anti-mouse IFN-γ (clone XMG1.2) | BD Biosciences | Cat# 562020; RRID: AB_10894592 |
| PE-Cyanine7 Rat-anti mouse CD8α (clone 53-6.7) | eBioscience | Cat# 25-0081-82; RRID: AB_469584 |
| Rabbit polyclonal anti-CPT1B | GeneTx | Cat# GTX117231 RRID: AB_10722705 |
| Rabbit anti-Human/Mouse Cleaved caspase-3 Alexa Fluor 488 ( clone # 269518) | R&D Systems | Cat# IC835G-025 |
| Rabbit IgG Alexa Fluor 488 (clone # 60024B) | R&D Systems | Cat# IC1051G |
| Granzyme B antibody (clone 2C5) | Santa Cruz Biotech | Cat# sc-08022 RRID: AB_2232723 |
| CD8-α Antibody (clone C8/144B) | Santa Cruz Biotech | Cat# sc-53212 RRID: AB_1120718 |
| Rabbit polyclonal anti-STAT3 | Santa Cruz Biotech | Cat# sc-482; RRID: AB_632440 |
| Normal rabbit IgG | Santa Cruz Biotech | Cat# sc-2027; RRID: AB_737197 |
| Rabbit polyclonal anti-pY705-STAT3 | Cell Signaling Technology | Cat#9145S; RRID: AB_2491009 |
| Rabbit monoclonal anti-Cleaved Caspase-3 (clone 5A1E) | Cell Signaling Technology | Cat# 9664; RRID: AB_2070042 |
| Mouse monoclonal anti-GAPDH antibody (clone 1E6D9) | Proteintech | Cat# 60004-1-Ig; RRID: AB_2107436 |
| Rabbit polyclonal Hexokinase 2 antibody | Proteintech | Cat# 22029-1-AP; RRID: AB_11182717 |
| Mach 2 Rabbit HRP-Polymer | Biocare | Cat# RHRP520 |
| Mouse monoclonal anti-β actin (clone AC-74) | Sigma | Cat# A2228; RRID: AB_476697 |
| Leptin neutralizing antibody: Polyclonal Goat anti-mouse Leptin antibody | R&D Systems, Inc. | Cat# AF498; RRID: AB_355394 |
| Alexa Fluor 555 Goat anti-Mouse IgG (H+L) Highly Cross-Adsorbed Secondary Antibody | Thermo Fisher | Cat# A-21424 RRID: AB_141780 |
| Alexa Fluor 555 Goat anti-Rabbit IgG (H+L) Highly Cross-Adsorbed Secondary Antibody | Thermo Fisher | Cat# A-11034 RRID: AB_2576217 |
| Bacterial and Virus Strains | ||
| N/A | ||
| Biological Samples | ||
| Breast cancer patient specimens | City of Hope National Cancer Center | N/A |
| Chemicals, Peptides, and Recombinant Proteins | ||
| Recombinant mouse PD-L1 | R&D Systems, Inc. | Cat# 1019-B7 |
| Recombinant mouse Leptin | R&D Systems, Inc | Cat# 498-OB |
| Recombinant mouse IL-2 | BD Pharmingen | Cat# 402-ML |
| [3H]-palmitic acid | PerkinElmer Inc | Cat# NET043001MC |
| Sodium palmitate | Sigma-Aldrich | Cat# P9767 |
| Bovine Serum Albumin, fatty acid free | Sigma-Aldrich | Cat# A8806 |
| Etomoxir | Sigma-Aldrich | Cat# 236020 |
| Perhexiline | Sigma-Aldrich | Cat# SML0120 |
| Dowex 1X2 chloride form | Sigma-Aldrich | Cat#217395 |
| Phorbol 12-myristate 13-acetate (PMA) | Sigma-Aldrich | Cat# P8139 |
| Ionomycin calcium salt | Sigma-Aldrich | Cat# 13909 |
| Alexa 488 H-2Kb-SIINFEKL Tetramer | NIH Tetramer Core | N/A |
| Opal 520 | PerkinElmer | Cat# FP1487001KT |
| Critical Commercial Assays | ||
| LIVE/DEAD fixable aqua dead cell stain kit | Thermo Fisher | Cat#L34957 |
| Mouse CD8 T cell isolation kit | STEMCELL | Cat# 19853 |
| Fixation/Permeabilization Solution Kit | BD Bioscience | Cat# 554715 |
| RNeasy Mini Kit | Qiagen | Cat#74106 |
| RNAqueous-Micro Kit | Thermo Fisher | Cat# AM1931 |
| iScript cDNA Synthesis Kit | Bio-Rad | Cat# 1708890 |
| iQ SYBR Green Supermix | Bio-Rad | Cat# 1708800 |
| CellTiter 96-Aqueous One Solution Cell proliferation Assay | Promega | Cat# G3580 |
| Seahorse XF Glycolysis Stress Test Kit | Aglient | Cat# 103020-100 |
| Precision Count Beads | Biolegend | Cat# 424902 |
| Deposited Data | ||
| N/A | ||
| Experimental Models: Cell Lines | ||
| Py 8119 | ATCC | CRL3278; RRID:CVCL_AQ09 |
| Experimental Models: Organisms/Strains | ||
| MMTV-PyMT/B6 | (Davie et al., 2007) | N/A |
| PyMT ChOVA mice | (Boldajipour et al., 2016) | N/A |
| Stat3loxp/loxp (Stat3+/+) mice | (Takeda et al., 1998) | N/A |
| CD4-Cre/Stat3loxp/loxp mice | (Priceman et al., 2013) | N/A |
| PyMT/Stat3−/− mice | This paper | N/A |
| C57BL/6J mice | The Jackson Laboratory | Strain: 000664 |
| db/db mice | The Jackson Laboratory | Strain: 000642 |
| Rag1−/− mice | City of Hope Medical Center Animal Core | N/A |
| Oligonucleotides | ||
| Primer: mouse CPT1B | SABiosciences | Cat# PPM57688A-200 |
| Primer: mouse HK2 | SABiosciences | Cat# PPM03503E-200 |
| Primer: mouse GAPDH | SABiosciences | Cat#PPM02946E-200 |
| Primer: mouse Actin | SABiosciences | Cat#PPM02945A-200 |
| Primer: Bcl2 | SABiosciences | Cat#PPM20918F-200 |
| Primer: PDK1 | SABiosciences | Cat#PPM28207E-200 |
| Recombinant DNA | ||
| N/A | ||
| Software and Algorithms | ||
| Graphpad Prism 7 software | GraphPad Software, Inc | https://www.graphpad.com/scientific-software/prism/ |
| FlowJo software V10 | FlowJo, LLC | https://www.flowjo.com/ |
| ZEN microscopy software | ZEISS | https://www.zeiss.com/microscopy/int/service-support/microscopy-contact.html |
Highlights.
STAT3 in CD8+ T effector cells upregulates FAO while inhibiting glycolysis and IFNγ
PD-1 increases FAO and inhibits IFNγ through activating STAT3 in tumor CD8+ T cells
Leptin associated with increased fat tissues activates STAT3 in CD8+ T effector cells
Blocking leptin-STAT3-FAO pathway reactivates breast tumor CD8+ T cells
Contexts and Significance.
Researchers at the City of Hope Comprehensive Cancer Center and their collaborators have investigated the impact of obesity on immune function, finding that the metabolism of immune cells is altered and affects their capacity to suppress breast cancer. They report that increased metabolism of fatty acids by a set of immune cells, CD8+ T effector cells, compromises their antitumor function. The increased fatty acid oxidation is driven in part by the hormone leptin, which is produced by fat tissue and activates a transcription factor known as STAT3 in T effector cells. In addition, the immune checkpoint protein, PD-1, also promotes fatty acid oxidation through STAT3, further inhibiting T cell antitumor immunity. Their work provides a mechanistic link between obesity and breast cancer through leptin and increased oxidation of fatty acids in T effector cells. These findings may lead to novel therapeutics to reactivate T cells to facilitate their control of obesity-associated breast cancer progression.
ACKNOWLEDGEMENTS
We thank staff members of the Analytical Cytometry Core, supported by the National Cancer Institute of the National Institutes of Health under grant number P30CA033572. Light Microscopy Imaging Core and Animal Facility Core in the Beckman Research Institute at City of Hope Comprehensive Cancer Center for their excellent technical assistance. We also acknowledge Dr. Matthew F. Krummel (UCSF) for providing PyMTChOVA transgenic mice. Research reported in this publication was supported by the National Cancer Institute of the National Institutes of Health under grant numbers R01CA122976, R01CA139158, P50CA107399 and P30CA033572. The content is solely the responsibility of the authors and does not necessarily represent the official views of the National Institutes of Health. This study was also supported by the Billy and Audrey Wilder Endowment to HY, the Tim Nesviq Fund at City of Hope Comprehensive Cancer Center and the HEADstrong Foundation in memory of Nicholas E. Colleluori.
Footnotes
Declaration of Interests
There are no competing interests.
Publisher's Disclaimer: This is a PDF file of an unedited manuscript that has been accepted for publication. As a service to our customers we are providing this early version of the manuscript. The manuscript will undergo copyediting, typesetting, and review of the resulting proof before it is published in its final form. Please note that during the production process errors may be discovered which could affect the content, and all legal disclaimers that apply to the journal pertain.
REFERENCES
- Ando S, Barone I, Giordano C, Bonofiglio D, and Catalano S (2014). The Multifaceted Mechanism of Leptin Signaling within Tumor Microenvironment in Driving Breast Cancer Growth and Progression. Front Oncol 4, 340. [DOI] [PMC free article] [PubMed] [Google Scholar]
- Assiri AM, Kamel HF, and Hassanien MF (2015). Resistin, visfatin, adiponectin, and leptin: risk of breast cancer in pre- and postmenopausal saudi females and their possible diagnostic and predictive implications as novel biomarkers. Dis Markers 2015, 253519. [DOI] [PMC free article] [PubMed] [Google Scholar]
- Battle M, Gillespie C, Quarshie A, Lanier V, Harmon T, Wilson K, Torroella-Kouri M, and Gonzalez-Perez RR (2014). Obesity induced a leptin-Notch signaling axis in breast cancer. Int J Cancer 134, 1605–1616. [DOI] [PMC free article] [PubMed] [Google Scholar]
- Boldajipour B, Nelson A, and Krummel MF (2016). Tumor-infiltrating lymphocytes are dynamically desensitized to antigen but are maintained by homeostatic cytokine. JCI Insight 1, e89289. [DOI] [PMC free article] [PubMed] [Google Scholar]
- Calle EE, Rodriguez C, Walker-Thurmond K, and Thun MJ (2003). Overweight, obesity, and mortality from cancer in a prospectively studied cohort of U.S. adults. N Engl J Med 348, 1625–1638. [DOI] [PubMed] [Google Scholar]
- Calle EE, and Thun MJ (2004). Obesity and cancer. Oncogene 23, 6365–6378. [DOI] [PubMed] [Google Scholar]
- Camarda R, Zhou AY, Kohnz RA, Balakrishnan S, Mahieu C, Anderton B, Eyob H, Kajimura S, Tward A, Krings G, et al. (2016). Inhibition of fatty acid oxidation as a therapy for MYC-overexpressing triple-negative breast cancer. Nature medicine 22, 427–432. [DOI] [PMC free article] [PubMed] [Google Scholar]
- Cham CM, Driessens G, O'Keefe JP, and Gajewski TF (2008). Glucose deprivation inhibits multiple key gene expression events and effector functions in CD8+ T cells. Eur J Immunol 38, 2438–2450. [DOI] [PMC free article] [PubMed] [Google Scholar]
- Chang CH, Curtis JD, Maggi LB Jr., Faubert B, Villarino AV, O'Sullivan D, Huang SC, van der Windt GJ, Blagih J, Qiu J, et al. (2013). Posttranscriptional control of T cell effector function by aerobic glycolysis. Cell 153, 1239–1251. [DOI] [PMC free article] [PubMed] [Google Scholar]
- Chang CH, Qiu J, O'Sullivan D, Buck MD, Noguchi T, Curtis JD, Chen Q, Gindin M, Gubin MM, van der Windt GJ, et al. (2015). Metabolic Competition in the Tumor Microenvironment Is a Driver of Cancer Progression. Cell 162, 1229–1241. [DOI] [PMC free article] [PubMed] [Google Scholar]
- Chowdhury PS, Chamoto K, Kumar A, and Honjo T (2018). PPAR-Induced Fatty Acid Oxidation in T Cells Increases the Number of Tumor-Reactive CD8(+) T Cells and Facilitates Anti-PD-1 Therapy. Cancer Immunol Res 6, 1375–1387. [DOI] [PubMed] [Google Scholar]
- Cui W, Liu Y, Weinstein JS, Craft J, and Kaech SM (2011). An interleukin-21-interleukin-10-STAT3 pathway is critical for functional maturation of memory CD8+ T cells. Immunity 35, 792–805. [DOI] [PMC free article] [PubMed] [Google Scholar]
- D'Esposito V, Liguoro D, Ambrosio MR, Collina F, Cantile M, Spinelli R, Raciti GA, Miele C, Valentino R, Campiglia P, et al. (2016). Adipose microenvironment promotes triple negative breast cancer cell invasiveness and dissemination by producing CCL5. Oncotarget 7, 24495–24509. [DOI] [PMC free article] [PubMed] [Google Scholar]
- Davie SA, Maglione JE, Manner CK, Young D, Cardiff RD, MacLeod CL, and Ellies LG (2007). Effects of FVB/NJ and C57Bl/6J strain backgrounds on mammary tumor phenotype in inducible nitric oxide synthase deficient mice. Transgenic Res 16, 193–201. [DOI] [PMC free article] [PubMed] [Google Scholar]
- Font-Burgada J, Sun B, and Karin M (2016). Obesity and Cancer: The Oil that Feeds the Flame. Cell Metab 23, 48–62. [DOI] [PubMed] [Google Scholar]
- Francisco LM, Sage PT, and Sharpe AH (2010). The PD-1 pathway in tolerance and autoimmunity. Immunol Rev 236, 219–242. [DOI] [PMC free article] [PubMed] [Google Scholar]
- Gattinoni L, Lugli E, Ji Y, Pos Z, Paulos CM, Quigley MF, Almeida JR, Gostick E, Yu Z, Carpenito C, et al. (2011). A human memory T cell subset with stem cell-like properties. Nature Medicine 17, 1290–1297. [DOI] [PMC free article] [PubMed] [Google Scholar]
- Gemta LF, Siska PJ, Nelson ME, Gao X, Liu X, Locasale JW, Yagita H, Slingluff CL Jr., Hoehn KL, Rathmell JC, and Bullock TNJ (2019). Impaired enolase 1 glycolytic activity restrains effector functions of tumor-infiltrating CD8(+) T cells. Sci Immunol 4. [DOI] [PMC free article] [PubMed] [Google Scholar]
- Gilbert CA, and Slingerland JM (2013). Cytokines, obesity, and cancer: new insights on mechanisms linking obesity to cancer risk and progression. Annu Rev Med 64, 45–57. [DOI] [PubMed] [Google Scholar]
- Herrmann A, Cherryholmes G, Schroeder A, Phallen J, Alizadeh D, Xin H, Wang T, Lee H, Lahtz C, Swiderski P, et al. (2014a). TLR9 is critical for glioma stem cell maintenance and targeting. Cancer Res 74, 5218–5228. [DOI] [PMC free article] [PubMed] [Google Scholar]
- Herrmann A, Kortylewski M, Kujawski M, Zhang C, Reckamp K, Armstrong B, Wang L, Kowolik C, Deng J, Figlin R, and Yu H (2010). Targeting Stat3 in the myeloid compartment drastically improves the in vivo antitumor functions of adoptively transferred T cells. Cancer Res 70, 7455–7464. [DOI] [PMC free article] [PubMed] [Google Scholar]
- Herrmann A, Priceman SJ, Swiderski P, Kujawski M, Xin H, Cherryholmes GA, Zhang W, Zhang C, Lahtz C, Kowolik C, et al. (2014b). CTLA4 aptamer delivers STAT3 siRNA to tumor-associated and malignant T cells. J Clin Invest 124, 2977–2987. [DOI] [PMC free article] [PubMed] [Google Scholar]
- Herrmann A, Priceman SJ, Swiderski P, Kujawski M, Xin H, Cherryholmes GA, Zhang W, Zhang C, Lahtz C, Kowolik C, et al. (2015). CTLA4 aptamer delivers STAT3 siRNA to tumor-associated and malignant T cells. J Clin Invest 125, 2547. [DOI] [PMC free article] [PubMed] [Google Scholar]
- Ho PC, Bihuniak JD, Macintyre AN, Staron M, Liu X, Amezquita R, Tsui YC, Cui G, Micevic G, Perales JC, et al. (2015). Phosphoenolpyruvate Is a Metabolic Checkpoint of Anti-tumor T Cell Responses. Cell 162, 1217–1228. [DOI] [PMC free article] [PubMed] [Google Scholar]
- Hossain DM, Panda AK, Manna A, Mohanty S, Bhattacharjee P, Bhattacharyya S, Saha T, Chakraborty S, Kar RK, Das T, et al. (2013). FoxP3 acts as a cotranscription factor with STAT3 in tumor-induced regulatory T cells. Immunity 39, 1057–1069. [DOI] [PubMed] [Google Scholar]
- Hu Z, Qu G, Yu X, Jiang H, Teng XL, Ding L, Hu Q, Guo X, Zhou Y, Wang F, et al. (2019). Acylglycerol Kinase Maintains Metabolic State and Immune Responses of CD8(+) T Cells. Cell Metab. [DOI] [PubMed] [Google Scholar]
- Ito K, Carracedo A, Weiss D, Arai F, Ala U, Avigan DE, Schafer ZT, Evans RM, Suda T, Lee CH, and Pandolfi PP (2012). A PML-PPAR-delta pathway for fatty acid oxidation regulates hematopoietic stem cell maintenance. Nature medicine 18, 1350–1358. [DOI] [PMC free article] [PubMed] [Google Scholar]
- Iwata-Kajihara T, Sumimoto H, Kawamura N, Ueda R, Takahashi T, Mizuguchi H, Miyagishi M, Takeda K, and Kawakami Y (2011). Enhanced cancer immunotherapy using STAT3-depleted dendritic cells with high Th1-inducing ability and resistance to cancer cell-derived inhibitory factors. J Immunol 187, 27–36. [DOI] [PubMed] [Google Scholar]
- Iyengar NM, Zhou XK, Gucalp A, Morris PG, Howe LR, Giri DD, Morrow M, Wang H, Pollak M, Jones LW, et al. (2016). Systemic Correlates of White Adipose Tissue Inflammation in Early-Stage Breast Cancer. Clin Cancer Res 22, 2283–2289. [DOI] [PMC free article] [PubMed] [Google Scholar]
- Kortylewski M, Kujawski M, Wang T, Wei S, Zhang S, Pilon-Thomas S, Niu G, Kay H, Mule J, Kerr WG, et al. (2005). Inhibiting Stat3 signaling in the hematopoietic system elicits multicomponent antitumor immunity. Nature medicine 11, 1314–1321. [DOI] [PubMed] [Google Scholar]
- Kortylewski M, Swiderski P, Herrmann A, Wang L, Kowolik C, Kujawski M, Lee H, Scuto A, Liu Y, Yang C, et al. (2009). In vivo delivery of siRNA to immune cells by conjugation to a TLR9 agonist enhances antitumor immune responses. Nat Biotechnol 27, 925–932. [DOI] [PMC free article] [PubMed] [Google Scholar]
- Kujawski M, Zhang C, Herrmann A, Reckamp K, Scuto A, Jensen M, Deng J, Forman S, Figlin R, and Yu H (2010). Targeting STAT3 in adoptively transferred T cells promotes their in vivo expansion and antitumor effects. Cancer Res 70, 9599–9610. [DOI] [PMC free article] [PubMed] [Google Scholar]
- Le Bourgeois T, Strauss L, Aksoylar HI, Daneshmandi S, Seth P, Patsoukis N, and Boussiotis VA (2018). Targeting T Cell Metabolism for Improvement of Cancer Immunotherapy. Front Oncol 8, 237. [DOI] [PMC free article] [PubMed] [Google Scholar]
- Lee H, Deng J, Xin H, Liu Y, Pardoll D, and Yu H (2011). A requirement of STAT3 DNA binding precludes Th-1 immunostimulatory gene expression by NF-kappaB in tumors. Cancer Res 71, 3772–3780. [DOI] [PMC free article] [PubMed] [Google Scholar]
- Lin EY, Jones JG, Li P, Zhu L, Whitney KD, Muller WJ, and Pollard JW (2003). Progression to malignancy in the polyoma middle T oncoprotein mouse breast cancer model provides a reliable model for human diseases. Am J Pathol 163, 2113–2126. [DOI] [PMC free article] [PubMed] [Google Scholar]
- Lochner M, Berod L, and Sparwasser T (2015). Fatty acid metabolism in the regulation of T cell function. Trends Immunol 36, 81–91. [DOI] [PubMed] [Google Scholar]
- Lugli E, Dominguez MH, Gattinoni L, Chattopadhyay PK, Bolton DL, Song K, Klatt NR, Brenchley JM, Vaccari M, Gostick E, et al. (2013). Superior T memory stem cell persistence supports long-lived T cell memory. J Clin Invest 123, 594–599. [DOI] [PMC free article] [PubMed] [Google Scholar]
- Ma X, Bi E, Lu Y, Su P, Huang C, Liu L, Wang Q, Yang M, Kalady MF, Qian J, et al. (2019). Cholesterol Induces CD8(+) T Cell Exhaustion in the Tumor Microenvironment. Cell Metab. [DOI] [PMC free article] [PubMed] [Google Scholar]
- Maciolek JA, Pasternak JA, and Wilson HL (2014). Metabolism of activated T lymphocytes. Curr Opin Immunol 27, 60–74. [DOI] [PubMed] [Google Scholar]
- Matsushita H, Vesely MD, Koboldt DC, Rickert CG, Uppaluri R, Magrini VJ, Arthur CD, White JM, Chen YS, Shea LK, et al. (2012). Cancer exome analysis reveals a T-cell-dependent mechanism of cancer immunoediting. Nature 482, 400–404. [DOI] [PMC free article] [PubMed] [Google Scholar]
- Miyoshi Y, Funahashi T, Tanaka S, Taguchi T, Tamaki Y, Shimomura I, and Noguchi S (2006). High expression of leptin receptor mRNA in breast cancer tissue predicts poor prognosis for patients with high, but not low, serum leptin levels. Int J Cancer 118, 1414–1419. [DOI] [PubMed] [Google Scholar]
- Moreira D, Adamus T, Zhao X, Su YL, Zhang Z, White SV, Swiderski P, Lu X, DePinho RA, Pal SK, and Kortylewski M (2018). STAT3 Inhibition Combined with CpG Immunostimulation Activates Antitumor Immunity to Eradicate Genetically Distinct Castration-Resistant Prostate Cancers. Clin Cancer Res 24, 5948–5962. [DOI] [PMC free article] [PubMed] [Google Scholar]
- Nakagawa H, Umemura A, Taniguchi K, Font-Burgada J, Dhar D, Ogata H, Zhong Z, Valasek MA, Seki E, Hidalgo J, et al. (2014). ER stress cooperates with hypernutrition to trigger TNF-dependent spontaneous HCC development. Cancer Cell 26, 331–343. [DOI] [PMC free article] [PubMed] [Google Scholar]
- O'Sullivan D, van der Windt GJ, Huang SC, Curtis JD, Chang CH, Buck MD, Qiu J, Smith AM, Lam WY, DiPlato LM, et al. (2014). Memory CD8(+) T cells use cell-intrinsic lipolysis to support the metabolic programming necessary for development. Immunity 41, 75–88. [DOI] [PMC free article] [PubMed] [Google Scholar]
- Park EJ, Lee JH, Yu GY, He G, Ali SR, Holzer RG, Osterreicher CH, Takahashi H, and Karin M (2010). Dietary and genetic obesity promote liver inflammation and tumorigenesis by enhancing IL-6 and TNF expression. Cell 140, 197–208. [DOI] [PMC free article] [PubMed] [Google Scholar]
- Patel AV, Feigelson HS, Talbot JT, McCullough ML, Rodriguez C, Patel RC, Thun MJ, and Calle EE (2008). The role of body weight in the relationship between physical activity and endometrial cancer: results from a large cohort of US women. Int J Cancer 123, 1877–1882. [DOI] [PubMed] [Google Scholar]
- Patsoukis N, Bardhan K, Chatterjee P, Sari D, Liu B, Bell LN, Karoly ED, Freeman GJ, Petkova V, Seth P, et al. (2015). PD-1 alters T-cell metabolic reprogramming by inhibiting glycolysis and promoting lipolysis and fatty acid oxidation. Nat Commun 6, 6692. [DOI] [PMC free article] [PubMed] [Google Scholar]
- Pearce EL, Walsh MC, Cejas PJ, Harms GM, Shen H, Wang LS, Jones RG, and Choi Y (2009). Enhancing CD8 T-cell memory by modulating fatty acid metabolism. Nature 460, 103–107. [DOI] [PMC free article] [PubMed] [Google Scholar]
- Priceman SJ, Kujawski M, Shen S, Cherryholmes GA, Lee H, Zhang C, Kruper L, Mortimer J, Jove R, Riggs AD, and Yu H (2013). Regulation of adipose tissue T cell subsets by Stat3 is crucial for diet-induced obesity and insulin resistance. Proc Natl Acad Sci U S A 110, 13079–13084. [DOI] [PMC free article] [PubMed] [Google Scholar]
- Priceman SJ, Shen S, Wang L, Deng J, Yue C, Kujawski M, and Yu H (2014). S1PR1 is crucial for accumulation of regulatory T cells in tumors via STAT3. Cell Rep 6, 992–999. [DOI] [PMC free article] [PubMed] [Google Scholar]
- Priyadharshini B, and Turka LA (2015). T-cell energy metabolism as a controller of cell fate in transplantation. Curr Opin Organ Transplant 20, 21–28. [DOI] [PMC free article] [PubMed] [Google Scholar]
- Procaccini C, De Rosa V, Galgani M, Carbone F, Cassano S, Greco D, Qian K, Auvinen P, Cali G, Stallone G, et al. (2012). Leptin-induced mTOR activation defines a specific molecular and transcriptional signature controlling CD4+ effector T cell responses. J Immunol 189, 2941–2953. [DOI] [PubMed] [Google Scholar]
- Ray JP, Marshall HD, Laidlaw BJ, Staron MM, Kaech SM, and Craft J (2014). Transcription factor STAT3 and type I interferons are corepressive insulators for differentiation of follicular helper and T helper 1 cells. Immunity 40, 367–377. [DOI] [PMC free article] [PubMed] [Google Scholar]
- Sanchez-Margalet V, and Martin-Romero C (2001). Human leptin signaling in human peripheral blood mononuclear cells: activation of the JAK-STAT pathway. Cell Immunol 211, 30–36. [DOI] [PubMed] [Google Scholar]
- Schonberg DL, Miller TE, Wu Q, Flavahan WA, Das NK, Hale JS, Hubert CG, Mack SC, Jarrar AM, Karl RT, et al. (2015). Preferential Iron Trafficking Characterizes Glioblastoma Stem-like Cells. Cancer Cell 28, 441–455. [DOI] [PMC free article] [PubMed] [Google Scholar]
- Schroeder A, Herrmann A, Cherryholmes G, Kowolik C, Buettner R, Pal S, Yu H, Muller-Newen G, and Jove R (2014). Loss of androgen receptor expression promotes a stem-like cell phenotype in prostate cancer through STAT3 signaling. Cancer Res 74, 1227–1237. [DOI] [PMC free article] [PubMed] [Google Scholar]
- Shin T, Yoshimura K, Shin T, Crafton EB, Tsuchiya H, Housseau F, Koseki H, Schulick RD, Chen L, and Pardoll DM (2005). In vivo costimulatory role of B7-DC in tuning T helper cell 1 and cytotoxic T lymphocyte responses. J Exp Med 201, 1531–1541. [DOI] [PMC free article] [PubMed] [Google Scholar]
- Siegel AM, Heimall J, Freeman AF, Hsu AP, Brittain E, Brenchley JM, Douek DC, Fahle GH, Cohen JI, Holland SM, and Milner JD (2011). A critical role for STAT3 transcription factor signaling in the development and maintenance of human T cell memory. Immunity 35, 806–818. [DOI] [PMC free article] [PubMed] [Google Scholar]
- Siska PJ, Beckermann KE, Mason FM, Andrejeva G, Greenplate AR, Sendor AB, Chiang YJ, Corona AL, Gemta LF, Vincent BG, et al. (2017). Mitochondrial dysregulation and glycolytic insufficiency functionally impair CD8 T cells infiltrating human renal cell carcinoma. JCI Insight 2. [DOI] [PMC free article] [PubMed] [Google Scholar]
- Sukumar M, Liu J, Ji Y, Subramanian M, Crompton JG, Yu Z, Roychoudhuri R, Palmer DC, Muranski P, Karoly ED, et al. (2013). Inhibiting glycolytic metabolism enhances CD8+ T cell memory and antitumor function. J Clin Invest 123, 4479–4488. [DOI] [PMC free article] [PubMed] [Google Scholar]
- Surmacz E (2007). Obesity hormone leptin: a new target in breast cancer? Breast Cancer Res 9, 301. [DOI] [PMC free article] [PubMed] [Google Scholar]
- Takeda K, Clausen BE, Kaisho T, Tsujimura T, Terada N, Forster I, and Akira S (1999). Enhanced Th1 activity and development of chronic enterocolitis in mice devoid of Stat3 in macrophages and neutrophils. Immunity 10, 39–49. [DOI] [PubMed] [Google Scholar]
- Takeda K, Kaisho T, Yoshida N, Takeda J, Kishimoto T, and Akira S (1998). Stat3 activation is responsible for IL-6-dependent T cell proliferation through preventing apoptosis: generation and characterization of T cell-specific Stat3-deficient mice. J Immunol 161, 4652–4660. [PubMed] [Google Scholar]
- Topalian SL, Drake CG, and Pardoll DM (2015). Immune checkpoint blockade: a common denominator approach to cancer therapy. Cancer Cell 27, 450–461. [DOI] [PMC free article] [PubMed] [Google Scholar]
- Vaisse C, Halaas JL, Horvath CM, Darnell JE Jr., Stoffel M, and Friedman JM (1996). Leptin activation of Stat3 in the hypothalamus of wild-type and ob/ob mice but not db/db mice. Nat Genet 14, 95–97. [DOI] [PubMed] [Google Scholar]
- van der Windt GJ, Everts B, Chang CH, Curtis JD, Freitas TC, Amiel E, Pearce EJ, and Pearce EL (2012). Mitochondrial respiratory capacity is a critical regulator of CD8+ T cell memory development. Immunity 36, 68–78. [DOI] [PMC free article] [PubMed] [Google Scholar]
- van der Windt GJ, and Pearce EL (2012). Metabolic switching and fuel choice during T-cell differentiation and memory development. Immunol Rev 249, 27–42. [DOI] [PMC free article] [PubMed] [Google Scholar]
- Vesely MD, and Schreiber RD (2013). Cancer immunoediting: antigens, mechanisms, and implications to cancer immunotherapy. Ann N Y Acad Sci 1284, 1–5. [DOI] [PMC free article] [PubMed] [Google Scholar]
- Wang H, Lathia JD, Wu Q, Wang J, Li Z, Heddleston JM, Eyler CE, Elderbroom J, Gallagher J, Schuschu J, et al. (2009a). Targeting interleukin 6 signaling suppresses glioma stem cell survival and tumor growth. Stem Cells 27, 2393–2404. [DOI] [PMC free article] [PubMed] [Google Scholar]
- Wang L, Yi T, Kortylewski M, Pardoll DM, Zeng D, and Yu H (2009b). IL-17 can promote tumor growth through an IL-6-Stat3 signaling pathway. J Exp Med 206, 1457–1464. [DOI] [PMC free article] [PubMed] [Google Scholar]
- Wang MC, O'Rourke EJ, and Ruvkun G (2008). Fat metabolism links germline stem cells and longevity in C. elegans. Science 322, 957–960. [DOI] [PMC free article] [PubMed] [Google Scholar]
- Wang R, Dillon CP, Shi LZ, Milasta S, Carter R, Finkelstein D, McCormick LL, Fitzgerald P, Chi H, Munger J, and Green DR (2011). The transcription factor Myc controls metabolic reprogramming upon T lymphocyte activation. Immunity 35, 871–882. [DOI] [PMC free article] [PubMed] [Google Scholar]
- Wang T, Fahrmann JF, Lee H, Li YJ, Tripathi SC, Yue C, Zhang C, Lifshitz V, Song J, Yuan Y, et al. (2018). JAK/STAT3-Regulated Fatty Acid beta-Oxidation Is Critical for Breast Cancer Stem Cell Self-Renewal and Chemoresistance. Cell Metab 27, 136–150 e135. [DOI] [PMC free article] [PubMed] [Google Scholar]
- Wang T, Niu G, Kortylewski M, Burdelya L, Shain K, Zhang S, Bhattacharya R, Gabrilovich D, Heller R, Coppola D, et al. (2004). Regulation of the innate and adaptive immune responses by Stat-3 signaling in tumor cells. Nature Medicine 10, 48–54. [DOI] [PubMed] [Google Scholar]
- Wang YY, Lehuede C, Laurent V, Dirat B, Dauvillier S, Bochet L, Le Gonidec S, Escourrou G, Valet P, and Muller C (2012). Adipose tissue and breast epithelial cells: a dangerous dynamic duo in breast cancer. Cancer Lett 324, 142–151. [DOI] [PubMed] [Google Scholar]
- Wang Z, Aguilar EG, Luna JI, Dunai C, Khuat LT, Le CT, Mirsoian A, Minnar CM, Stoffel KM, Sturgill IR, et al. (2019). Paradoxical effects of obesity on T cell function during tumor progression and PD-1 checkpoint blockade. Nature Medicine 25, 141–151. [DOI] [PMC free article] [PubMed] [Google Scholar]
- Wei J, Wang F, Kong LY, Xu S, Doucette T, Ferguson SD, Yang Y, McEnery K, Jethwa K, Gjyshi O, et al. (2013). miR-124 inhibits STAT3 signaling to enhance T cell-mediated immune clearance of glioma. Cancer Res 73, 3913–3926. [DOI] [PMC free article] [PubMed] [Google Scholar]
- Wolf MJ, Adili A, Piotrowitz K, Abdullah Z, Boege Y, Stemmer K, Ringelhan M, Simonavicius N, Egger M, Wohlleber D, et al. (2014). Metabolic activation of intrahepatic CD8+ T cells and NKT cells causes nonalcoholic steatohepatitis and liver cancer via cross-talk with hepatocytes. Cancer Cell 26, 549–564. [DOI] [PubMed] [Google Scholar]
- Yu H, Kortylewski M, and Pardoll D (2007). Crosstalk between cancer and immune cells: role of STAT3 in the tumour microenvironment. Nat Rev Immunol 7, 41–51. [DOI] [PubMed] [Google Scholar]
- Yu H, Lee H, Herrmann A, Buettner R, and Jove R (2014). Revisiting STAT3 signalling in cancer: new and unexpected biological functions. Nat Rev Cancer 14, 736–746. [DOI] [PubMed] [Google Scholar]
- Yu H, Pardoll D, and Jove R (2009). STATs in cancer inflammation and immunity: a leading role for STAT3. Nat Rev Cancer 9, 798–809. [DOI] [PMC free article] [PubMed] [Google Scholar]
- Yue C, Shen S, Deng J, Priceman SJ, Li W, Huang A, and Yu H (2015). STAT3 in CD8+ T Cells Inhibits Their Tumor Accumulation by Downregulating CXCR3/CXCL10 Axis. Cancer Immunol Res 3, 864–870. [DOI] [PMC free article] [PubMed] [Google Scholar]
- Zaugg K, Yao Y, Reilly PT, Kannan K, Kiarash R, Mason J, Huang P, Sawyer SK, Fuerth B, Faubert B, et al. (2011). Carnitine palmitoyltransferase 1C promotes cell survival and tumor growth under conditions of metabolic stress. Genes Dev 25, 1041–1051. [DOI] [PMC free article] [PubMed] [Google Scholar]
- Zhang C, Xin H, Zhang W, Yazaki PJ, Zhang Z, Le K, Li W, Lee H, Kwak L, Forman S, et al. (2016). CD5 Binds to Interleukin-6 and Induces a Feed-Forward Loop with the Transcription Factor STAT3 in B Cells to Promote Cancer. Immunity 44, 913–923. [DOI] [PMC free article] [PubMed] [Google Scholar]
- Zhang W, Zhang C, Li W, Deng J, Herrmann A, Priceman SJ, Liang W, Shen S, Pal SK, Hoon DSB, and Yu H (2015). CD8+ T-cell immunosurveillance constrains lymphoid premetastatic myeloid cell accumulation. Eur J Immunol 45, 71–81. [DOI] [PMC free article] [PubMed] [Google Scholar]
- Zhang Y, Kurupati R, Liu L, Zhou XY, Zhang G, Hudaihed A, Filisio F, Giles-Davis W, Xu X, Karakousis GC, et al. (2017). Enhancing CD8(+) T Cell Fatty Acid Catabolism within a Metabolically Challenging Tumor Microenvironment Increases the Efficacy of Melanoma Immunotherapy. Cancer Cell 32, 377–391 e379. [DOI] [PMC free article] [PubMed] [Google Scholar]
Associated Data
This section collects any data citations, data availability statements, or supplementary materials included in this article.
Supplementary Materials
Data Availability Statement
This study did not generate unique code or datasets.