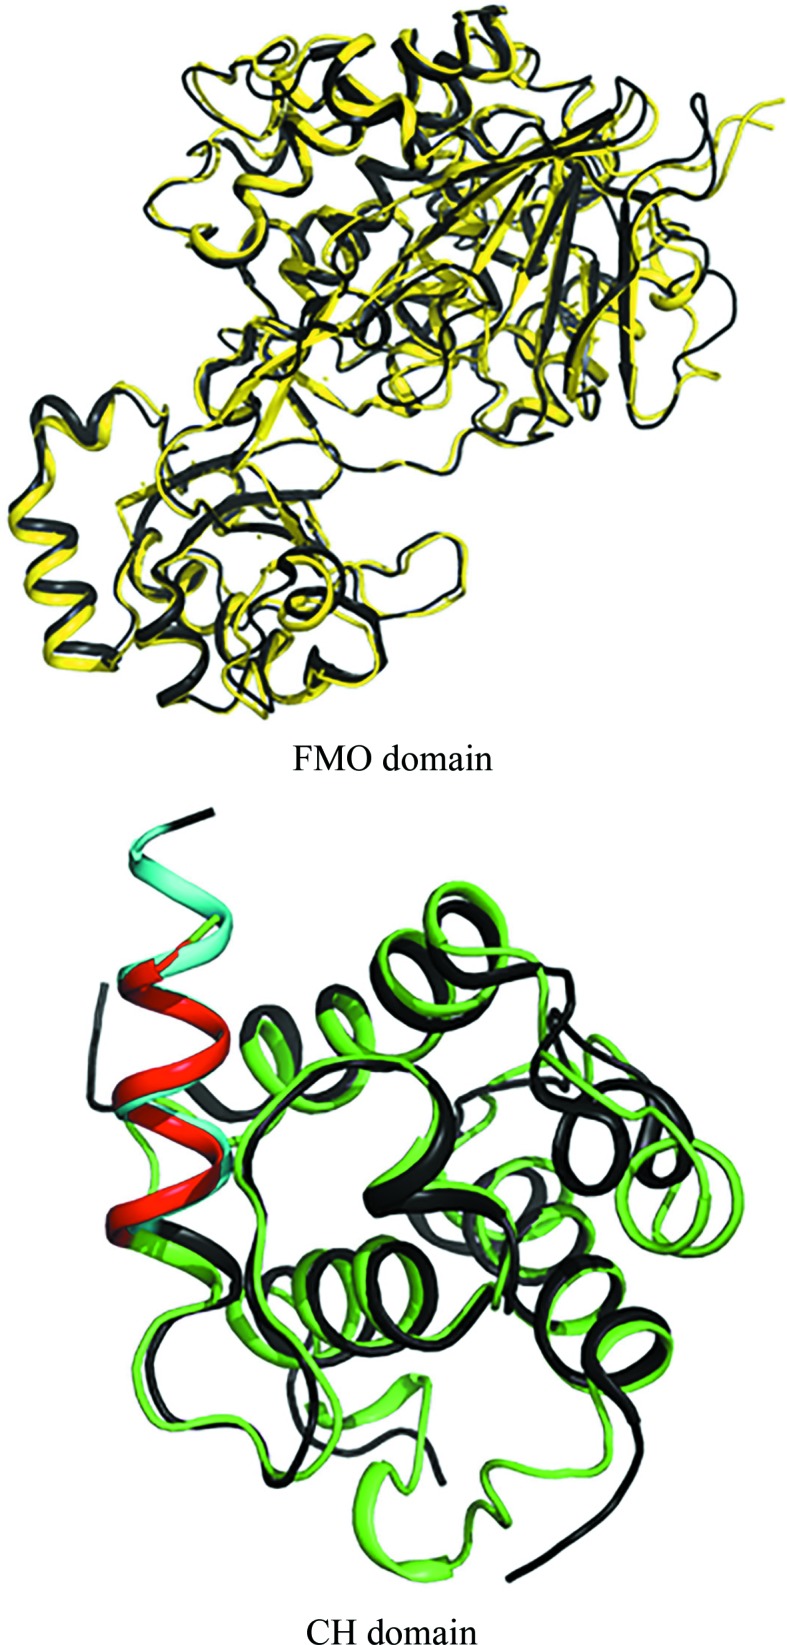
Figure 4.

Superimposition of the FMO and CH domains of human MICAL3 and mouse MICAL1. In the upper panel, the FMO domain of human MICAL3 is shown in yellow and the FMO domain of mouse MICAL1 is shown in black. In the lower panel, the CH domain of human MICAL3 is shown in green and the CH domain of mouse MICAL1 is shown in black. The red helix is the actin-binding helix of human MICAL3 and the cyan helix is the actin-binding helix of mouse MICAL1.
