



Abstract
The aim of this study is to analyze and identify ventilator-associated pneumonia (VAP) risk factors related to pathogens and drug resistance, and explore the theoretical guidance for clinical prevention and treatment strategies of VAP. 478 cases using a ventilator who were hospitalized in July 2014 to November 2016 in our hospital were analyzed in this study. Among them there were 103 patients with VAP. The distribution of pathogenic bacteria and drug resistance in VAP patients was detected and analyzed. 103 patients had VAP (21.5%, 103/478) among 478 cases of patients using a ventilator. Among the 103 patients with VAP, 35 patients died and 43 had simultaneous sepsis. Compared with those of the non-VAP group, the proportion of CD3+ (p = 0.012), CD3+ CD4+ (P = 0.024) and CD8+ CD28+ (P = 0.017) T cells in VAP group increased significantly, which showed a more severe immune response. Multivariate regression model analysis revealed that tracheotomy for mechanical ventilation (P = 0.013), mechanical ventilation time ≥ 7 days (P = 0.02) and aspiration and reflux (P = 0.011) were independent risk factors associated with VAP. Multi-drugs resistance was observed in this study. Modality of mechanical ventilation, mechanical ventilation ≥ 7 days, and aspiration and reflux were independent risk factors associated with VAP. According to the results of bacterial culture and drug sensitivity test, rational selection of antibiotics and monitoring of patients in the ICU can effectively control the incidence of VAP and improve prognosis.
Keywords: Ventilator-associated pneumonia, risk factors, pathogen analysis
Introduction
Ventilator-associated pneumonia (VAP) is one of the most serious complications during mechanical ventilation. VAP is defined as pneumonia occurring 48 to 72 hours after tracheal intubation [1]. VAP is characterized by the presence of new or progressive infiltrates in the lungs, signs of systemic infection (fever, changes in white blood cell count), changes in sputum characteristics, and detection of pathogens. The incidence of VAP is between 1.2 and 8.5 per thousand, and the occurrence of VAP depends on the definition of VAP diagnosis. VAP accounts for about half of all cases of hospital-acquired pneumonia [2-4]. The risk of VAP was highest in the first 5 days (3%) of mechanical ventilation, and the average duration of intubation was 3.3 days [5,6].
There is currently no consensus on the diagnosis and definition of VAP [7]. Early-onset VAP is defined as pneumonia that occurs within 4 days of intubation, which is usually attributed to antibiotic-sensitive pathogens, and late-onset VAP is more likely to be caused by multi-drugs resistance (MDR) bacteria and occurred > 4 days after mechanical ventilation. Once VAP occurs, it is easy to incur offline difficulties, prolonged hospital stay and hospitalization costs, life-threatening infection, or death [1,8]. Therefore, an in-depth analysis of the independent risk factors related to the development of VAP is of great significance in preventing the occurrence of VAP and actively treating VAP [9,10]. Pseudomonas aeruginosa is one of the most common pathogens causing VAP and is independently associated with increased mortality; in China, it remains among the top three pathogens. Antibiotic treatment is the primary method for managing P. aeruginosa VAP; however, it constitutes a risk factor for the development of multi-drug resistant P. aeruginosa. Increasing drug resistance, especially in intensive care units (ICUs), could result in P. aeruginosa VAP becoming uncontrollable [11-14].
According to the third international consensus definitions for sepsis and septic shock (Sepsis-3), sepsis should be defined as life-threatening organ dysfunction caused by a dysregulated host response to infection [15]. Sepsis that is associated with VAP is the primary cause of death from infection; its recognition mandates urgent attention. Pathogen factors and host factors shape this syndrome: sex, age, comorbidities, and environment.
This study analyzes the risk factors associated with VAP, and further analyzes the pathogenic bacteria and their resistance in VAP. Moreover, this study discusses the prevention and treatment strategies of VAP, and provides theoretical guidance for clinical prevention and control of VAP.
Materials and methods
Patients and tissue samples
We selected 478 patients who used ventilators from November 2014 to July 2016 in our intensive care unit, 103 of whom had VAP, and the incidence was 21.5%. All patients underwent chest X-ray examination without pulmonary infection before admission. The study was approved by the Research Ethics Committee of Heze City Hospital. Informed consent was obtained from all patients. The study was conducted in accordance with the recognized ethical guideline of Declaration of Helsinki.
VAP diagnostic criteria
According to the diagnostic criteria of VAP as follows [16,17]: (1) After 48 hours of mechanical ventilation, the chest X-rays showed infiltrated lungs or new infiltrated shadows. The physical examination of the lungs revealed wet rales; one of the following conditions was also met: White blood cell count > 10 × 1011/L or < 4.0 × 10⁹/L; body temperature > 37.5°C; purulent respiratory secretions; isolation from the bronchial secretions of pathogenic bacteria. (2) Clinical Pulmonary Infection Scores: CPISS scores were calculated to be > 6 for confirmed or suspected cases. (3) Johanson criteria: New infiltrating shadows or infiltrates in the chest X-ray progression plus at least 2 of the following: body temperature > 38°C; white blood cell count increased or decreased; purulent secretions.
Exclusion criteria: (1) Mechanical ventilation time is less than 48 h. (2) Pulmonary infection has been diagnosed before entering the ICU. (3) Incomplete data. (4) Pulmonary embolism, ARDS, tuberculosis and other diseases.
Sepsis and systemic inflammatory response syndrome (SIRS)
In 1991 sepsis was first defined as a “SIRS to the presence of infection”, requiring the presence of 2 or more of: alterations in heart and respiratory rate, body temperature and white blood cell count as criteria. In addition, when sepsis was associated with an organ dysfunction it was called severe sepsis and when it was associated with refractory hypotension, septic shock [15,18]. The definition of sepsis was updated by the European Society of Medical Care Intensive Care Society and the Critical Care Medicine Society as an infection associated with an excessive immune response by the host with consequent organ failure.
Specimen detection method
The acquisition of specimens for etiological results was performed by using a disposable sterile suction tube or a branch fiberscope to take a deep suction tube, and the sterile container was directly sent for examination. Bacterial identification strains were identified by ATB and VITEK identification systems. Drug susceptibility test used the K-B method or VITEK system. Bacterial resistance was defined according to bacterial species: resistance of Staphylococcus aureus to methicillin; resistance of tiamethicillin, ceftazidime or imipenem to Pseudomonas aeruginosa; and broad-spectrum β-lactamase producing and cephalosporin resistance to Enterobacteriaceae.
Analysis of the circulating immune response
PBMC were incubated with combinations of fluorescein isothiocyanate (FITC), phycoerythrin (PE), phycoerythrin-cyanine 5.5 (PE-cy5.5), and peridinin chlorophyll protein (PerCP) monoclonal antibodies. The monoclonal antibodies were CD3-FITC, CD3-Percp/Cy5.5, CD4-PE, CD4-FITC, CD8-FITC, CD8-PE, CD16-FITC, CD56-PE, CD19-PE, CD25-FITC, CD127-Percp/Cy5.5, and CD28-PE (Beckman Coulter, USA). About 10,000 lymphocytes were assessed with FC500 software to determine the percentage of CD3+, CD4+, CD8+, CD3-CD16+CD56+, CD19+, CD4+CD25+CD127+, CD8+CD28-, and CD8+CD28+ lymphocytes.
Statistical methods
Continuous variables were expressed as mean ± SD (standard deviation) and compared using a two-tailed unpaired Student t test; categorical variables were compared using χ2 or Fisher analysis. The Greenwood formula was used for the standard deviation. A logistic regression approach [19] was chosen for the evaluation of the risk factors of VAP. Potential predicting variables were analyzed both univariately with one factor taken at a time, and then in a multivariate model combining all factors. Results were showed as odd hazard ratios (OR) and their 95% confidence intervals (CI) An OR > 1 indicated an elevated risk with respect to the reference category. A confidence interval which did not include the value 1 indicated statistical significance at the 5% level. All statistical evaluations were carried out using SPSS software (Statistical Package for the Social Science, version 15.0, SPSS Inc, Chicago, IL). A value of P < 0.05 was considered significant in all analyses.
Results
Patient characteristics
Among 478 patients with ventilator usage, 103 cases suffered ventilator-associated pneumonia (21.5%, 103/478). Among the 103 patients with VAP, 35 patients died and 43 patients had simultaneous sepsis. Among the 103 patients with VAP, the APACHE II score (30.74 ± 3.13), application of sedative antacids (32.50%), the rate of aspiration and reflux (27.50%) and ventilation time (13.84 ± 2.76 days) were significantly higher in observation group (patients with VAP) compared with that in the control group (patients without VAP (P < 0.05). These variables were confirmed as associated risk factors for VAP. There were no significant differences in age and gender between the two groups (P > 0.05). The baseline characteristics of patients are summarized in Table 1.
Table 1.
Clinical and pathologic features of patients with ventilator-assisted pneumonia (N = 478)
| Variable | VAP (n = 103) | Non-VAP (n = 375) | P values |
|---|---|---|---|
| Age (years) | 59.2 ± 13.4 | 58.8 ± 14.5 | 0.327 |
| Gender | 0.002 | ||
| Male | 71 | 192 | |
| Female | 32 | 183 | |
| Hospital stay (days) | 0.001 | ||
| ≥ 15 days | 82 | 182 | |
| < 15 days | 21 | 193 | |
| APACHE II scores | 0.088 | ||
| ≥ 18 | 66 | 205 | |
| < 18 | 37 | 170 | |
| Mechanical ventilation | 0.015 | ||
| Endotracheal intubation | 55 | 249 | |
| Tracheotomy | 48 | 126 | |
| Mechanical ventilation time | 0.001 | ||
| ≥ 7 days | 70 | 172 | |
| < 7 days | 33 | 203 | |
| Basic diseases | 0.602 | ||
| Yes | 47 | 182 | |
| No | 56 | 193 | |
| Aspiration and reflux | 0.008 | ||
| Yes | 48 | 122 | |
| No | 55 | 253 | |
| Use of sedatives and antacids | 0.391 | ||
| Yes | 52 | 168 | |
| No | 51 | 207 | |
| Use of glucocorticoids | 0.271 | ||
| Yes | 46 | 145 | |
| No | 57 | 230 | |
| Retained stomach tube | 0.123 | ||
| Yes | 64 | 201 | |
| No | 39 | 174 |
Multiple logistic regression analysis of risk factors associated with VAP
The risk factors associated with the occurrence of ICU ventilator-associated pneumonia, including gender, duration of hospitalization, mechanical ventilation, mechanical ventilation time, and aspiration and reflux, were included in the multivariate logistic regression model after univariate analysis. We found that mechanical ventilation: tracheotomy (P = 0.013, OR = 1.446, 95% CI: 1.168-3.482), mechanical ventilation time ≥ 7 days (P = 0.021, OR = 1.355, 95% CI: 1.271-3.347) and aspiration and reflux (P = 0.011, OR: 1.667, 95% CI: 1.461-2.971) were independent risk factors associated with VAP (Table 2).
Table 2.
Multivariate logistic regression analysis of risk factors related to VAP
| Variable | Multivariate logistic regression analysis | ||
|---|---|---|---|
|
| |||
| OR | 95% CI | P value | |
| Gender: male | 1.046 | 0.968-1.249 | 0.417 |
| Hospital stay (days) ≥ 15 days | 1.083 | 0.963-1.125 | 0.632 |
| Mechanical ventilation: tracheotomy | 1.446 | 1.168-3.482 | 0.013 |
| Mechanical ventilation time ≥ 7 days | 1.355 | 1.271-3.347 | 0.021 |
| Aspiration and reflux: Yes | 1.667 | 1.461-2.971 | 0.011 |
Peripheral lymphocyte subset analysis of patients between VAP group and non-VAP group
Compared with those of the non-VAP group, the proportion of CD3+ (P = 0.012), CD3+CD4+ (P = 0.024) and CD8+ CD28+ (P = 0.017) T cells in the VAP group were increased significantly, which showed a more severe immune response (Figure 1). Since the proportion of CD3+CD4+ and CD8+CD28+T cells in VAP group are significantly higher than those in the non-VAP group (P < 0.05), we performed multifactor analysis and found that CD8+CD28+T cells had an independent risk factor relation to VAP (P < 0.05, Figure 2). We further divided the patients into a death group and a survivor group with respect to the VAP group, then, analyzed the differences between the two groups. First, we divided the VAP group into the death group and the survivor group. Then, we divided the VAP group into the sepsis group and without sepsis group, respectively. Finally, we compared the characteristics of lymphocyte subsets between the subgroups, respectively.
Figure 1.

Peripheral lymphocyte subset analysis of patients between VAP group and non-VAP group.
Figure 2.

Multiple analysis of peripheral lymphocyte subsets for VAP.
The subgroup analysis results showed that CD3+CD4+T cells and CD8+CD28+T cells in the survivor subgroup were significantly higher than those in the dead subgroup (P < 0.05) (Figure 3A, 3B). The CD3+CD4+T cells and CD8+CD28+T cells in the without-sepsis subgroup were significantly higher than those in the sepsis subgroup, respectively (P < 0.05) (Figure 4A, 4B).
Figure 3.
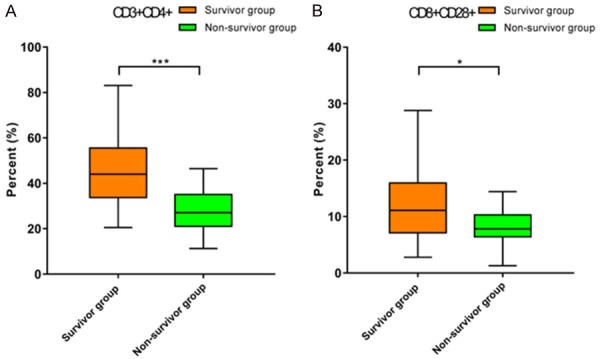
Peripheral lymphocyte subset analysis of patients stratified by survival in patients with VAP.
Figure 4.

Peripheral lymphocyte subset analysis of patients stratified by sepsis in patients with VAP.
Distribution of pathogens in infected patients
The pathogenic microorganisms of 103 infected patients were cultured and a total of 137 pathogenic bacteria were isolated; Gram-negative bacteria were the major bacteria, and a total of 179 strains accounted for 72.3%. The details are shown in Table 3.
Table 3.
Distribution of pathogenic bacteria in VAP patients (%)
| Pathogen | N | Percent (%) |
|---|---|---|
| Klebsiella pneumoniae | 26 | 25.2 |
| Acinetobacter baumannii | 37 | 35.9 |
| Escherichia coli | 14 | 13.6 |
| Pseudomonas aeruginosa | 16 | 15.5 |
| Proteobacteria | 6 | 5.8 |
| Staphylococcus aureus | 18 | 5.8 |
| Pneumococcus | 13 | 12.7 |
| Others | 7 | 6.8 |
Antimicrobial drug resistance of major gram-negative bacteria
The main gram-negative bacteria included E. coli, Klebsiella pneumoniae, Pseudomonas aeruginosa, and Acinetobacter baumannii. The highest resistance rate of Escherichia coli to ampicillin was 57.1%. The highest resistant rates to aztreonam were 53.8% and 68.8% for Klebsiella pneumoniae and Pseudomonas aeruginosa. Pipercisin resistance to Acinetobacter baumannii was the highest. The highest rate is 59.5%. Details are shown in Table 4.
Table 4.
Results of antimicrobial resistance analysis of major gram-negative bacteria
| E. coli (n = 14) | Klebsiella pneumoniae (n = 26) | Pseudomonas aeruginosa (n = 16) | Acinetobacter baumannii (n = 37) | |||||
|---|---|---|---|---|---|---|---|---|
|
|
|
|
|
|||||
| N | Resistance rate (%) | N | Resistance rate (%) | N | Resistance rate (%) | N | Resistance rate (%) | |
| Ampicillin | 8 | 57.1 | 14 | 53.8 | 10 | 62.5 | 16 | 43.2 |
| Gentamicin | 9 | 64.3 | 10 | 38.5 | 11 | 68.8 | 12 | 32.4 |
| Aztreonam | 10 | 71.4 | 14 | 53.8 | 8 | 50 | 21 | 56.8 |
| Piperacillin | 9 | 64.3 | 13 | 50 | 7 | 43.8 | 22 | 59.5 |
| Cefazolin | 6 | 42.8 | 9 | 34.6 | 5 | 31.3 | 10 | 27.1 |
| Cefaclor | 3 | 21.4 | 10 | 38.5 | 5 | 31.3 | 9 | 24.3 |
| Ceftazidime | 5 | 35.7 | 11 | 42.3 | 7 | 43.8 | 11 | 29.7 |
| Ceftriaxone | 8 | 57.1 | 9 | 34.6 | 7 | 43.8 | 12 | 32.4 |
| Cefotaxime sodium | 7 | 50 | 7 | 26.9 | 8 | 50 | 12 | 32.4 |
| Levofloxacin | 5 | 35.7 | 9 | 34.6 | 5 | 31.3 | 9 | 24.3 |
| Ciprofloxacin | 3 | 21.4 | 12 | 46.2 | 6 | 37.5 | 9 | 24.3 |
| Imipenem | 0 | 0 | 3 | 11.5 | 1 | 6.3 | 3 | 8.1 |
Antimicrobial drug resistance of major Gram-positive bacteria
The Gram-negative bacteria encountered include Staphylococcus aureus and Streptococcus pneumoniae. Both Staphylococcus aureus and Streptococcus pneumoniae had the highest resistance rate to penicillin of 100%, and the resistance rates to vancomycin were the lowest, at 5.6% and 0, as shown in Table 5.
Table 5.
Analysis of antimicrobial resistance of major Gram-positive bacteria
| Staphylococcus aureus (n = 18) | Pneumococcus (n = 13) | |||
|---|---|---|---|---|
|
|
|
|||
| n | Resistance rate (%) | n | Resistance rate (%) | |
| Penicillin | 18 | 100 | 13 | 100 |
| Oxacillin | 12 | 66.7 | 6 | 46.2 |
| Clindamycin | 8 | 44.4 | 8 | 61.5 |
| Levofloxacin | 10 | 55.6 | 5 | 38.5 |
| Vancomycin | 1 | 5.6 | 0 | 0 |
Discussion
As a common iatrogenic infectious disease in ICU, VAP is also one of the most common complications of mechanical ventilation therapy. Patients with VAP have longer ICU stays, higher morbidity and mortality, and more infectious pathogens [2,20]. It has been reported that the incidence of VAP is about 20%-71%, and the mortality rate of VAP patients in the ICU is relatively high, which is closely related to the various risk factors for VAP. Common VAP prevention measures, such as daily interruptions of sedative medications and assessments prior to preparation for extubation, may not work since related injuries such as severe chest trauma, intra-abdominal bleeding, and damage to other organs need to be considered. The prognosis of VAP is still variable. It is closely related to the patient’s primary disease, pathogenic characteristics, and use of antibiotics [21,22].
Although the occurrence and development of VAP are basically the same as those associated with other nosocomial infections, VAP still has certain predisposing factors for pulmonary infection, mainly tracheal intubation and mechanical ventilation [23,24]. The risk factors for VAP induction depended in part on the time of exposure to the ICU environment, the host factors, and factors associated with the development of treatment that lead to VAP. Other risks depended on factors that increased the likelihood of colonization of the alimentary canal by pathogenic bacteria (previous antibiotic exposure, age older than 60 years, chronic obstructive pulmonary disease) and induced contaminated secretions causing aspiration (supine position, coma, and head injury) [25]. In this study, we analyzed by multivariate logistic regression models and found that mechanical ventilation: tracheotomy (P = 0.013), mechanical ventilation time ≥ 7 days (P = 0.02) and aspiration and reflux (P = 0.011) were independent risk factors associated with VAP.
Early-onset VAP is caused by antibiotic-sensitive pathogens, but late-onset VAP is caused by multidrug-resistant bacteria, which is more difficult to treat. The microbiological environment has a significant effect on VAP strains, particularly in late-onset VAP, but also affects early-onset VAP [26]. Choice of the right antibiotic depended on the duration of mechanical ventilation. Late-stage VAP (> 4 days) requires broad-spectrum antibiotics but early-stage disease (≤ 4 days) can be selected for narrow-spectrum antibiotic therapy. Various hospitals and ICUs need to constantly update the use of antibiotics based on local bacterial morphology and sensitivity, and accumulate initial experience of an optimal dose [27,28]. In any empirical antibiotic regimen, step down is the key to reducing drug resistance. It is thought to provide the greatest benefit for individual patients. Delayed antibiotic treatment may increase the risk of death from VAP [29]. In critically ill patients, assisted mechanical ventilation and antibiotic treatment are necessary measures to prevent and treat ventilator-associated pneumonia. The study found that pathogenic microorganisms in respiratory secretions of patients with severe ventilator-associated pneumonia were mainly gram-negative bacilli. Our study also confirmed that the distribution of VAP pathogens chiefly include Acinetobacter baumannii, Pseudomonas aeruginosa, Klebsiella pneumoniae, and Escherichia coli with a rate of high drug resistance, which were mainly to ampicillin, gentamicin, cefazolin, cefotaxime sodium, and others, while serious multidrug resistance was also observed. Therefore, the analysis of the characteristics of VAP pathogens and their drug resistance is of guiding significance for future clinical prevention and treatment of VAP.
In summary, the occurrence and development of VAP in patients under ICU control is of utmost importance and is also a key and difficult task in ICU work. Patients with advanced age, coma, and diabetes mellitus need intense monitoring to ensure curative effect, shorten mechanical ventilation time and length of hospital stay, reasonably select antimicrobial drugs according to bacterial culture and drug susceptibility test results, and strengthen patient care management in the ICU. Comprehensive prevention and control of risk factors in all aspects can effectively control the incidence of VAP and improve prognosis.
Disclosure of conflict of interest
None.
References
- 1.Damas P, Frippiat F, Ancion A, Canivet JL, Lambermont B, Layios N, Massion P, Morimont P, Nys M, Piret S, Lancellotti P, Wiesen P, D’Orio V, Samalea N, Ledoux D. Prevention of ventilator-associated pneumonia and ventilator-associated conditions: a randomized controlled trial with subglottic secretion suctioning. Crit Care Med. 2015;43:22–30. doi: 10.1097/CCM.0000000000000674. [DOI] [PubMed] [Google Scholar]
- 2.American Thoracic Society; Infectious Diseases Society of America. Guidelines for the management of adults with hospital-acquired, ventilator-associated, and healthcare-associated pneumonia. Am J Respir Crit Care Med. 2005;171:388–416. doi: 10.1164/rccm.200405-644ST. [DOI] [PubMed] [Google Scholar]
- 3.Vincent JL, Bihari DJ, Suter PM, Bruining HA, White J, Nicolas-Chanoin MH, Wolff M, Spencer RC, Hemmer M. The prevalence of nosocomial infection in intensive care units in Europe. Results of the European Prevalence of Infection in Intensive Care (EPIC) Study. EPIC International Advisory Committee. JAMA. 1995;274:639–644. [PubMed] [Google Scholar]
- 4.Chastre J, Fagon JY. Ventilator-associated pneumonia. Am J Respir Crit Care Med. 2002;165:867–903. doi: 10.1164/ajrccm.165.7.2105078. [DOI] [PubMed] [Google Scholar]
- 5.Skrupky LP, McConnell K, Dallas J, Kollef MH. A comparison of ventilator-associated pneumonia rates as identified according to the national healthcare safety network and American college of chest physicians criteria. Crit Care Med. 2012;40:281–284. doi: 10.1097/CCM.0b013e31822d7913. [DOI] [PubMed] [Google Scholar]
- 6.Rello J, Ollendorf DA, Oster G, Vera-Llonch M, Bellm L, Redman R, Kollef MH. Epidemiology and outcomes of ventilator-associated pneumonia in a large US database. Chest. 2002;122:2115–2121. doi: 10.1378/chest.122.6.2115. [DOI] [PubMed] [Google Scholar]
- 7.Wolfensberger A, Meier MT, Clack L, Schreiber PW, Sax H. Preventing ventilator-associated pneumonia-a mixed-method study to find behavioral leverage for better protocol adherence. Infect Control Hosp Epidemiol. 2018;39:1222–1229. doi: 10.1017/ice.2018.195. [DOI] [PubMed] [Google Scholar]
- 8.Blot S, Koulenti D, Dimopoulos G, Martin C, Komnos A, Krueger WA, Spina G, Armaganidis A, Rello J EU-VAP Study Investigators. Prevalence, risk factors, and mortality for ventilator-associated pneumonia in middle-aged, old, and very old critically ill patients*. Crit Care Med. 2014;42:601–9. doi: 10.1097/01.ccm.0000435665.07446.50. [DOI] [PubMed] [Google Scholar]
- 9.Tan B, Zhang F, Zhang X, Huang YL, Gao YS, Liu X, Li YL, Qiu JF. Risk factors for ventilator-associated pneumonia in the neonatal intensive care unit: a meta-analysis of observational studies. Eur J Pediatr. 2014;173:427–434. doi: 10.1007/s00431-014-2278-6. [DOI] [PubMed] [Google Scholar]
- 10.Tsakiridou E, Makris D, Daniil Z, Manoulakas E, Chatzipantazi V, Vlachos O, Xidopoulos G, Charalampidou O, Zakynthinos E. Acinetobacter baumannii infection in prior ICU bed occupants is an independent risk factor for subsequent cases of ventilator-associated pneumonia. Biomed Res Int. 2014;2014:193516. doi: 10.1155/2014/193516. [DOI] [PMC free article] [PubMed] [Google Scholar]
- 11.Spalding MC, Cripps MW, Minshall CT. Ventilator-associated pneumonia: new definitions. Crit Care Clin. 2017;33:277–292. doi: 10.1016/j.ccc.2016.12.009. [DOI] [PMC free article] [PubMed] [Google Scholar]
- 12.Rosenthal VD, Bijie H, Maki DG, Mehta Y, Apisarnthanarak A, Medeiros EA, Leblebicioglu H, Fisher D, Álvarez-Moreno C, Khader IA, Del Rocío González Martínez M, Cuellar LE, Navoa-Ng JA, Abouqal R, Guanche Garcell H, Mitrev Z, Pirez García MC, Hamdi A, Dueñas L, Cancel E, Gurskis V, Rasslan O, Ahmed A, Kanj SS, Ugalde OC, Mapp T, Raka L, Yuet Meng C, Thu le TA, Ghazal S, Gikas A, Narváez LP, Mejía N, Hadjieva N, Gamar Elanbya MO, Guzmán Siritt ME, Jayatilleke K INICC members. International Nosocomial Infection Control Consortium (INICC) report, data summary of 36 countries, for 2004-2009. Am J Infect Control. 2012;40:396–407. doi: 10.1016/j.ajic.2011.05.020. [DOI] [PubMed] [Google Scholar]
- 13.Gupta R, Malik A, Rizvi M, Ahmed M, Singh A. Epidemiology of multidrug-resistant Gram-negative pathogens isolated from ventilator-associated pneumonia in ICU patients. J Glob Antimicrob Resist. 2017;9:47–50. doi: 10.1016/j.jgar.2016.12.016. [DOI] [PubMed] [Google Scholar]
- 14.Ding C, Yang Z, Wang J, Liu X, Cao Y, Pan Y, Han L, Zhan S. Prevalence of pseudomonas aeruginosa and antimicrobial-resistant pseudomonas aeruginosa in patients with pneumonia in mainland China: a systematic review and meta-analysis. Int J Infect Dis. 2016;49:119–128. doi: 10.1016/j.ijid.2016.06.014. [DOI] [PubMed] [Google Scholar]
- 15.Singer M, Deutschman CS, Seymour CW, Shankar-Hari M, Annane D, Bauer M, Bellomo R, Bernard GR, Chiche JD, Coopersmith CM, Hotchkiss RS, Levy MM, Marshall JC, Martin GS, Opal SM, Rubenfeld GD, van der Poll T, Vincent JL, Angus DC. The third international consensus definitions for sepsis and septic shock (sepsis-3) JAMA. 2016;315:801–810. doi: 10.1001/jama.2016.0287. [DOI] [PMC free article] [PubMed] [Google Scholar]
- 16.Chacko R, Rajan A, Lionel P, Thilagavathi M, Yadav B, Premkumar J. Oral decontamination techniques and ventilator-associated pneumonia. Br J Nurs. 2017;26:594–599. doi: 10.12968/bjon.2017.26.11.594. [DOI] [PubMed] [Google Scholar]
- 17.Kalil AC, Metersky ML, Klompas M, Muscedere J, Sweeney DA, Palmer LB, Napolitano LM, O’Grady NP, Bartlett JG, Carratala J, El Solh AA, Ewig S, Fey PD, File TM Jr, Restrepo MI, Roberts JA, Waterer GW, Cruse P, Knight SL, Brozek JL. Management of adults with hospital-acquired and ventilator-associated pneumonia: 2016 clinical practice guidelines by the infectious diseases society of America and the American Thoracic Society. Clin Infect Dis. 2016;63:e61–e111. doi: 10.1093/cid/ciw353. [DOI] [PMC free article] [PubMed] [Google Scholar]
- 18.Bone RC, Balk RA, Cerra FB, Dellinger RP, Fein AM, Knaus WA, Schein RM, Sibbald WJ. Definitions for sepsis and organ failure and guidelines for the use of innovative therapies in sepsis. The ACCP/SCCM Consensus Conference Committee. American College of Chest Physicians/Society of Critical Care Medicine. Chest. 1992;101:1644–1655. doi: 10.1378/chest.101.6.1644. [DOI] [PubMed] [Google Scholar]
- 19.Cox D. Regression models and life-tables. J Royal Stat Soc B. 1972;34:187–220. [Google Scholar]
- 20.Nair GB, Niederman MS. Ventilator-associated pneumonia: present understanding and ongoing debates. Intensive Care Med. 2015;41:34–48. doi: 10.1007/s00134-014-3564-5. [DOI] [PMC free article] [PubMed] [Google Scholar]
- 21.Morrow LE, Kollef MH. Recognition and prevention of nosocomial pneumonia in the intensive care unit and infection control in mechanical ventilation. Crit Care Med. 2010;38:S352–362. doi: 10.1097/CCM.0b013e3181e6cc98. [DOI] [PubMed] [Google Scholar]
- 22.Zilberberg MD, Shorr AF. Ventilator-associated pneumonia: the clinical pulmonary infection score as a surrogate for diagnostics and outcome. Clin Infect Dis. 2010;51(Suppl 1):S131–135. doi: 10.1086/653062. [DOI] [PubMed] [Google Scholar]
- 23.Vincent JL. Nosocomial infections in adult intensive-care units. Lancet. 2003;361:2068–2077. doi: 10.1016/S0140-6736(03)13644-6. [DOI] [PubMed] [Google Scholar]
- 24.Appelgren P, Hellstrom I, Weitzberg E, Soderlund V, Bindslev L, Ransjo U. Risk factors for nosocomial intensive care infection: a long-term prospective analysis. Acta Anaesthesiol Scand. 2001;45:710–719. doi: 10.1034/j.1399-6576.2001.045006710.x. [DOI] [PubMed] [Google Scholar]
- 25.Di Pasquale M, Ferrer M, Esperatti M, Crisafulli E, Giunta V, Li Bassi G, Rinaudo M, Blasi F, Niederman M, Torres A. Assessment of severity of ICU-acquired pneumonia and association with etiology. Crit Care Med. 2014;42:303–312. doi: 10.1097/CCM.0b013e3182a272a2. [DOI] [PubMed] [Google Scholar]
- 26.Morris AC, Hay AW, Swann DG, Everingham K, McCulloch C, McNulty J, Brooks O, Laurenson IF, Cook B, Walsh TS. Reducing ventilator-associated pneumonia in intensive care: impact of implementing a care bundle. Crit Care Med. 2011;39:2218–2224. doi: 10.1097/CCM.0b013e3182227d52. [DOI] [PubMed] [Google Scholar]
- 27.Schreiber MP, Shorr AF. Challenges and opportunities in the treatment of ventilator-associated pneumonia. Expert Rev Anti Infect Ther. 2017;15:23–32. doi: 10.1080/14787210.2017.1250625. [DOI] [PubMed] [Google Scholar]
- 28.Shorr AF, Chan CM, Zilberberg MD. Diagnostics and epidemiology in ventilator-associated pneumonia. Ther Adv Respir Dis. 2011;5:121–130. doi: 10.1177/1753465810390262. [DOI] [PubMed] [Google Scholar]
- 29.Masterton RG. Antibiotic de-escalation. Crit Care Clin. 2011;27:149–162. doi: 10.1016/j.ccc.2010.09.009. [DOI] [PubMed] [Google Scholar]