

Abstract
Epigallocatechin-3-gallate (EGCG) is a natural product with potential anti-cancer property whose direct target has not been identified. This study intended to investigate ERα36, a new isoform of estrogen receptor alpha (ERa), as a therapeutic target of EGCG in hepatocellular carcinoma (HCC). In this work, we examined the expression level of ERs in HCC cell lines and a normal human liver cell line, and evaluated inhibition effect of EGCG on these cells in vitro, and further on Hep3B in vivo. The results showed that ERα36 was the main ER in HCC cells and served as a biomarker of responsiveness to EGCG inhibition, and there was a positive correlation between ERα36 expression level and inhibitory effect of EGCG as indicated by IC50. In vivo experiments also showed dose-dependent inhibition of EGCG on ERα36 high-expressing Hep3B. EGCG exerted inhibition on Hep3B cells by both anti-proliferation and pro-apoptosis. ERα36-EGFR-Her-2 feedback loop, PI3K/Akt and MAPK/ERK pathways were inhibited, while caspase 3 was activated by EGCG in Hep3B cells, with p-ERK accumulated in cytoplasm. The inhibitory effect of EGCG was significantly attenuated when ERα36 was pre-activated. This is the first evidence that EGCG exerts its anti-cancer effect by inhibiting ERα36, followed with inhibition of the ERα36-EGFR-Her-2 feedback loop and PI3K/Akt, MAPK/ERK pathway, activation of caspase 3, and accumulation of p-ERK in cytoplasm. It suggests that ERα36 might be an efficient target of EGCG in HCC.
Keywords: ERα36, EGCG, HCC, anti-cancer
Introduction
Hepatocellular carcinoma (HCC), one of the common cancers, ranks the seventh in cancer incidence and the fourth in cancer-related death worldwide according to World Health Organization (WHO). Patients at early stage with well-preserved liver function (Child-Pugh class A) are candidates for curative treatments like resection and liver transplantation. However, most patients are at advanced stage when diagnosed with HCC, when only palliative treatments are available, such as embolization, ablation, and radiation therapy. Advanced strategies like multikinase inhibitor (sorafenib for example) and immunotherapy (still under investigation) have benefited patients, but the overall prognosis is still poor with certain side effects. Therefore, precision and powerful therapeutic means of HCC are still in urgent need.
In this work, we found ERα36 to be a potential therapeutic target in HCC. ERα36 is one of the isoforms of estrogen receptor alpha (ERα) with a variant ligand binding domain. Its specific structure makes it possible to bind with many other molecules in addition to estrogen [1]. Now it is widely believed that ERα36 is involved in the development and progression of cancer and is always considered as a poor prognostic factor in an estrogen-independent manner in breast cancer, aggressive laryngeal cancer, and renal cell carcinoma, and contributes to the development of acquired chemoresistance in breast cancer cells [2-5]. It has also been reported that ERα36 expression was highly upregulated in HCC compared to normal liver tissue [6-9], suggesting ERα36 might play a role in HCC and be a potential therapeutic target.
Epigallocatechin-3-gallate (EGCG), the main natural component of green tea, attracting increasing attention to its anti-cancer properties by inhibiting carcinogenic activity, angiogenesis, migration and penetration, inducing apoptosis and cell cycle arrest [10-13]. The anti-HCC effect of EGCG has been well-documented. EGCG could prominently inhibit HCC cells by ways mentioned above, reversing multidrug resistance in cancer cells. Various mechanisms were reported to be involved in these processes, such as the suppression of PI3K/Akt and NF-kB pathway, the alteration of Bcl-2 family proteins, the activation of caspase-3/9, the elevation of ROS, the release of cytochrome c from mitochondria, metabolic shift away from glycolysis, and inhibition of cancer stem cells (CSCs) [14-20]. However, evidence about the exact targets of EGCG is still insufficient. Recent studies suggested that EGCG might exert its anti-cancer effect by inhibiting ERα36 in breast cancer cells [21,22]. As mentioned previously, ERα36 is highly expressed in HCC cells but not in normal hepatocytes. In addition, the metabolism of EGCG is mainly regulated by the liver, so that bioavailability of EGCG might be higher in liver. All these factors support the idea that EGCG might be an effective drug for HCC precision medication by targeting ERα36.
In order to examine the effect of EGCG on HCC cells and the role of ERα36 in EGCG’s anti-HCC effect, we detected the expression profile of ER variants in several cell lines, and tried to figure the relation between cell sensitivity to EGCG and its expression of ERα36, and then evaluated the anti-cancer effect of EGCG both in vitro and in vivo. Furthermore, possible mechanisms of the anti-HCC effect of EGCG mediated by ERα36 were investigated.
Materials and methods
Cell culture
Hepatocellular carcinoma cell lines, Hep3B, HepG2, sk-hep1, hcc-lm3, Huh7 and SMMC7721, human liver cell line L-02, and breast cancer cell line MCF-7 were purchased from the American Type Culture Collection (ATCC) and maintained in our laboratory. Hep3B, SMMC7721, L-02 and MCF-7 cells were cultured in RPMI-1640 (Boster Biological Technology Co, Ltd, Wuhan, China) with 10% FBS (Biological Industries, Beit Haemek Ltd, Israel), HepG2, sk-hep1, hcc-lm3 and Huh7 were cultured in Dulbecco’s modified Eagle’s medium (DMEM, high glucose) (Corning Incorporated, New York, NY, USA) supplemented with 10% FBS in a humidified incubator at 37°C with 5% CO2.
Western blot analysis
Whole cell lysate was prepared by incubation on ice in radioimmunoprecipitation assay (RIPA) buffer (150 mM NaCl, 100 mM Tris pH 8.0, 0.1% SDS, 1% Triton X-100, 1% sodium deoxycholate, 5 mM EDTA and 10 mM NaF) containing CompleteTM Protease Inhibitor Cocktail Tablet (Santa Cruz Biotechnology, Dallas, Texas, USA) for 30 min, and then by centrifugation at 15,000 rpm for 15 min at 4°C. Protein concentration was quantified by Pierce BCA Protein Assay Kit (ThermoFisher Scientific, Rockford, Illinois, USA) according to instruction. Protein samples were prepared by mixing with 5x sample buffer (250 mM Tris-HCl pH 6.8, 10% SDS, 50% glycerol, 10% 2-mercaptoethanol, 0.5% bromophenol blue) at a ratio of 4:1, denatured for 5 min at 98°C followed chilled 5 min on ice. Fifteen microgram proteins of each sample were loaded to 10% SDS-polyacrylamide gel and underwent electrophoresis, followed by transfer onto 0.22 nm PVDF membrane (Millipore Corporation, Bedford, MA, USA). We blocked with 5% skim milk (ThermoFisher Scientific, Rockford, Illinois, USA) in TBS-T (0.5 M NaCl, 0.1 M Tris-HCl, 0.1% Tween-20) for 1 h at room temperature. The membranes were then probed with primary antibodies diluted in 5% milk, 1:40000 HRP-anti-β-actin (Kangchen, Shanghai, China), 1:6000 anti-ERα36 (Abmart, Shanghai, China), 1:3000 anti-ERα66 (Abcam, MA, USA), 1:2000 anti-ERβ (ThermoFisher Scientific, Rockford, Illinois, USA), and incubated overnight at 4°C with gentle shaking. Next day, after three washes with TBS-T, membranes were probed with second antibodies (HRP-anti-mouse/rabbit IgG antibody, ZSGB-BIO, Beijing, China) with dilution of 1:10000 in 5% skim milk for 2 h at room temperature. After another three washes, signals were detected by LuminataTM Western HRP substrates (Millipore Corporation, Billerica, MA, USA) and Chemi-DocTM MP Imaging System (v5.2.1, Bio-Rad Laboratories, Inc, Hercules, CA, USA).
Cell viability analysis by Cell Counting Kit-8 (CCK-8)
Cells were seeded in 96-well tissue culture plates with 10,000 cells per well in 100 µL medium 24 h before treatment. Fresh medium with a series of concentration of EGCG (Sigma-Aldrich Corp, St. Louis, MO, USA): 0, 20, 40, 60, 80 and 100 µg/mL was added into wells respectively with five duplicates, 100 µL per well. After 72 h, the cultured medium was replaced by medium containing 10% CCK-8, and incubated for 2 h at 37°C before OD450 nm was measured by a microplate reader (SpectraMax M5, Molecular Devices, Sunnyvale, CA, USA). IC50 was calculated by SPSS 23.0.
Tumor xenograft in nude mice
Twenty 6-week-old female mice were bred for one week to adapt to the feeding environment before experiments. Each mouse was injected with 2 × 10⁷ Hep3B cells suspended in 100 µL PBS mixed with 100 µL Matrigel (Corning Incorporated, New York, NY, USA) in the right front dorsum. Mice were randomized into 4 groups which were treated with 50, 10 or 2 mg/kg EGCG or sterile ddH2O (vehicle) separately by intraperitoneal injection every other day. Mice were dosed when the tumor size was in the range of 200 mm3 to 2500 mm3, and tumor volume was measured at every dose. At the end of the treatment, all the mice were euthanatized using cervical dislocation, with the tumors harvested and fixed in 10% formalin. The fixed tumors were prepared into paraffin sections and stained by hematoxylin and eosin (H&E). The animal experiment was approved by the Committee on the Ethics of Animal Experiments of the Second Affiliated Hospital of Zhejiang University School of Medicine.
Apoptosis analysis by cell flow cytometry
Hep3B and L-02 cells were seeded in a 6-well tissue culture plate with 5 × 10⁵ cells per well, 4 mL medium with final concentrations of 30, 60 µg/mL EGCG added to cells 24 h later. All the cells were collected and washed with ice-cold PBS for twice, and then resuspended in 0.5 mL Binding Buffer following the manual of BD Pharmingen PE Annexin V Apoptosis Detection Kit I (BD Biosciences, NJ, USA). One hundred microliters cell suspension was gently mixed with 5 µL PE Annexin V and 5 µL 7-ADD and incubated for 15 min at room temperature. Samples were mixed with 400 µL Binding Buffer before apoptosis analysis by flow cytometry.
Cell treatment and further analysis
Hep3B and L-02 cells were seeded in 6 cm tissue culture dishes with 106 cells per dish 24 h before treatment with 0, 10, 20, 40, 80 or 160 µg/mL EGCG respectively for 48 h. As well, additional dishes of cells were treated with 30, or 60 µg/mL EGCG respectively for 12 h, 24 h, 36 h and 48 h separately. Protein samples were prepared for western blot analysis (performed as previously mentioned) to detect expression of EGFR, Her-2, ERα36, ERK, p-ERK, caspase 3, cleaved-caspase 3 (antibodies against EGFR, Her-2, ERK, p-ERK, caspase 3, cleaved-caspase 3, Cell Signaling Technology, MA, USA) and b-actin.
Protein cellular compartments by cell fractionation
Cytosolic and nuclear fractions of the cell samples were separated by fractionation. Cells treated with 0, 30 or 60 µg/mL EGCG respectively for 24 h were collected and washed with ice-cold PBS twice, resuspended with 1 mL PBS. 200 µL of suspension was preserved for “whole cell lysate”. The remaining cells were deposited by centrifugation and lysed with 100 µL ice-cold PBS containing 0.1% NP-40, centrifuged at 15,000 g for 5 min at 4°C, and the supernatant was collected as “cytosolic fraction”. The pelleted “nuclear fraction” was washed with PBS containing 0.1% NP-40 once before being lysed with RIPA buffer containing CompleteTM Protease Inhibitor Cocktail Tablet. The cells preserved for “whole cell lysate” were lysed in the same way. The lysate was centrifuged at 15,000 g for 15 min at 4°C and the supernatant was collected to give the “nuclear fraction” and “whole cell lysate” respectively. Further western blot analysis for ERα36, ERK, p-ERK, GAPDH (GAPDH Ab, Kangchen, Shanghai, China), and Histone H3 (Histone H3 Ab, Cell Signaling Technology, MA, USA) was performed as previously mentioned.
ERα36 cellular localization by cell immunofluorescence
Hep3B cells were seeded into 24-well tissue culture plates with sterile slides inside for 24 h. Cells were treated with 30 or 60 µg/mL EGCG separately for 24 h. Slides were washed with ice-cold PBS twice mildly, and cells on the slides were fixed by methanol at -20°C for 10 min, left air to dry at room temperature, and then blocked by 5% BSA (Amresco, TX, USA). Anti- ERα36 antibody with a dilution of 1:1000 in 5% BSA was used to probe the cells overnight at 4°C. Next day, slides were washed with PBS for three times, 10 min each time, then incubated with Alexa Fluro® 488-IgG (ZSGB-BIO, Beijing, China) with a dilution of 1:500 in 5% BSA for 1.5 h at room temperature, followed by washes with PBS for three times before being stained with 5 µg/mL Hoechst 33342 (Sigma-Aldrich Corp, St. Louis, MO, USA), then mounted with glycerol. Fluorescence signals were observed under a fluorescence microscope.
Pre-activation of ERα36
Estrogen (E2) dissolved in ethanol (the final concentration of ethanol was 0.01%, which would affect the cells as little as possible) was used to activate ERα36 to find out whether EGCG exerted its function through ERα36 or not. Hep3B and L-02 cells were pretreated with phenol red-free RPMI-1640 containing 10% Charcoal Stripped hormone-free FBS for one week before being seeded in 96-well tissue culture plate with 10,000 cells per well. After 24 h, cells were divided into 4 groups and treated as follows. Group A: cells were treated with hormone-free medium containing vehicle (0.01% ethanol) or 10-7, 10-8, 10-9, 10-10, 10-11, 10-12 M E2 for 48 h. Group B: cells were pretreated with E2 at the same concentration gradient as group A for 1 h, and then treated with E2 along with 30 µg/mL EGCG for another 47 h. Group C: cells were pretreated with 30 µg/mL EGCG independently for 1 h, followed by another 47 h with E2 at the same concentration gradient as group A along with 30 µg/mL EGCG. Group D: cells were treated with E2 at the same concentration gradient as group A along with 30 µg/mL EGCG for 48 h. Cell viability was assayed by using CCK-8.
Results
ERα36 predominates among ER isoforms in HCC and serves as a biomarker of responsiveness to EGCG inhibition
As shown in Figure 1, the expression of ERα36 was detected in five hepatic cell lines, L-02, Hep3B, Sk-hep1, hcc-lm3 and Huh-7, and showed ERα36 as the dominant ER isoforms in HCC. ERα66 and ERβ were at very low levels or not detectable at all. With the increase of EGCG concentration, the cell survival rates decreased, and IC50 of EGCG at 72 h on the five ERα36 (+) cell lines were 73.761, 50.807 65.295, 68.376 and 83.818 µg/mL respectively, mainly negatively correlated to the expression level of ERα36 (Table 1). These results suggested that HCC cells could be inhibited by EGCG, and cells with higher expression of ERα36 were more subject to EGCG. Since Hep3B showed the highest level of ERα36, it was chosen for further study, using L-02 as a control.
Figure 1.
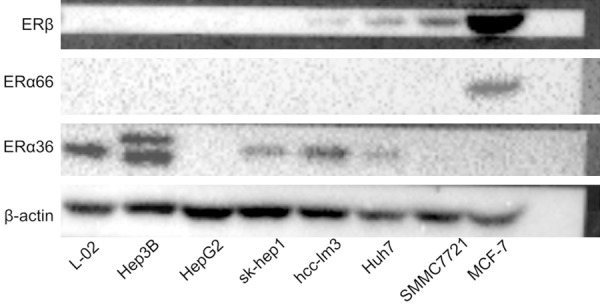
Expression profile of ERs in L-02 (normal liver cell line), Hep3B, HepG2, Sk-hep1, Hcc-lm3, Huh7, SMMC7721 (HCC cell lines) and MCF-7 (breast cancer cell line, chosen as a control-ERα36 (-), ERα66 (+), ERb (+)). HCC: hepatocellular carcinoma, ERα: estrogen receptor alpha, ERβ: estrogen receptor beta.
Table 1.
IC50 of EGCG on ERα36 (+) cells
| Cell line | L-02 | Hep3B | Sk-hep1 | Hcc-lm3 | Huh-7 |
|---|---|---|---|---|---|
| IC50 (µg/mL) | 73.761 | 50.807 | 65.295 | 68.376 | 83.818 |
EGCG inhibits Hep3B xenograft in nude mice in a dose-dependent manner
Hep3B xenograft in nude mice were used to evaluate the inhibitory effect of EGCG on ERα-36 high-expressing human HCC cells in vivo. The growth rate of tumors in tumor-bearing nude mice slowed down as the dose of EGCG increased (Figure 2A). Time needed for tumors to reach a certain volume was also longer in groups with higher doses (Figure 2B). The result of H&E stains showed that EGCG caused tumor necrosis, which was severer and closer to the surface in higher dose groups (Figure 2C).
Figure 2.

Inhibitory effect of different dose of EGCG on Hep3B cells in vivo. A. Growth rate of tumors when mice were treated with 0, 2, 10, 50 mg/kg EGCG. B. Time needed for tumors to reach a certain volume with 0, 2, 10, 50 mg/kg EGCG. C. Hematoxylin and eosin stain results of tumors from tumor-bearing nude mice treated with 0, 2, 10, 50 mg/kg EGCG, Bar = 100 µm. EGCG: epigallocatechin-3-gallate.
EGCG inhibits cell proliferation as well as ERα36 expression
To further prove the effect of EGCG on inhibiting cell proliferation, a cell growth curve was made by CCK-8, and the activation of proliferation signaling pathways was tested by western blot. After treatment of 30 µg/mL EGCG, proliferation of Hep3B was significantly inhibited but that of L-02 was almost the same as the control group. Being treated with 60 µg/mL EGCG, Hep3B was inviable while L-02 was slightly inhibited (Figure 3A). Treated with a serial concentration of EGCG for 48 h, the expression of ERα36 increased slightly at first, and then decreased as the concentration kept rising. EGFR and Her-2 changed with the same tendency, PI3K/Akt and ERK was inhibited at the same time. The lowest concentration of EGCG causing inhibition in L-02 cells (almost 80 µg/mL) was higher than in Hep3B (almost 20 µg/mL). Interestingly, phosphorylated ERK (p-ERK) expression was upregulated significantly in Hep3B treated with 20 and 40 µg/mL EGCG respectively (Figure 3B). Shown as the results of western blot analysis at different time points after treatment, the expression of ERα36, EGFR, and Her-2 increased in a time-dependent manner in L-02 cells, but almost kept decreasing in Hep3B. The expression of p-ERK was temporarily decreased in Hep3B treated with 30 µg/mL EGCG for 12 h, and in L-02 treated with 60 µg/mL EGCG for 12-36 h. Whereas, it surged in Hep3B treated with 60 µg/mL EGCG for 12-36 h, as did phosphorylated Akt (p-Akt) (Figure 3C).
Figure 3.
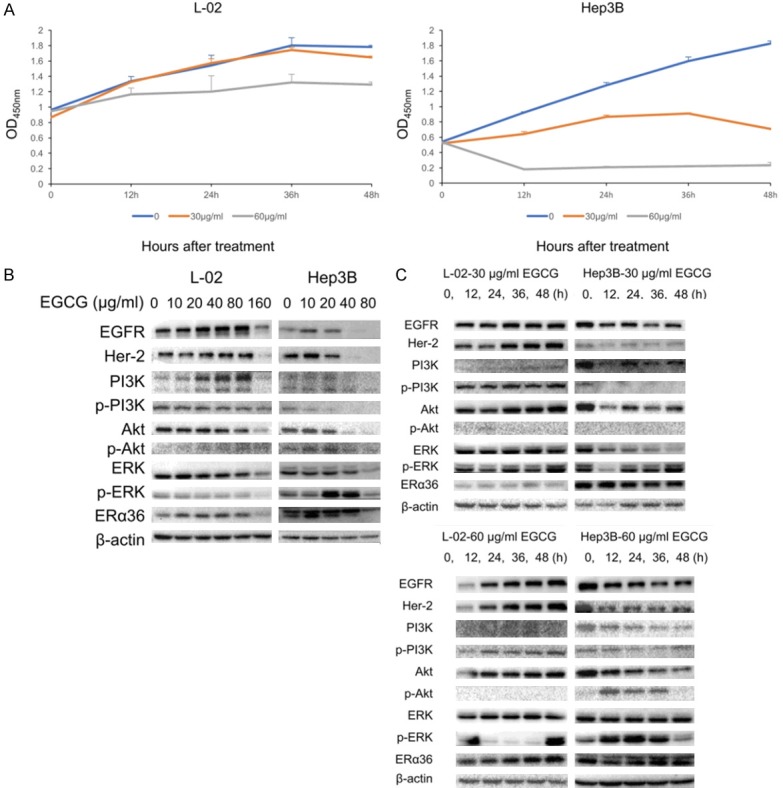
Anti-proliferative effect of EGCG on L-02 and Hep3B cells. A. Cell growth curve of L-02 and Hep3B with/without the treatment of EGCG (30, 60 µg/mL). B. Proliferation relevant proteins expression in L-02 and Hep3B cells treated with 0, 10, 20, 40, 80, 160 µg/mL EGCG for 48 h. C. Proliferation-relevant proteins expression in L-02 and Hep3B cells treated with 30, 60 µg/mL EGCG for 0, 12, 24, 36, 48 h. p-PI3K: phosphorylated PI3K, p-Akt: phosphorylated Akt, p-ERK: phosphorylated ERK.
In summary, compared with L-02 cells, ERα36 highly-expressing Hep3B was greatly inhibited by a lower concentration of EGCG by inhibiting the ERα36-EGFR-Her-2 feedback loop as well as PI3K/Akt, and MAPK/ERK pathways. The alteration of p-ERK caused by EGCG will be discussed later.
EGCG also induces cell apoptosis when it inhibits ERα36 expression
To find out whether EGCG promoted cell apoptosis during the anti-HCC process, cell apoptosis analysis and western blot analysis were performed.
According to cell flow cytometry analysis, Hep-3B showed an increasing apoptosis from 4.1% to 5.0% or 16.3% by treatment with 30 or 60 µg/mL EGCG, while L-02 kept stable as 1.1%, 0.9% and 1.1% (Figure 4A; Table 2). With a decrease in ERα36, caspase 3 was activated in Hep3B by 20 µg/mL EGCG (while in L-02 by 160 µg/mL EGCG) and its activation became greater with higher dose of EGCG. 12 h after treatment, the activation of caspase 3 in Hep3B had already been detectable (Figure 4B, 4C). These data indicated that besides inhibition of proliferation, cell apoptosis promotion also played a role in the anti-HCC effect of EGCG resulting from ERα36 being inhibited.
Figure 4.
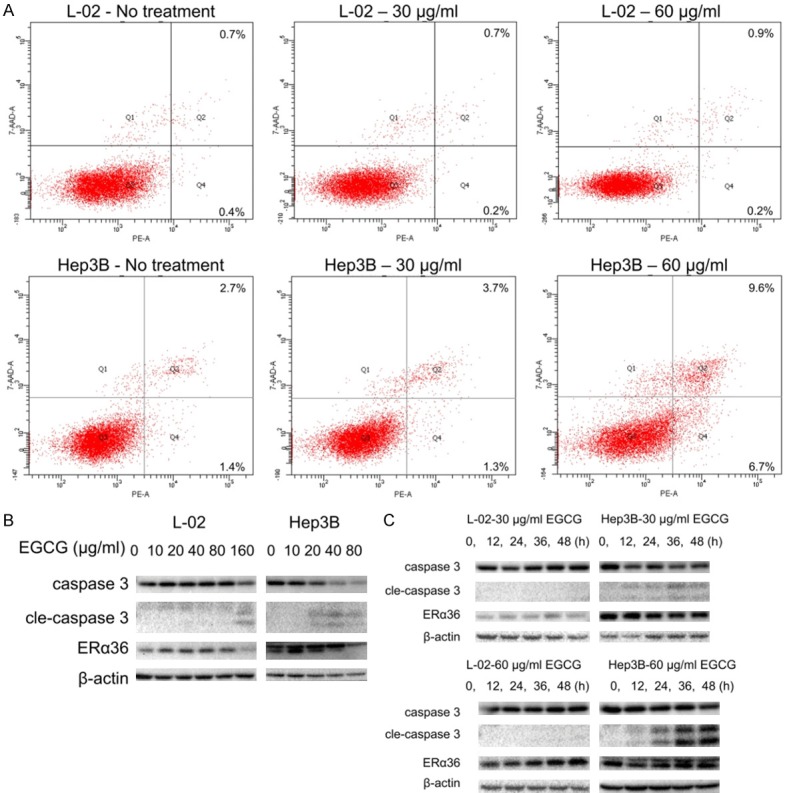
Pro-apoptotic effect of EGCG on Hep3B cells. A. Apoptosis analysis of L-02 and Hep3B with/without the treatment of EGCG (30, 60 µg/mL). B. Activation of caspase 3 in L-02 and Hep3B cells treated with 0, 10, 20, 40, 80, 160 µg/mL EGCG for 48 h. C. Activation of caspase 3 in L-02 and Hep3B cells treated with 30, 60 µg/mL EGCG for 0, 12, 24, 36, 48 h. cle-caspase 3: cleaved-caspase 3.
Table 2.
Apoptosis of L-02 and Hep3B cells treated with EGCG
| Cell line | EGCG (µg/mL) | Early apoptotic cells (%) | Late apoptotic cells (%) | Total apoptotic cells (%) |
|---|---|---|---|---|
| L-02 | 0 | 0.4 | 0.7 | 1.1 |
| 30 | 0.2 | 0.7 | 0.9 | |
| 60 | 0.2 | 0.9 | 1.1 | |
| Hep3B | 0 | 1.4 | 2.7 | 4.1 |
| 30 | 1.3 | 3.7 | 5.0 | |
| 60 | 6.7 | 9.6 | 16.3 |
ERα36 is an effective target of EGCG in Hep3B inhibition
To further study the mechanisms, the expression and localization of ERα36 and p-ERK were examined. The result of western blot analysis of cell fractions showed that ERα36 was mainly distributed in the cytoplasm, with very low levels in the nucleus, both in untreated and treated Hep3B cells. Moreover, p-ERK decreased significantly in nuclear fractions, but increased in cytoplasmic fraction in Hep3B cells treated by EGCG for 24 h compared with that in untreated cells. Therefore, the increase of p-ERK in Hep3B cells treated with EGCG was mainly attributed to the increase in cytosolic p-ERK. However, p-ERK decreased slightly in all fractions in L-02 after treatment (Figure 5A). These findings were consistent with the previous results of western blot analysis (Figure 3B, 3C). By cell immunofluorescence, strong fluorescent signal was detected in the cytoplasm of Hep3B compared with negative controls which was not probed with anti-ERα36 antibody, and several dense clusters could be seen in cytoplasm. The signal was dramatically weakened with the dense clusters dispersing after the treatment by 30 or 60 µg/mL EGCG for 24 h (Figure 5B). These results suggested that ERα36 located mainly in cytoplasm as a member of the non-genomic pathway, and its expression in cytoplasm was significantly lowered by EGCG without subcellular redistribution. EGCG could increase cytosolic p-ERK in ERα36 high-expressing cells, which might promote cell apoptosis. The decrease of p-ERK in the nucleus in both Hep3B and L-02 might contribute to the inhibition of cell proliferation. According to the result of the anti-HCC effect of EGCG with ERα36 pre-activated by estrogen, the proliferation of Hep3B and L-02 treated with various concentration of estrogen alone showed no difference (Figure 6A). Hep3B cells in group C, which were pretreated with 30 µg/mL EGCG, showed significantly lower survival than group A, while cells in group B and D showed lower survival rates than group A, but showed higher survival than group C. In L-02, cell survival of the four groups were almost the same (Figure 6B). In summary, EGCG exerted its inhibition effect by targeting ERα36 directly or indirectly, but there were other ways for EGCG to inhibit HCC cells.
Figure 5.
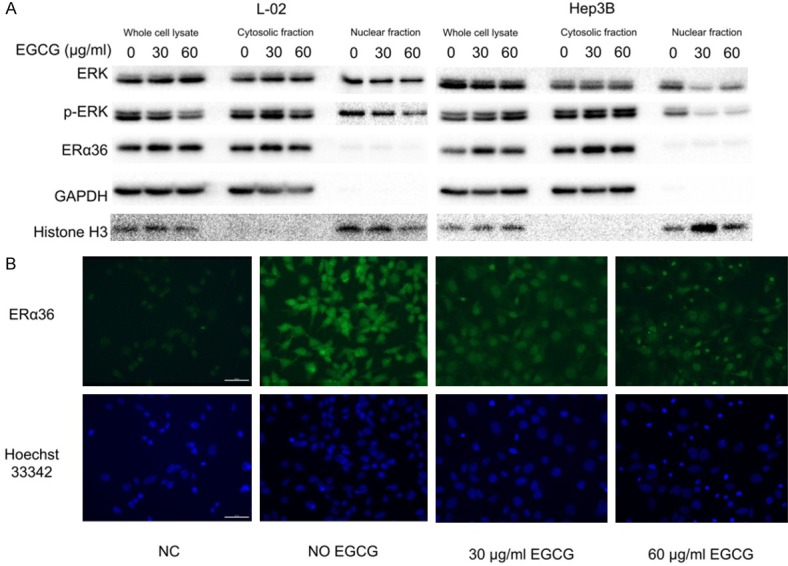
Alteration of ERα36, ERK and p-ERK in different cell compartments. A. Cellular localization and expression of ERα36 and the activation of ERK in L-02 and Hep3B with/without EGCG (30, 60 µg/mL) for 24 h analyzed by western blot. B. Cellular localization and expression of ERα36 in Hep3B with/without EGCG (30, 60 µg/mL) for 24 h analyzed by cell immunofluorescence, Bar = 50 µm. p-ERK: phosphorylated ERK, NC: negative control.
Figure 6.
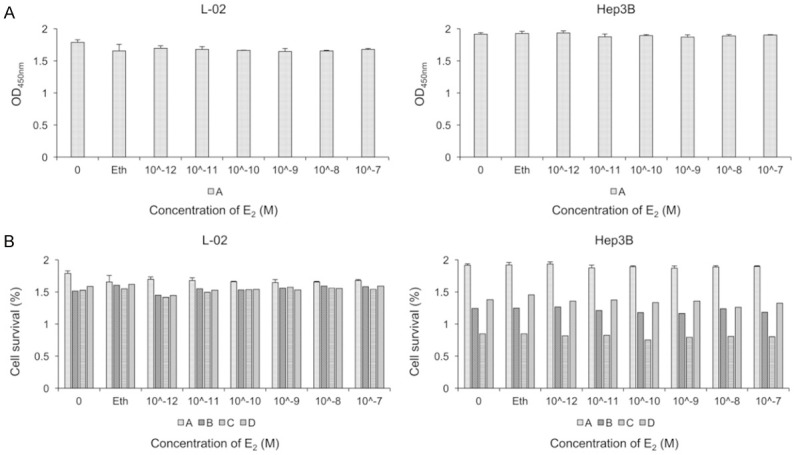
Inhibitory effect of EGCG on L-02 and Hep3B cells with ERα36 pre-activated. A. The effect of estrogen in serial concentrations on cell proliferation. B. Cell survival rates of L-02 and Hep3B with different treatment. Group A: cells were treated with hormone-free medium containing vehicle (0.01% ethanol) or 10-7, 10-8, 10-9, 10-10, 10-11, 10-12 M E2 for 48 h. Group B: cells were pretreated with E2 at the same concentration gradients as group A for 1 h, and then treated with E2 along with 30 µg/mL EGCG for another 47 h. Group C: cells were pretreated with 30 µg/mL EGCG alone for 1 h, followed with E2 at the same concentration gradient as group A along with 30 µg/mL EGCG for another 47 h. Group D: cells were treated with E2 at the same concentration gradient as group A along with 30 µg/mL EGCG for 48 h. Eth: ethanol, E2: estrogen.
Discussion
Based on the ERs expression profile in our work, ERα36 is the dominant ER in HCC cells. This finding is consistent with the reported analysis of total 84 HCC patients [6,9]. However, according to our results, the expression level of ERα36 in HCC cells is not always higher than that in normal hepatocytes, but higher ERα36 expression does indicate higher sensitivity to EGCG. Accumulating evidence suggests that EGCG could inhibit HCC cells effectively, but to the best of our knowledge, this study provides the first evidence that ERα36 could be a biomarker of HCC cells that are responsive to EGCG therapy.
It has been reported that severe side effects could be caused by EGCG overdose [23]. LD50 of EGCG on nude mice was tested to be 107.2 mg/kg by acute toxicity test, and no abnormality was observed in the group of mice treated with 79.4 mg/kg EGCG (data not shown). Moreover, the morphologic structure of livers from mice treated with 100 mg/kg and 159 mg/kg EGCG were examined by H&E stain, the livers of 100 mg/kg group were almost normal, but those of the 159 mg/kg group were greatly damaged (data not shown). Therefore, 50 mg/kg EGCG was set to be the highest dosage in vivo. To better reflect clinical reality, tumor volume was used as a standard of starting (200 mm3) and ending (2500 mm3) treatment.
Anti-cancer effect could be achieved by both inhibiting cell proliferation and promoting cell apoptosis, and evidence suggested involvement of both. EGCG demonstrated greater inhibitory effect on cells with higher ERα36, whose expression was significantly inhibited with the treatment of EGCG, as was the, ERα36-EGFR-Her-2 feedback loop (which was reported to promote malignant growth of breast cancer cells and develop resistance to tamoxifen) [24,25]. PI3K/Akt and MAPK/ERK signaling pathways were blocked. These changes are consistent with the reports about the inhibitory effect of EGCG on various kinds of cancer cells [17,22,26,27]. However, EGCG seems to increase the expression of these signaling molecules when the concentration is lower than 80 µg/mL in L-02 or 10 µg/mL in Hep3B. This might be due to the stress response or protective effect caused by EGCG, since EGCG is a natural product with multiple biological functions, such as antioxidant, anti-inflammatory, anticollagenase, antifibrosis, oral disease treatment, vascular system protection, and nervous system protection [10], The mechanisms are complicated but deserve further study.
ERα36, different structurally and functionally from its traditional counterpart, ERα66, is reported expressed mainly on the cell membrane and cytoplasm instead of the nucleus. The different cellular orientation from nuclear receptors suggested that ERα36 exerts its function by a non-genomic pathway [5,28-31], which was verified in our study by western blot analysis of cell fractions and cell immunofluorescent stain.
Activation of ERK is believed to be relevant to cell proliferation, but our study, suggested that the activation of ERK might be involved in cell death. Actually, several studies have reported that sustained activation of ERK, presented as continuous high expression of p-ERK, might induce cell aging or apoptosis [32-34]. Moreover,the subcellular location of p-ERK also determine its function. Transport of p-ERK from cytoplasm to the nucleus could promote cell proliferation and inhibit differentiation. On the contrary, the accumulation of p-ERK in cytoplasm would inhibit proliferation and trigger differentiation [32]. We infer that transient activation of ERK (within a few minutes) promoted cell proliferation, but the sustained activation in cytoplasm (last hours or longer) might induce oxidative stress and apoptosis, and the decrease of p-ERK in the nucleus of treated L-02 and Hep3B might contribute to proliferation inhibition.
Moreover, according to research about EGCG in neurological disease, EGCG exerts its protective effect by preventing the aggregation of pathogenic proteins [35]. Therefore, the disaggregation of ERα36 in cell cytoplasm (shown as cell immunofluorescent stain) might also be a part of the anti-cancer process, which is worth further investigation.
Estrogen is considered to be the most common ligand of ERs It could definitely activate ERα36, and the activated ERα36 would be unavailable momentarily for EGCG. By examining whether the anti-HCC effect of EGCG would be affected with ERα36 pre-activated, a role of ERα36 in the anti-HCC process could be partially demonstrated. Shown as the result, activating ERα36 by estrogen could greatly alleviate the inhibition effect of EGCG in Hep3B cells. This suggested that ERα36 was one of the direct or indirect targets of EGCG in the anti-HCC process. As EGCG still inhibited cell proliferation to a lesser degree when ERα36 was pre-activated (survival rates of group B and D were still lower than group A), there must be other ways for EGCG to exert its anti-cancer effect.
Although EGCG showed significant inhibition effect on Hep3B cells both in vitro and in vivo, the dosage we used in vivo was not sufficient to arrest cancer progression. Considering the risk of liver toxicity caused by high doses of EGCG, it would be more advisable to focus on EGCG’s effect on cancer prevention, or use EGCG as a synergist of chemotherapeutics as it could prevent the development of chemoresistance, or alleviate side effects by reducing chemical dose and amplify the anti-cancer effect [13,20,23,36-39]. It has also been suggested that the inconsistency between the effect of EGCG in vitro and in vivo could be attribute to its low stability. It is difficult to tell whether the derivatives or degradation products of EGCG contribute to the manifested effect, and it is also challenging to sort out the overall effect of these molecules [23,40]. There have been many studies aiming to promote the stability of EGCG by modification and packaging [41-48], to remove this main restriction (short half-life) in EGCG’s clinical application.
Conclusions
ERα36 predominated ERs in HCC cells and served as a biomarker of responsiveness to EGCG inhibition. EGCG could both inhibit cell proliferation and induce cell apoptosis in a dose-dependent manner by inhibiting ERα36, which then induces the blocking of ERα36-EGFR-Her-2 loop, PI3K/Akt, MAPK/ERK pathways, the activation of caspase-3, and the accumulation of cytosolic p-ERK (Figure 7).
Figure 7.
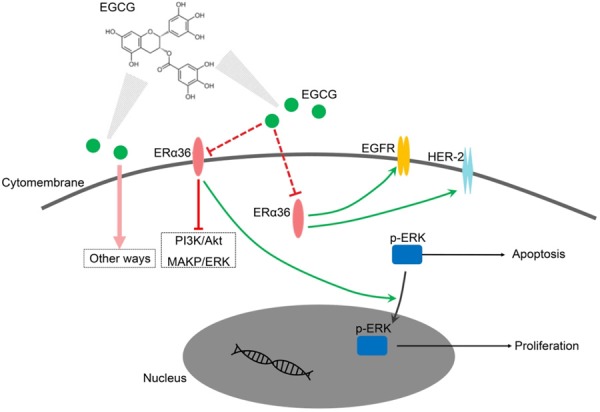
Illustration of anti-cancer effect of EGCG by targeting ERα36. EGCG could inhibit ERα36 directly or indirectly. Down-regulation of ERα36 would block the ERα36-EGFR-Her-2 feedback loop, PI3K/Akt, and MAPK/ERK pathways. Moreover, the inhibition of ERα36 might block the transport of p-ERK from cytoplasm to nucleus. The distribution of p-ERK in this pattern would induce apoptosis and inhibit cell proliferation.
Acknowledgements
We thank Sicong Chen, Xiaoxing Wu, Jiayu Yang, Yongping Xin and Jiabin Lin for their technical assistance. This work was supported by National Natural Science Foundation of China (No. 81172516).
Disclosure of conflict of interest
None.
References
- 1.Su X, Xu X, Li G, Lin B, Cao J, Teng L. ER-alpha36: a novel biomarker and potential therapeutic target in breast cancer. Onco Targets Ther. 2014;7:1525–1533. doi: 10.2147/OTT.S65345. [DOI] [PMC free article] [PubMed] [Google Scholar]
- 2.Zhang J, Li G, Li Z, Yu X, Zheng Y, Jin K, Wang H, Gong Y, Sun X, Teng X, Cao J, Teng L. Estrogen-independent effects of ER-alpha36 in ER-negative breast cancer. Steroids. 2012;77:666–673. doi: 10.1016/j.steroids.2012.02.013. [DOI] [PubMed] [Google Scholar]
- 3.Li G, Zhang J, Jin K, He K, Zheng Y, Xu X, Wang H, Wang H, Li Z, Yu X, Teng X, Cao J, Teng L. Estrogen receptor-alpha36 is involved in development of acquired tamoxifen resistance via regulating the growth status switch in breast cancer cells. Mol Oncol. 2013;7:611–624. doi: 10.1016/j.molonc.2013.02.001. [DOI] [PMC free article] [PubMed] [Google Scholar]
- 4.Schwartz N, Chaudhri RA, Hadadi A, Schwartz Z, Boyan BD. 17Beta-estradiol promotes aggressive laryngeal cancer through membrane-associated estrogen receptor-alpha 36. Horm Cancer. 2014;5:22–32. doi: 10.1007/s12672-013-0161-y. [DOI] [PMC free article] [PubMed] [Google Scholar]
- 5.Wang Q, Zhang W, Yang J, Liu YL, Yan ZX, Guo ZJ, Li YJ, Bian XW. High ERalpha36 expression level and membrane location predict poor prognosis in renal cell carcinoma. Medicine (Baltimore) 2015;94:e1048. doi: 10.1097/MD.0000000000001048. [DOI] [PMC free article] [PubMed] [Google Scholar]
- 6.Miceli V, Cocciadiferro L, Fregapane M, Zarcone M, Montalto G, Polito LM, Agostara B, Granata OM, Carruba G. Expression of wild-type and variant estrogen receptor alpha in liver carcinogenesis and tumor progression. OMICS. 2011;15:313–317. doi: 10.1089/omi.2010.0108. [DOI] [PubMed] [Google Scholar]
- 7.Cocciadiferro L, Miceli V, Granata OM, Carruba G. Merlin, the product of NF2 gene, is associated with aromatase expression and estrogen formation in human liver tissues and liver cancer cells. J Steroid Biochem Mol Biol. 2017;172:222–230. doi: 10.1016/j.jsbmb.2016.05.023. [DOI] [PubMed] [Google Scholar]
- 8.Shi L, Feng Y, Lin H, Ma R, Cai X. Role of estrogen in hepatocellular carcinoma: is inflammation the key? J Transl Med. 2014;12:93. doi: 10.1186/1479-5876-12-93. [DOI] [PMC free article] [PubMed] [Google Scholar]
- 9.Zhang J, Ren J, Wei J, Chong CC, Yang D, He Y, Chen GG, Lai PB. Alternative splicing of estrogen receptor alpha in hepatocellular carcinoma. BMC Cancer. 2016;16:926. doi: 10.1186/s12885-016-2928-3. [DOI] [PMC free article] [PubMed] [Google Scholar]
- 10.Chu C, Deng J, Man Y, Qu Y. Green tea extracts epigallocatechin-3-gallate for different treatments. Biomed Res Int. 2017;2017:5615647. doi: 10.1155/2017/5615647. [DOI] [PMC free article] [PubMed] [Google Scholar]
- 11.Roychoudhury S, Agarwal A, Virk G, Cho CL. Potential role of green tea catechins in the management of oxidative stress-associated infertility. Reprod Biomed Online. 2017;34:487–498. doi: 10.1016/j.rbmo.2017.02.006. [DOI] [PubMed] [Google Scholar]
- 12.Chowdhury A, Sarkar J, Chakraborti T, Pramanik PK, Chakraborti S. Protective role of epigallocatechin-3-gallate in health and disease: a perspective. Biomed Pharmacother. 2016;78:50–59. doi: 10.1016/j.biopha.2015.12.013. [DOI] [PubMed] [Google Scholar]
- 13.Lecumberri E, Dupertuis YM, Miralbell R, Pichard C. Green tea polyphenol epigallocatechin-3-gallate (EGCG) as adjuvant in cancer therapy. Clin Nutr. 2013;32:894–903. doi: 10.1016/j.clnu.2013.03.008. [DOI] [PubMed] [Google Scholar]
- 14.Jin J, Chang Y, Wei W, He YF, Hu SS, Wang D, Wu YJ. Prostanoid EP1 receptor as the target of (-)-epigallocatechin-3-gallate in suppressing hepatocellular carcinoma cells in vitro. Acta Pharmacol Sin. 2012;33:701–709. doi: 10.1038/aps.2012.13. [DOI] [PMC free article] [PubMed] [Google Scholar]
- 15.Wubetu GY, Shimada M, Morine Y, Ikemoto T, Ishikawa D, Iwahashi S, Yamada S, Saito Y, Arakawa Y, Imura S. Epigallocatechin gallate hinders human hepatoma and colon cancer sphere formation. J Gastroenterol Hepatol. 2016;31:256–264. doi: 10.1111/jgh.13069. [DOI] [PubMed] [Google Scholar]
- 16.Zhang Y, Duan W, Owusu L, Wu D, Xin Y. Epigallocatechin-3-gallate induces the apoptosis of hepatocellular carcinoma LM6 cells but not non-cancerous liver cells. Int J Mol Med. 2015;35:117–124. doi: 10.3892/ijmm.2014.1988. [DOI] [PubMed] [Google Scholar]
- 17.Shen X, Zhang Y, Feng Y, Zhang L, Li J, Xie YA, Luo X. Epigallocatechin-3-gallate inhibits cell growth, induces apoptosis and causes S phase arrest in hepatocellular carcinoma by suppressing the AKT pathway. Int J Oncol. 2014;44:791–796. doi: 10.3892/ijo.2014.2251. [DOI] [PubMed] [Google Scholar]
- 18.Li S, Wu L, Feng J, Li J, Liu T, Zhang R, Xu S, Cheng K, Zhou Y, Zhou S, Kong R, Chen K, Wang F, Xia Y, Lu J, Zhou Y, Dai W, Guo C. In vitro and in vivo study of epigallocatechin-3-gallate-induced apoptosis in aerobic glycolytic hepatocellular carcinoma cells involving inhibition of phosphofructokinase activity. Sci Rep. 2016;6:28479. doi: 10.1038/srep28479. [DOI] [PMC free article] [PubMed] [Google Scholar]
- 19.Zhang Y, Owusu L, Duan W, Jiang T, Zang S, Ahmed A, Xin Y. Anti-metastatic and differential effects on protein expression of epigallocatechin-3-gallate in HCCLM6 hepatocellular carcinoma cells. Int J Mol Med. 2013;32:959–964. doi: 10.3892/ijmm.2013.1446. [DOI] [PubMed] [Google Scholar]
- 20.Satonaka H, Ishida K, Takai M, Koide R, Shigemasa R, Ueyama J, Ishikawa T, Hayashi K, Goto H, Wakusawa S. (-)-Epigallocatechin-3-gallate down-regulates doxorubicin-induced overexpression of P-glycoprotein through the coordinate inhibition of PI3K/Akt and MEK/ERK signaling pathways. Anticancer Res. 2017;37:6071–6077. doi: 10.21873/anticanres.12055. [DOI] [PubMed] [Google Scholar]
- 21.Baker KM, Bauer AC. Green tea catechin, EGCG, suppresses PCB 102-induced proliferation in estrogen-sensitive breast cancer cells. Int J Breast Cancer. 2015;2015:163591. doi: 10.1155/2015/163591. [DOI] [PMC free article] [PubMed] [Google Scholar]
- 22.Pan X, Zhao B, Song Z, Han S, Wang M. Estrogen receptor-alpha36 is involved in epigallocatechin-3-gallate induced growth inhibition of ER-negative breast cancer stem/progenitor cells. J Pharmacol Sci. 2016;130:85–93. doi: 10.1016/j.jphs.2015.12.003. [DOI] [PubMed] [Google Scholar]
- 23.Eisenstein M. Tea’s value as a cancer therapy is steeped in uncertainty. Nature. 2019;566:S6–S7. doi: 10.1038/d41586-019-00397-2. [DOI] [PubMed] [Google Scholar]
- 24.Zhang XT, Kang LG, Ding L, Vranic S, Gatalica Z, Wang ZY. A positive feedback loop of ER-alpha36/EGFR promotes malignant growth of ER-negative breast cancer cells. Oncogene. 2011;30:770–780. doi: 10.1038/onc.2010.458. [DOI] [PMC free article] [PubMed] [Google Scholar]
- 25.Yin L, Zhang XT, Bian XW, Guo YM, Wang ZY. Disruption of the ER-alpha36-EGFR/HER2 positive regulatory loops restores tamoxifen sensitivity in tamoxifen resistance breast cancer cells. PLoS One. 2014;9:e107369. doi: 10.1371/journal.pone.0107369. [DOI] [PMC free article] [PubMed] [Google Scholar]
- 26.Pianetti S, Guo S, Kavanagh KT, Sonenshein GE. Green tea polyphenol epigallocatechin-3 gallate inhibits Her-2/neu signaling, proliferation, and transformed phenotype of breast cancer cells. Cancer Res. 2002;62:652–655. [PubMed] [Google Scholar]
- 27.De Amicis F, Russo A, Avena P, Santoro M, Vivacqua A, Bonofiglio D, Mauro L, Aquila S, Tramontano D, Fuqua SA, Ando S. In vitro mechanism for downregulation of ER-alpha expression by epigallocatechin gallate in ER+/PR+ human breast cancer cells. Mol Nutr Food Res. 2013;57:840–853. doi: 10.1002/mnfr.201200560. [DOI] [PMC free article] [PubMed] [Google Scholar]
- 28.Wang ZY, Yin L. Estrogen receptor alpha-36 (ER-alpha36): a new player in human breast cancer. Mol Cell Endocrinol. 2015;418 Pt 3:193–206. doi: 10.1016/j.mce.2015.04.017. [DOI] [PubMed] [Google Scholar]
- 29.Chaudhri RA, Olivares-Navarrete R, Cuenca N, Hadadi A, Boyan BD, Schwartz Z. Membrane estrogen signaling enhances tumorigenesis and metastatic potential of breast cancer cells via estrogen receptor-alpha36 (ERalpha36) J Biol Chem. 2012;287:7169–7181. doi: 10.1074/jbc.M111.292946. [DOI] [PMC free article] [PubMed] [Google Scholar]
- 30.Omarjee S, Jacquemetton J, Poulard C, Rochel N, Dejaegere A, Chebaro Y, Treilleux I, Marangoni E, Corbo L, Romancer ML. The molecular mechanisms underlying the ERalpha-36-mediated signaling in breast cancer. Oncogene. 2017;36:2503–2514. doi: 10.1038/onc.2016.415. [DOI] [PMC free article] [PubMed] [Google Scholar]
- 31.Li L, Wang Q, Lv X, Sha L, Qin H, Wang L, Li L. Expression and localization of estrogen receptor in human breast cancer and its clinical significance. Cell Biochem Biophys. 2015;71:63–68. doi: 10.1007/s12013-014-0163-6. [DOI] [PubMed] [Google Scholar]
- 32.Martin P, Pognonec P. ERK and cell death: cadmium toxicity, sustained ERK activation and cell death. FEBS J. 2010;277:39–46. doi: 10.1111/j.1742-4658.2009.07369.x. [DOI] [PubMed] [Google Scholar]
- 33.Ye YC, Wang HJ, Xu L, Liu WW, Liu BB, Tashiro S, Onodera S, Ikejima T. Oridonin induces apoptosis and autophagy in murine fibrosarcoma L929 cells partly via NO-ERK-p53 positive-feedback loop signaling pathway. Acta Pharmacol Sin. 2012;33:1055–1061. doi: 10.1038/aps.2012.53. [DOI] [PMC free article] [PubMed] [Google Scholar]
- 34.Li P, Zhou X, Sun W, Sheng W, Tu Y, Yu Y, Dong J, Ye B, Zheng Z, Lu M. Elemene induces apoptosis of human gastric cancer cell line BGC-823 via extracellular signal-regulated kinase (ERK) 1/2 signaling pathway. Med Sci Monit. 2017;23:809–817. doi: 10.12659/MSM.903197. [DOI] [PMC free article] [PubMed] [Google Scholar]
- 35.Wobst HJ, Sharma A, Diamond MI, Wanker EE, Bieschke J. The green tea polyphenol (-)-epigallocatechin gallate prevents the aggregation of tau protein into toxic oligomers at substoichiometric ratios. FEBS Lett. 2015;589:77–83. doi: 10.1016/j.febslet.2014.11.026. [DOI] [PMC free article] [PubMed] [Google Scholar]
- 36.Farabegoli F, Papi A, Orlandi M. (-)-Epigallocatechin-3-gallate down-regulates EGFR, MMP-2, MMP-9 and EMMPRIN and inhibits the invasion of MCF-7 tamoxifen-resistant cells. Biosci Rep. 2011;31:99–108. doi: 10.1042/BSR20090143. [DOI] [PubMed] [Google Scholar]
- 37.Chen L, Ye HL, Zhang G, Yao WM, Chen XZ, Zhang FC, Liang G. Autophagy inhibition contributes to the synergistic interaction between EGCG and doxorubicin to kill the hepatoma Hep3B cells. PLoS One. 2014;9:e85771. doi: 10.1371/journal.pone.0085771. [DOI] [PMC free article] [PubMed] [Google Scholar]
- 38.Flores-Perez A, Marchat LA, Sanchez LL, Romero-Zamora D, Arechaga-Ocampo E, Ramirez-Torres N, Chavez JD, Carlos-Reyes A, Astudillo-de la Vega H, Ruiz-Garcia E, Gonzalez-Perez A, Lopez-Camarillo C. Differential proteomic analysis reveals that EGCG inhibits HDGF and activates apoptosis to increase the sensitivity of non-small cells lung cancer to chemotherapy. Proteomics Clin Appl. 2016;10:172–182. doi: 10.1002/prca.201500008. [DOI] [PubMed] [Google Scholar]
- 39.Cromie MM, Gao W. Epigallocatechin-3-gallate enhances the therapeutic effects of leptomycin B on human lung cancer a549 cells. Oxid Med Cell Longev. 2015;2015:217304. doi: 10.1155/2015/217304. [DOI] [PMC free article] [PubMed] [Google Scholar]
- 40.Krupkova O, Ferguson SJ, Wuertz-Kozak K. Stability of (-)-epigallocatechin gallate and its activity in liquid formulations and delivery systems. J Nutr Biochem. 2016;37:1–12. doi: 10.1016/j.jnutbio.2016.01.002. [DOI] [PubMed] [Google Scholar]
- 41.Ning W, Wang S, Liu D, Fu L, Jin R, Xu A. Potent effects of peracetylated (-)-epigallocatechin-3-gallate against hydrogen peroxide-induced damage in human epidermal melanocytes via attenuation of oxidative stress and apoptosis. Clin Exp Dermatol. 2016;41:616–624. doi: 10.1111/ced.12855. [DOI] [PubMed] [Google Scholar]
- 42.Wu YR, Choi HJ, Kang YG, Kim JK, Shin JW. In vitro study on anti-inflammatory effects of epigallocatechin-3-gallate-loaded nano- and microscale particles. Int J Nanomedicine. 2017;12:7007–7013. doi: 10.2147/IJN.S146296. [DOI] [PMC free article] [PubMed] [Google Scholar]
- 43.Rashidinejad A, Birch EJ, Sun-Waterhouse D, Everett DW. Delivery of green tea catechin and epigallocatechin gallate in liposomes incorporated into low-fat hard cheese. Food Chem. 2014;156:176–183. doi: 10.1016/j.foodchem.2014.01.115. [DOI] [PubMed] [Google Scholar]
- 44.Zinellu A, Sotgia S, Scanu B, Forteschi M, Giordo R, Cossu A, Posadino AM, Carru C, Pintus G. Human serum albumin increases the stability of green tea catechins in aqueous physiological conditions. PLoS One. 2015;10:e0134690. doi: 10.1371/journal.pone.0134690. [DOI] [PMC free article] [PubMed] [Google Scholar]
- 45.Fangueiro JF, Andreani T, Fernandes L, Garcia ML, Egea MA, Silva AM, Souto EB. Physicochemical characterization of epigallocatechin gallate lipid nanoparticles (EGCG-LNs) for ocular instillation. Colloids Surf B Biointerfaces. 2014;123:452–460. doi: 10.1016/j.colsurfb.2014.09.042. [DOI] [PubMed] [Google Scholar]
- 46.Hu B, Ting Y, Zeng X, Huang Q. Bioactive peptides/chitosan nanoparticles enhance cellular antioxidant activity of (-)-epigallocatechin-3-gallate. J Agric Food Chem. 2013;61:875–881. doi: 10.1021/jf304821k. [DOI] [PubMed] [Google Scholar]
- 47.Dube A, Nicolazzo JA, Larson I. Chitosan nanoparticles enhance the intestinal absorption of the green tea catechins (+)-catechin and (-)-epigallocatechin gallate. Eur J Pharm Sci. 2010;41:219–225. doi: 10.1016/j.ejps.2010.06.010. [DOI] [PubMed] [Google Scholar]
- 48.Hong Z, Xu Y, Yin JF, Jin J, Jiang Y, Du Q. Improving the effectiveness of (-)-epigallocatechin gallate (EGCG) against rabbit atherosclerosis by EGCG-loaded nanoparticles prepared from chitosan and polyaspartic acid. J Agric Food Chem. 2014;62:12603–12609. doi: 10.1021/jf504603n. [DOI] [PubMed] [Google Scholar]