Abstract
Objective: This study aimed to verify the hypothesis that downregulation of miR-601 inhibits the proliferation, migration, and invasion of prostate cancer stem cells (PCSCs) by the Wnt signaling pathway through targeting keratin 5 (KRT5). Methods: Bioinformatic tools were applied to predict miRNAs and genes potentially associated with prostate cancer, then miR-601 and KRT5 were selected. Subsequently, PCSCs were investigated with respect to miR-601 overexpression or inhibition, KRT5 overexpression, or treatment with a Wnt pathway inhibitor. A series of experiments including western blotting, RT-qPCR, wound healing experiment, transwell assay, MTT assay, annexin V-FITC/PI flow cytometric analysis, nude mice assay and immunohistochemistry were then carried out. Results: Compared with negative control group, migration, invasion, and proliferation of PCSCs and Wnt-1 expression were all enhanced, but apoptosis was attenuated in the miR-601 mimic group. Furthermore, results identified in the other groups (KRT5, miR-601 inhibitor, miR-601 inhibitor + KRT5, Wnt signaling pathway inhibitor, PRI-724/PRI-724 + KRT5) were opposite to those identified with the miR-601 mimic group (all P<0.05). Compared with the miR-601 inhibitor + KRT5 group, migration, invasion, and proliferation of PCSCs and Wnt-1 expression were all increased, whereas apoptosis was suppressed in KRT5 or miR-601 inhibitor groups (all P<0.05). Compared with the PRI-724 + KRT5 group, migration, invasion, and proliferation of PCSCs and Wnt-1 expression were also enhanced, whereas apoptosis was inhibited in PRI-724 or KRT5 groups (all P<0.05). Conclusion: Results obtained from the present study have demonstrated that downregulation of miR-601 is able to inhibit the proliferation, migration, and invasion of PCSCs by activating KRT5, and subsequently inhibiting the Wnt pathway.
Keywords: MicroRNA-601, keratin 5, prostate cancer, proliferation, migration, invasion, Wnt signaling pathway
Introduction
Prostate cancer is one of the most commonly diagnosed cancers in men, which affects the male reproductive system [1,2]. Prostate cancer stem cells (PCSCs), which have the ability to self-renew and proliferate infinitely, have been reported to be the main source of prostate cancer [3]. To date, treatments for prostate cancer include resection, radiation therapy, and endocrine therapy [4,5]. However, at present, no effective method is available for treating prostate cancer at an advanced stage. Gene therapy is considered to be one of the most promising treatments that may be utilized in efforts to cure prostate cancer, and this has become the most important component of composite treatments [6,7]. The identification of novel therapeutic targets for more effective treatment of metastatic prostate cancer is urgently needed in order to improve disease management and patient survival.
MicroRNAs (miRNAs; miRs) have been reported to serve regulatory roles in the biologic and pathologic processes of various tumor types, including carcinogenesis, tumor growth, tumor differentiation, and cancer apoptosis [8,9]. A previous study has demonstrated that miRNAs act either as tumor suppressors or as promoters by base-pairing with target genes and altering various signaling pathways associated with the disease under investigation [10]. Previous studies have indicated that miR-601 is involved in pancreatic cancer and colorectal cancer [11-13]. However, few studies to date have confirmed the function of miR-601 in prostate cancer. Keratin 5 (KRT5) is an intermediate filament protein expressed in the basal layer of stratified epithelial cells [14]. Accumulating evidence has indicated that KRT5 expression is downregulated in bladder cancer, and in head-and-neck squamous cell carcinoma [15,16]. Therefore, the present study aimed to verify whether KRT5 is differentially expressed in prostate cancer by using a bioinformatics method, and it was subsequently confirmed that KRT5 is the target gene of miR-601. Wnt signaling pathway is an important molecular pathway that has a vital role in regulating the function of stem cells, and is reported to be an underlying cause of malignant cancers [17]. Therefore, a further aim of the present study was to explore whether miR-601 is able to affect the proliferation, migration, and invasion of PCSCs by regulating KRT5 and the Wnt signaling pathway. Taken together, the results of the present study have revealed that downregulation of miR-601 is able to inhibit the proliferation, migration, and invasion of PCSCs by activating KRT5, and subsequently inhibiting the Wnt pathway.
Materials and methods
Ethic statements
The use of tissues and all experimental procedures were carried out in accordance with the Declaration of Helsinki and approved by the ethics committee of Zhongnan Hospital of Wuhan University. All patients enrolled in the study signed informed consent documentation. All animal experiments took place at Zhongnan Hospital of Wuhan University, were approved by the local animal ethics committee, and followed the instructions of the Guide for Care and Use of Laboratory Animals published by the National Institutes of Health [18].
Bioinformatics prediction
A gene expression chip (GSE46602) of prostate cancer submitted by Aarhus University Hospital was downloaded from the Gene Expression Omnibus (GEO) database (http://www.ncbi.nlm.nih.gov/geo). Gene expression in prostate cancer tissue and the adjacent tissue of 36 cases of patients with prostate cancer was subsequently analyzed. Data normalization and background correction were performed using the Affy package (https://www.bioconductor.org/packages/devel/bioc/html/affy.html) based on the robust multiarray average algorithm [18]. Differentially expressed genes of prostate cancer were identified with R language of the limma package (https://master.bioconductor.org/packages/release/bioc/html/limma.html). Adjusted P-values were presented as adj.P.Val, and |logFC|>2.0 and adj.P.Val<0.01 were considered to represent the cutoffs for differentially expressed genes. The DisGeNET database (https://www.disgenet.org/web/DisGeNET/menu/search?4) was used to identify genes associated with prostate cancer. The potential interactions of the relevant genes were further mapped out using the STRING database (https://string-db.org) [19]. Subsequently, Cytoscape software (version 3.6.0) was adopted to visualize the differentially expressed genes and the disease interaction network. RNA22 (https://cm.jefferson.edu/rna22/), miPATH (http://lgmb.fmrp.usp.br/mirnapath/tools.php) and TargetScanHuman 7.2 (http://www.targetscan.org/vert_72/) were used as tools to predict the putative miRNA-mRNA interactions and the regulation of miRNAs with respect to their target genes. Venny 2.1.0 (http://bioinfogp.cnb.csic.es/tools/venny/index.html) was used to compare the differential genes identified in the chip assay and to construct Venn diagrams [20].
Study subjects
A total of 174 tissue samples (87 for prostate cancer tissue, and 87 for the adjacent tissues, respectively) of patients diagnosed at Zhongnan Hospital of Wuhan University between November 2015 and 2018 were involved in the present study. The mean age of the patients was 68.8 ± 7.75 (range: 36-69 years old). According to the tumor-node-metastasis (TNM) standard published by the American Joint Committee on Cancer (AJCC), 20 cases were confirmed to be at stage I, whereas 67 cases were at stage II. In terms of the degree of differentiation, 22 cases were classed as moderately or well differentiated, whereas 65 cases were poorly differentiated. Fifty-seven patients had lymph node metastasis, while 30 cases were free of any lymph node metastasis. The inclusion criteria were as follows [21]: i) the primary prostate cancer was clinically diagnosed and confirmed by pathologic examination; ii) the patient received no chemotherapy or radiotherapy prior to surgery; iii) the patient had indications for surgical excision and could be treated by resection; iv) the survival time of the patient was >1 year. The exclusion criteria were as follows [22]: i) patients with acute prostatitis, benign prostatic hyperplasia, prostate cancer, neurogenic bladder, urethral deformity or stricture were excluded, as were those with: ii) heart, brain, liver or hematopoietic system disease; iii) mental illness, causing patients not to cooperate with the treatment; and iv) patients with severe complications during or after the operation.
Cell culture
The human prostate cancer cell line, PC-3, purchased from the ATCC (Manassas, VA, USA), was cultured with serum supplemented with RPMI-1640 medium with 5% CO2 at 37°C. When the cell confluence had reached 80%, the cells were treated with 0.25% trypsin, and cells in the exponential growth phase were selected for subsequent experiments.
Preparation and confirmation of PCSCs
The PC-3 cells in the exponential growth phase were resuspended in serumfree medium (SFM), and the cell concentration was adjusted to 1×10³ cells/ml. Subsequently, the cells were seeded in a 100 cm2 plate at a density of 1×10³ cells per plate, and the plate was agitated every day during the incubation to avoid cell attachment. After the cells had grown and formed spheres, they were removed and placed in a centrifuge tube, and almost half the supernatant was discarded 20 min after their placement, followed by addition of an equivalent amount of SFM to separate the cells and form a single cell suspension. The cells were subsequently resuspended in SFM and subcultured at a ratio of 1:2 in an incubator with 5% CO2 at 37°C. An inverted microscope (Olympus CKX31; Olympus Corporation, Tokyo, Japan) was used to observe the cells at 5, 10 and 15 days after seeding. Flow cytometry analysis was subsequently utilized to detect the proportion of the CD133+CD44+ cells in the PC-3 cell spheres and in adherent cells. These two types of cells were resuspended to form a single cell suspension; 2 ml cell suspension (with a concentration of 1×10⁴ cells/ml) was then collected and stained using anti-CD44-FITC (cat. no. ab27285; Abcam, Cambridge, UK) and anti-CD133-PE (cat no. 130-098-826; Beijing Beads Biotechnology Co., Ltd., Beijing, China) antibodies. After incubation on ice in the dark for 30 min and washing with PBS for 3 times, flow cytometry (using a CyFlow Cube6 flow cytometer; Sysmex Partec, Görlitz, Germany) was adopted to measure the apoptotic rate of the CD44+CD133+ cells.
Construction of the KRT5 expression vector
The primer sequence of KRT5 mRNA (accession number: NM_000424.3) was obtained from the nucleotide database of NCBI, and subsequently synthesized by Shanghai Genechem Co., Ltd. (Shanghai, China). The correctly synthesized sequence was cloned into Invitrogen™ plasmid vector pcDNA3.1 (+) (VPI0001; Thermo Fisher Scientific, Inc., Waltham, MA, USA) after HindIII and XhoI digestion and ligation had been performed with T4 ligase at 16°C for 1 h. Subsequently, the ligation products were transferred to DH5α competent cells (d9052; Takara Biotechnology Ltd., Dalian, China), and resistant colonies of the bacteria were selected and identified by reverse transcriptionquantitative polymerase chain reaction (RT-qPCR), as described below. Finally, the plasmids were extracted using a PicoPure® DNA Extraction kit (KIT0103; Thermo Fisher Scientific, Inc.) and stored at -20°C before use.
Dual-luciferase reporter gene assay
MiR-601 target genes were further predicted using the online miRNA prediction tool, Targetscan (http://www.targetscan.org/vert_72/). KRT5 was identified as a potential miR-601 direct target gene, and subsequently a dual-luciferase reporter assay was utilized for experimental validation. The firefly luciferase reporter plasmid containing a KRT5-3’-UTR-wt (or KRT5-3’-UTR-mut) sequence was established, and these were respectively cotransfected along with miR-601 (miR-601 NC) into CHO cells (CC-Y2110; ATCC, USA). Renilla luciferase plasmid served as a control. Fluorescence intensity was measured using a dual-luciferase reporter gene assay kit (GM-040502A; Products, China) under a DFM-20 fluorescence microscope (Cai Kang Optics, China) at 560 nm (for firefly luciferase) or 465 nm (for Renilla luciferase), and the ratio of the firefly luciferase activity value/Renilla luciferase activity value was used to calculate the relative luciferase activity. Luciferase mRNA expression levels were determined using RT-qPCR, as described below. Experiments were repeated 3 times.
Cell grouping and transfection
The PCSCs were divided into the following groups: The negative control group (transfected with empty vector), miR-601 mimic group (transfected with miR-601 mimic), miR-601 inhibitor group (transfected with miR-601 inhibitor), KRT5 group (transfected with KRT5 overexpression recombinant plasmids), miR-601 mimic + KRT5 group (transfected with miR-601 mimic and KRT5 overexpression recombinant plasmids), PRI-724 group (treated with the Wnt signaling pathway inhibitor, PRI-724) and the PRI-724 + KRT5 group (treated with PRI-724 and transfected with KRT5 overexpression recombinant plasmids).
Cell transfection was performed as follows: Specifically, cells were seeded into a 20-well plate. Cell transfection was then conducted using an Invitrogen™ Lipofectamine™ 2000 kit (Thermo Fisher Scientific, Inc), following the manufacturer’s protocol. Aliquots (20 pmol) of KRT5 overexpression recombinant plasmids, miR-601 mimic, miR-601 inhibitor or scrambled control were dissolved in 50 µl PBS (designated as solution A), or they were further mixed with 50 µl PBS containing 1 µl Lipofectamine™ 2000 (solution B), and the solutions were placed at room temperature for 20 min. Subsequently, solutions A and B were mixed and added into cells, which were then cultured in an incubator with 5% CO2 at 37°C. The medium was completely changed after incubation for 6-8 h.
The PRI-724 inhibitor (S8262; Selleck Chemicals, Houston, TX, USA) was diluted with serum-free medium SFM to 150 nM; subsequently, 2 ml of the mixture was added to the cells and incubated for a 24 h period, after which the culture medium was subsequently changed.
RT-qPCR
Total RNA was extracted from PCSCs featured in all the experimental treatment groups using a miRNeasy Mini kit (Tiangen Biotech Co., Ltd, Beijing, China) after 48 h transfection. RNA samples (5 μl) were diluted with 20× free-RNA enzyme ultrapure water. The optical density (OD) values (at 260 and 280 nm) and RNA concentration were detected using ultraviolet spectroscopy with a UV1901 double beam spectrophotometer (Aoxi Scientific Instrument Ltd., Shanghai, China). A ratio of OD260/OD280 ranging from 1.7-2.1 was considered to indicate high purity, and these RNA samples were therefore selected for subsequent experiments. The reverse transcription process was performed using EasyScript® First-Strand cDNA Synthesis SuperMix (AE301-02; TransGen Biotech Company, Beijing, China), according to the manufacturer’s protocol. The thermocycling conditions of this procedure were as follows: 37°C for 15 min, followed by 85°C for 5 sec; the samples were then frozen at -80°C for later use. The primers of miR-601, KRT5, Wnt-1, βcatenin, Nanog, and Oct-4 were designed and synthesized by Sangon Biotech (Shanghai) Co., Ltd. (Shanghai, China) (Table 1). The qPCR reaction was performed using a SYBR® Premix Ex TaqTM II kit (RR820A; Xing Zhi Biotech Co., Ltd., Guangzhou, Guangdong Province, China), according to the manufacturer’s protocol. The reaction system included 10 μl SYBR Premix, 2 μl cDNA template, 0.6 μl forward and reverse primers, and 6.8 μl sterile water. RT-qPCR was performed with an ABI 7500 Real-Time PCR system (ABI Research, Oyster Bay, NY, USA), and glyceraldehyde phosphate dehydrogenase (GAPDH) and U6 were used as internal references for the genes of interest and miR-601, respectively. The thermocycling conditions were as follows: pre-denaturation at 95°C for 30 sec, 45 cycles of denaturation at 95°C for 5 sec, annealing at 20°C for 30 sec and extension at 72°C for 30 sec. The 2-ΔΔCq method was utilized to calculate the relative mRNA expression levels of miR-601, KRT5, Wnt-1, β-catenin, Nanog and Oct4, according to the equation: ΔΔCq = ΔCqexperimental group-ΔCqcontrol group [23]. The experiment was repeated 3 times.
Table 1.
Primer sequences for quantitative real-time polymerase chain reaction
| Gene | Primer Sequences |
|---|---|
| KRT5 | F: 5’-CCAAGGTTGATGCACTGATGG-3’ |
| R: 5’-TGTCAGAGACATGCGTCTGC-3’ | |
| Wnt1 | F: 5’-TTCAGACACGAGAGATGGAACT-3’ |
| R: 5’-CCAGCCTTCACTTGCTGAG-3’ | |
| Oct4 | F: 5’-GTGGAGAGCAACTCCGATG-3’ |
| R: 5’-GTGGAGAGCAACTCCGATG-3’ | |
| β-catenin | F: 5’-ATGGAACCAGAGAAAAGC-3’ |
| R: 5’-AAGGACTGAGAAAATCCCTG-3’ | |
| Nanog | F: 5’-TCCCGAGAAAAGATTAGTCAGCA-3’ |
| R: 5’-AGTGGGGCACCTGTTTAACTT-3’ | |
| miR-601 | F: 5’-CACTAGATTGTGAGCTCCTGGA-3’ |
| R: 5’-GTGCAGGGTCCGAGGT-3’ | |
| U6 | F: 5’-AAAGCAAATCATCGGACGACC-3’ |
| R: 5’-GTACAACACATTGTTTCCTCGGA-3’ | |
| GAPDH | F: 5’-TGTGGGCATCAATGGATTTGG-3’ |
| R: 5’-ACACCATGTATTCCGGGTCAAT-3’ |
Western blot analysis
PCSCs in the exponential growth phase were selected after 48 h and washed 3 times with pre-cooled PBS. Subsequently, the PCSCs were lysed on ice using RIPA buffer (R0010; Beijing Solarbio Science and Technology Co., Ltd., Beijing, China) for 30 min, centrifuged at 12,000 rpm for 10 min to obtain the supernatant, and stored at -20°C prior to determination of the protein concentration using a BCA kit (PC0020; Beijing Solarbio Science and Technology Co., Ltd.). The protein was subsequently treated with the same volume of SDS-PAGE sample buffer (P1200; Beijing Solarbio Science and Technology Co., Ltd.) in accordance with the manufacturer’s protocol. Subsequently, the proteins were transferred to a polyvinylidene fluoride membrane and blocked for 1 h with 5% BSA at room temperature. The membranes were then incubated overnight at 4°C after incubating with the primary antibodies against KRT5 (cat. no. ab52635, 1:10,000 dilution), Wnt-1 (cat. no. ab15251, 1:100), Oct4 (cat. no. ab18976, 1 μg/ml), β-catenin (cat. no. ab15180, 1:100), phosphorylated (p)-β-catenin (cat. no. ab27798, 1:500), Nanog (cat. no. ab106465, 1 μg/ml), matrix metalloproteinase 2 (MMP2) (cat. no. ab37150, 1 μg/ml), the tumor metastasis suppressor KAI1 (cat. no. ab59509, 1 μg/ml), N-cadherin (cat. no. ab18203, 1 μg/ml), E-cadherin (cat. no. ab15148, 1:500), Bax (cat. no. ab32503, 1:1,000), Bcl2 (cat. no. ab32124, 1:1,000), and GAPDH (cat. no. ab37168, 1 μg/ml) (all purchased from Abcam). The next day, the membranes were washed with PBST buffer 3 times (10 min each wash), and subsequently incubated with the secondary antibody, goat anti-rabbit IgG (cat. no. ab205718, 1:5,000, Abcam), gently agitated for 1 h on a shaking table, and washed 3 times again with PBST (15 min each wash). The membranes were then immersed in electrochemiluminescence (ECL) solution (Pierce; now a brand of Thermo Fisher Scientific, Inc.) for 1 min, prior to exposure to X-rays in a dark room to develop and determine the color. Finally, the images were developed using a Bio-Rad gel imaging system (MG8600; Beijing Thmorgan Biological Technology Co., Ltd, Beijing, China), and the relative protein level was evaluated using ImageJ software. Each experiment was repeated 3 times.
Wound healing experiment
PCSCs were seeded into a 24-well plate (4×10⁵ cells each well). After 24 h, a scratch was generated in each well by using a 200 μl sterile gun. The cells were washed 3 times with PBS, and then cultured in an incubator. The migration distance was detected using an inverted microscope (CX23; Olympus Corporation), and images were captured at 0 and 48 h after the scratch test. The healing rate was calculated according to the following formula: [migration distance (0 h) - migration distance (48 h)]/migration distance (0 h) [24]. Each experiment was repeated 3 times.
Transwell assay
Matrigel™ (BD Biosciences, San Jose, CA, USA) was diluted with precooled and serum-free DMEM medium in a ratio of 1:10. Subsequently, 100 μl diluted Matrigel was added to the upper chamber and placed at room temperature for 2 h. PCSCs in each group were washed with 200 μl SFM (comprising RPMI-1640 medium) and digested with 0.25% trypsin, before being resuspended with SFM (comprising DMEM) 24 h after transfection. Subsequently, 100 μl cells (adjusted to 3×10⁵ cells/ml) were added into the Transwell upper chamber (Corning Inc., Corning, NY, USA), and 600 μl 10% serum comprising DMEM medium was added into the lower chamber at the same time. The experimental procedure was performed according to the manufacturer’s protocol. Three visual fields were randomly picked, and the number of cells crossing the membrane was counted under an inverted microscope (XDS-800D; Shanghai Caikon Optical Instrument Co., Ltd., Shanghai, China). The invasion rate was calculated according to the following equation: Invasion rate = (number of cells passing through the matrix/total cells) ×100% [25]. The experiment was repeated 3 times.
Methyl thiazolyl tetrazolium (MTT) assay
Single cell suspension was prepared by adding 10% fetal bovine serum to the cells, which were subsequently added to a 96-well plate [cell density, (3-6) ×103 cells per well, in a volume of 200 μl per well]. Six wells in duplicate were set up, and to each well was added 10 μl MTT solution (M1025; Beijing Solarbio Science and Technology Co., Ltd.) at 0, 24, 48 and 72 h after transfection. The cells were then cultured for a further 4 h. Dimethyl sulfoxide (DMSO) (150 μl) was then added each well, and the plate was agitated for 10 min to fully dissolve the crystals. An MTT enzyme-linked immunometric meter (DNM-9602G; Beijing Pulang Instrument Co., Ltd, Beijing, China) was adopted for OD detection at 490 nm. Each experiment was repeated 3 times.
Annexin V-fluorescein isothiocyanate (FITC)/PI double staining
An annexin V-FITC/PI double staining kit (556547; Becton, Dickinson and Company, USA) was used to measure apoptosis of the PCSCs following transfection for 48 h. Specifically, cells were treated with 0.25% trypsin, the cell density was adjusted to 1×10⁶ cells/ml, and the cells in each group were subsequently centrifuged at 4,000 rpm/min for 5 min. Subsequently, the cells were collected and resuspended in 1×PBS, centrifuged again at 2,000 rpm for 5 min, and 300 µl 1× Binding Buffer was then added to the cells. Subsequently, 5 µl Annexin V-FITC was added to the resuspended cells, which were then incubated at room temperature for 15 min prior to the addition of 5 µl PI. A CyFlow Cube6 flow cytometer (Sysmex Partec) was used to determine the extent of apoptosis: The absorbances of FITC (at 480 nm and 530 nm) and PI (at 575 nm) were detected, respectively, at the different excitation wavelengths. This experiment was repeated 3 times.
Tumor xenograft in nude mice
In total, 35 BALB/C nude mice (weighing 18-25 g, and aged 4 weeks) were purchased from Hubei Research Center of Laboratory Animal (Wuhan, China) and raised in a specific pathogen environment. The mice were divided into seven groups (n = 5 mice in each group, which were set up to be the same as the cell group treatment groups. Subsequently, the mice were administered 2% sodium pentobarbital (0.6 ml/100 g) by intraperitoneal injection, and 0.2 ml PCSC suspension (concentration of cells, 107/ml) was inoculated into the subcutaneous tissue. At the end of the fourth week, the mice were sacrificed, and the resultant tumors were dissected and weighed. The tumor volume was calculated according to the formula: Length × width2/2 [26].
Immunohistochemical staining
Lymph nodes of nude rats were obtained, and immediately fixed with 4% neutral buffered formalin (Beijing Solarbio Science and Technology Co., Ltd.) for 24 h. After washing with PBS, the lymph node tissues were dehydrated, cleared, embedded in paraffin, and sliced (3 μm slices). Before performing the experiments, these slices were baked at 60°C for 30 min, dewaxed in xylene (I and II), dehydrated through an ethanol gradient (100, 85 and 80%) for 5 min at each concentration, and washed with PBS for 3 times. Subsequently, antigen retrieval was accomplished through microwave treatment in citrate buffer (pH = 8.0) for 10 min, and the tissue slices were then washed 3 times again with PBS (5 min each wash) after cooling to room temperature. Subsequently, 0.3% H2O2-methanol solution was added to the slices at room temperature for 10 min to block endogenous peroxidase activity, prior to washing twice with PBS (5 min each wash). Subsequently, the slices were incubated with Ki-67 primary antibody (diluted to 1 μg/ml, cat. no. ab15580, Abcam) at 4°C overnight in a fridge, and washed three times with 0.1% PBST (5 min each wash) the following day. Polymer reinforcer was then added to the slices, which were incubated at room temperature for 20 min and washed three times again with PBST (5 min each wash). Horseradish peroxidase-labeled IgG, as a secondary antibody (PV-9000-D; Beijing Zhongshan Golden Bridge Biotechnology Co. Ltd., Beijing, China), was then added. The slices were subsequently incubated at room temperature for 30 min, and washed three times with 0.1% PBST (5 min each wash). Finally, the slices were stained with 3,3’-diaminobenzidine (DAB) for 5 min, re-stained with hematoxylin, and observed under an inverted microscope. IPP7.0 software (Media Cybernetics, Singapore) was used to perform semiquantitative analysis. The cells were counted in 10 fields (100 PCSCs in each field) and the percentages of positivelystained cells were calculated using the formula: No. of positively-stained cells/total number of cells ×100% [27].
Statistical analysis
Statistical analysis was performed using SPSS v. 21.0 software (IBM Corp., Armonk, NY, USA). Results were expressed as the mean ± standard deviation (SD). All experiments were repeated 3 times. Comparisons between two groups were analyzed using the t-test, whereas multiple groups were analyzed using oneway analysis of variance (ANOVA). The test of normality was verified by the Kolmogorov-Smirnov test. Specifically, the normal distribution in multiple groups was conducted by oneway ANOVA followed by the Tukey post-hoc test, whereas nonnormal distribution analysis was analyzed using Dunn’s multiple comparison for post-hoc tests following Kruskal-Wallis testing. P<0.05 was considered significant.
Results
Bioinformatics prediction
Based on the information obtained from the prostate cancer gene chip, GSE46602, 153 differentially expressed genes were selected according to the set criteria, |logFC|>2.0 and adj.P.Val<0.01. The top 10 genes (KLK3, AR, ERG, TP53, PTEN, PROS1, NPEPPS, PSAT1, PLAG1, and TMPRSS2) reported to be associated with prostate cancer (code: C0600139) were screened from the database, DisGeNET (Figure 1A). Both the 10 differentially expressed genes and the prostate cancer-associated genes were incorporated into the STRING database, and it was revealed that KRT5 is closely associated with the known disease-associated gene (degree = 3) (Figure 1B). KRT5 is a member of the keratin family, with keratin being the main structural protein of keratinocytes and an important component of the intermediate filament family. Previous studies indicated that low expression of KRT5 in bladder tissue was associated with poor prognosis in patients with invasive bladder cancer; at the same time, KRT5 was found not to be expressed in the majority of tumorcausing bladder cancer cell lines [15,28]. Furthermore, KRT5 was found to express differently in different body sections of patients with head-and-neck squamous cell carcinoma [16]. However, no evidence was identified to suggest that high expression of KRT5 may contribute to the recurrence rate and drug resistance of ovarian cancer [29]. Nevertheless, the expression of KRT5 in prostate cancer and its direct function in prostate cancer, have yet to be properly elucidated. Therefore, the present study focused on the effect of KRT5 on prostate cancer. To identify the candidate miRNA involved in modulating KRT5 expression, the RNA22, miPATH and TargetScanHuman databases were searched, and 1639, 55, and 176 miRNAs regulating KRT5 were identified, respectively. Integrated analysis on data obtained from the above three databases is shown in a Venn diagram (Figure 1C), and hsamicroRNA-601 and hsa-microRNA-564 were identified as overlapping miRNAs Previous studies revealed that miR-564 was downregulated in prostate cancer tissues, and inhibited various tumor cells [30-33], whereas miR-601 was upregulated in esophageal squamous cell carcinoma and ovarian cancer [34,35]. However, another study had shown that miR-601 was downregulated in breast cancer, and inhibited the growth and invasion of breast cancer cells [36]. qRTPCR was performed to detect the expression levels of miR-564, miR-601 and KRT5 in prostate cancer tissue, and the adjacent tissues. These experiments revealed that, compared with adjacent tissues, miR564 and KRT5 were significantly downregulated, whereas miR-601 was significantly upregulated in tumor tissue (Figure 2A-C), results which were consistent with the expression of KRT5 in the chip (Figure 2D). Therefore, miR-601 and its target gene, KRT5, were selected for subsequent experiments. At the same time, it has been demonstrated that the Wnt signaling pathway is significantly activated in prostate cancer [37,38]. Therefore, the results obtained from the bioinformatics analysis indicated that miR-601 is probably the modulatory agent in prostate cancer that acts by interacting with the KRT5-mediated Wnt signaling pathway.
Figure 1.
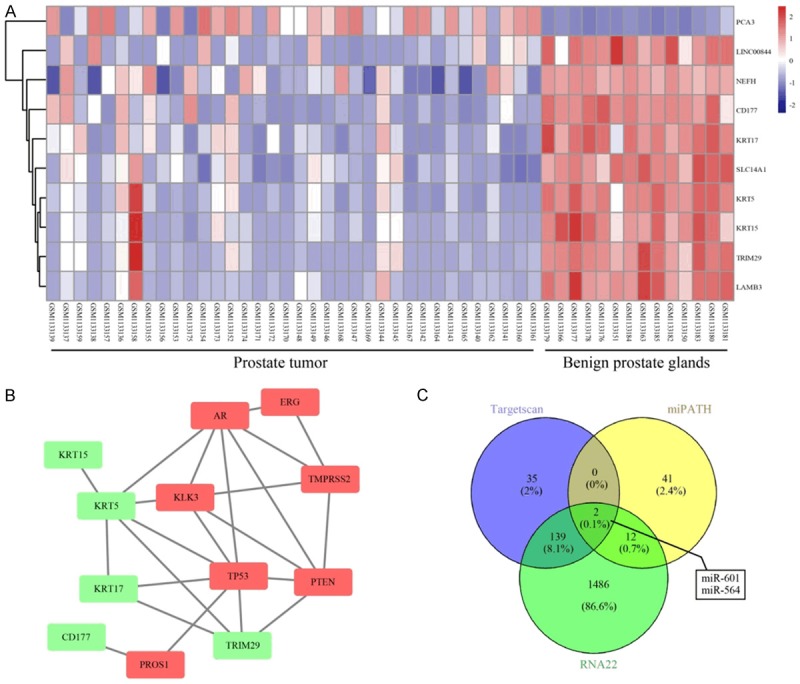
Screening of prostatic cancerassociated genes and the target miRNA through using a bioinformatics analysis. A. Differentially expressed genes indicated in the chip data (GSE46602) associated with prostatic cancer. The right panel is color-coded, where each rectangle represents a sample. The red color indicates high expression, whereas the blue color indicates relatively low expression. B. Geneinteraction network of prostate cancer-associated genes and known genes. The red rectangles represent known disease genes, whereas the green rectangles represent differentially expressed genes. C. Comparison of RNA22, miRNApath and Targetscan databases on KRT5 miRNA upstream identified hsa-miR-601 and hsa-miR-564 as the intersecting miRNAs. KRT5, keratin 5.
Figure 2.
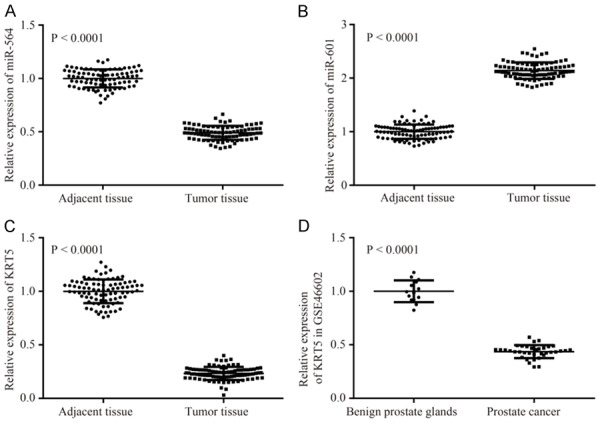
Expression levels of miR-564, miR-601 and KRT5 mRNA. A-C. Expression levels of miR-564, miR-601 and KRT5 mRNA in prostate cancer tissue, and adjacent non-cancerous tissue, are shown. D. mRNA expression of KRT5 in the gene chip, GSE46602. KRT5, keratin 5.
miR-601 is predicted to target KRT5, and confirmation of this hypothesis by luciferase reporter gene assay
Through using the online prediction tool Targetscan, the binding sites of miR-601 and KRT5 were identified, and these are presented in Figure 3A. Dualluciferase report assay was utilized to further confirm that miR-455-3p directly mediates regulation of KRT5. The results also revealed that miR-601 could significantly reduce the luciferase activity of the KRT5-3’-UTR-wt, although it exerted little influence on KRT5-3’-UTRmut. These results confirmed that miR-601 directly targets KRT5 (Figure 3B) (P<0.05).
Figure 3.
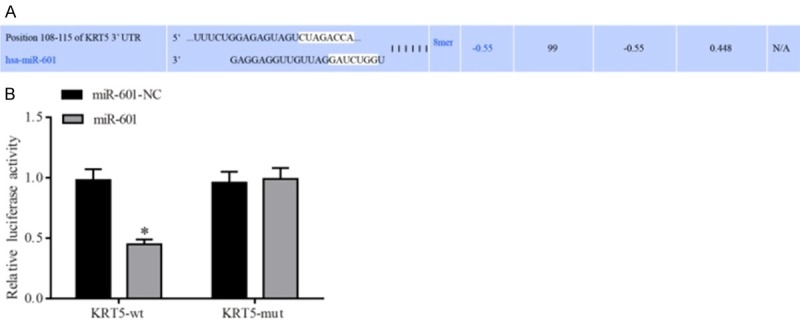
Verification of the KRT5 target site on miR-485-5p. A. The binding sites between miR-601 and KRT5 were predicted using the Targetscan bioinformatics tool. B. Verification of the miR-601 binding site on KRT5 was performed using the dual-luciferase reporter gene assay. *P<0.05 cf. the miR-601-NC + KRT5-wt group. Data are expressed as the mean ± SD, and data were analyzed using twofactor variance analysis. The experiments were performed in triplicate. KRT5, keratin 5.
Preparation of prostate cancer cell spheres
After culture in SFM for 4-5 days, the stem cell spheres were initially formed, and these demonstrated good refraction and high density; subsequently, both their size and density increased after 10-15 days. The results of the flow cytometric analysis revealed that the percentage of CD133+CD44+ cells was 81.26% in the stem cell spheres, much higher compared with that in the monolayerattached cells (4.15%) (Figure 4). The stem cell spheres were selected for the subsequent cell experiments with PCSCs.
Figure 4.
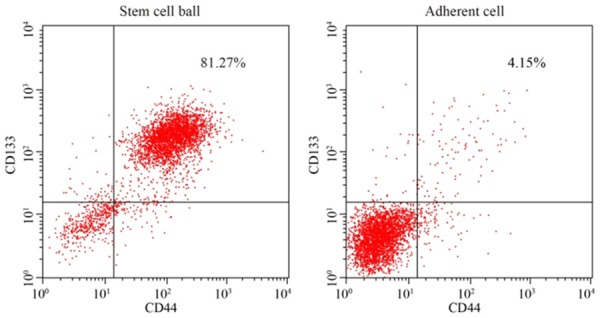
Identification of prostate cancer stem cells by flow cytometric analysis. Expression levels of CD133+ and CD44+ in spheroid cells and monolayer adherent cells in prostate cancer are indicated.
MiR-601 participates in activation of the WNT signaling pathway by targeting KRT5
As shown in Figure 5, the results of RT-qPCR and western blot analysis demonstrated that, compared with the negative control group, the miR-601 mimic group exhibited a reduced level of expression of p-β-catenin and KRT5, but an increased expression level of miR-601, Wnt-1 and β-catenin were observed, whereas the miR-601 inhibitor and KRT5 groups demonstrated the opposite results (all P<0.05). Compared with the miR-601 inhibitor + KRT5 group, the expression levels of p-β-catenin and KRT5 were reduced, whereas that of Wnt-1 and β-catenin were increased, in the KRT5 and miR-601 inhibitor groups (all P<0.05).
Figure 5.

Activation of the Wnt signaling pathway. A. RT-qPCR was utilized to detect the expression levels of miR-601 and mRNA as they relate to the Wnt signaling pathway. B. Protein expression levels of proteins associated with the Wnt signaling pathway were determined by western blot analysis. C. Quantification of the protein expression data is shown. *P<0.05 cf. the negative control group; #P<0.05 cf. the miR-601 inhibitor + KRT5 group. Data are expressed as the mean ± SD, and data were analyzed using oneway analysis of variance (ANOVA). The experiments were performed in triplicate. KRT5, keratin 5.
Inhibition of miR-601 or overexpression of KTR5 inhibits the migration and invasive abilities of PCSCs by regulating the Wnt signaling pathway
Western blotting was utilized to determine the expression levels of proteins associated with invasion and metastasis (Figure 6). These results indicated that, compared with the negative control group, the protein expression levels of N-cadherin and MMP-2 in the miR-601 mimic group were upregulated, but these proteins were downregulated in the other groups (all P<0.05). Furthermore, the protein expression levels of the tumor metastasis suppressor, KAI1, and E-cadherin in the miR-601 mimic group were clearly decreased, but were increased in the other groups (all P<0.05). Compared with the miR-601 inhibitor + KRT5 group, the protein expression levels of N-cadherin and MMP-2 in the miR-601 inhibitor and KRT5 groups were increased, whereas those of KAI1 and E-cadherin were decreased in these two groups (all P<0.05). Compared with the PRI-724 (a Wnt signaling pathway inhibitor) + KRT5 group, the protein expression levels of N-cadherin and MMP-2 were increased in the PRI-724 and KRT5 groups, whereas those of KAI1 and E-cadherin were decreased in these two groups (all P<0.05).
Figure 6.
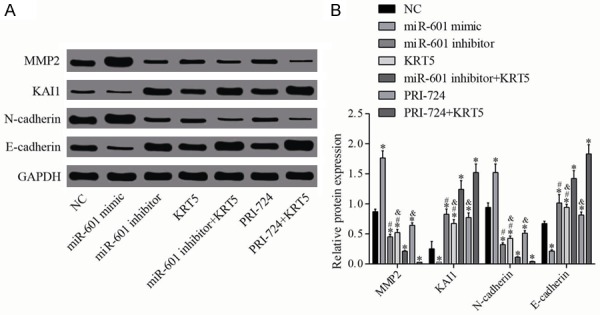
Relative protein levels of MMP-2, KAI1, N-cadherin and Ecadherin. A. Protein expression levels of MMP-2, KAI1, N-cadherin and E-cadherin were determined by western blot analysis. B. Quantification of the protein expression is shown. *P<0.05 cf. the negative control group; #P<0.05 cf. the miR-601 inhibitor + KRT5 group; &P<0.05 cf. the PRI-724 + KRT5 group. Data are expressed as the mean ± SD, and data were analyzed using oneway analysis of variance (ANOVA). The experiments were performed in triplicate. KRT5, keratin 5; MMP-2, matrix metalloproteinase 2.
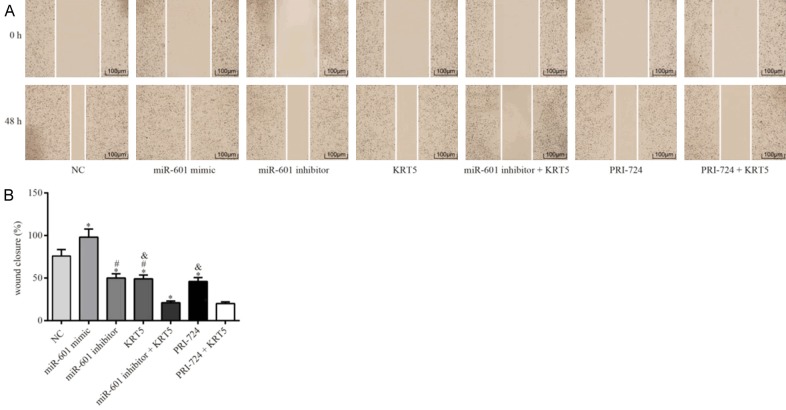
The results of the wound healing and Transwell assays indicated that, compared with the PCSCs in the negative control group, the migration and invasive capabilities of the PCSCs in the miR-601 mimic group were significantly enhanced, although these were diminished in the other groups (all P<0.05). Compared with the miR-601 inhibitor + KRT5 group, the migration and invasive abilities of PCSCs in the KRT5 and miR-601 inhibitor groups were significantly strengthened (all P<0.05). It was also noted that the migration and invasive capabilities of the PCSCs in the KRT5 and PRI-724 groups were significantly reinforced in comparison with the PRI-724 + KRT5 group (all P<0.05) (Figures 7 and 8).
Figure 7.
Migration ability of the PCSCs in each group as detected by scratch wound assay. A. Maps of the cell scratch test are shown. B. Quantification of the wound closure in each group is shown. *P<0.05 cf. the negative control group; #P<0.05 cf. the miR-601 inhibitor + KRT5 group; &P<0.05 cf. the PRI-724 + KRT5 group. Data are expressed as the mean ± SD, and data were analyzed using oneway analysis of variance (ANOVA). The experiments were performed in triplicate. KRT5, keratin 5; PCSC, prostate cancer cell line.
Figure 8.
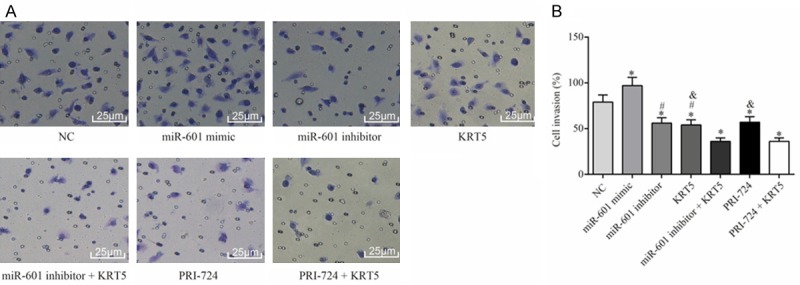
Invasive ability of PCSCs in each group as determined by Transwell assay. A. Observation of the invasion of PCSCs in each group. B. Quantification of the invasiveness of PCSCs is shown. *P<0.05 cf. the negative control group; #P<0.05 cf. the miR-601 inhibitor + KRT5 group; &P<0.05 cf. the PRI-724 + KRT5 group. Data are expressed as the mean ± SD, and data were analyzed using one-way analysis of variance (ANOVA). The experiments were performed in triplicate. KRT5, keratin 5; PCSC, prostate cancer cell line.
Inhibition of miR-601, or overexpression of KTR5 inhibits PCSC proliferation by the Wnt signaling pathway
Western blotting was employed to measure the levels of proteins associated with proliferation, and the results (Figure 9) revealed that, compared with the negative control group, the protein expression of Nanog and Oct4 was upregulated in the miR-601 mimic group, but downregulated in all other groups (all P<0.05). Compared with the miR-601 inhibitor + KRT5 group, the protein expression levels of Nanog and Oct4 in the miR-601 and KRT5 groups were increased (all P<0.05). In addition, compared with the PRI-724 + KRT5 group, the protein expression levels of Nanog and Oct4 in the PRI-724 and KRT5 groups was increased (all P<0.05).
Figure 9.
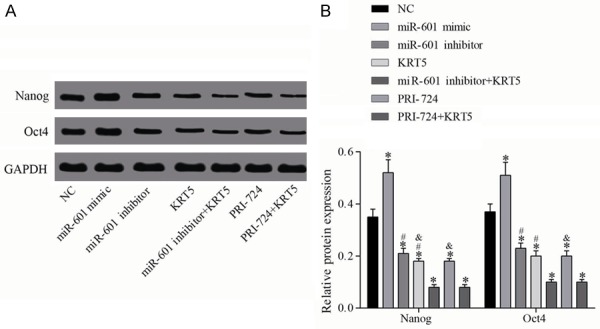
Relative protein levels of Nanog and Oct4. A. Protein expression levels of Nanog and Oct4 were determined by western blot analysis. B. Quantification of the protein expression data is shown; *P<0.05 vs. the negative control group; #P<0.05 vs. the miR-601 inhibitor + KRT5 group; &P<0.05 vs. the PRI-724 + KRT5 group. Data are expressed as the mean ± SD, and data were analyzed using one-way analysis of variance (ANOVA). The experiments were performed in triplicate. KRT5, keratin 5.
MTT assay was employed to detect the proliferative ability of the PCSCs in each group. As a result, no significant differences in cell proliferation were observed comparing among the groups during the 0-24 h time period (all P<0.05). Compared with the negative control group, however, cell proliferation was significantly enhanced following miR-601 overexpression, although the cell proliferative ability was reduced in the other groups (all P<0.05). Compared with the miR-601 inhibitor + KRT5 group, the proliferative ability of the PCSCs in the KRT5 and miR-601 inhibitor groups was significantly strengthened (all P<0.05). Finally, the proliferative ability in the KRT5 and PRI-724 groups was significantly increased in comparison with the PRI-724 + KRT5 group (all P<0.05) (Figure 10).
Figure 10.
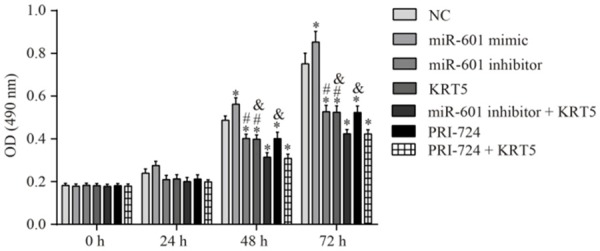
Proliferative ability of the PCSCs in each group as determined by MTT assay. Proliferative ability of the PCSCs was investigated through using the MTT assay at 0, 24, 48 and 72 h. *P<0.05 vs. the negative control group; #P<0.05 vs. the miR-601 inhibitor + KRT5 group; &P<0.05 vs. the PRI-724 + KRT5 group. Data are expressed as the mean ± SD, and data were analyzed using one-way analysis of variance (ANOVA). The experiments were performed in triplicate. KRT5, keratin 5; PCSC, prostate cancer stem cell.
Inhibition of miR-601 or KTR5 overexpression inhibits apoptosis of PCSCs by the Wnt signaling pathway
Western blotting was performed to measure the levels of the apoptosis-associated proteins, Bcl-2 and Bax, in each group, and these results (Figure 11) showed that, compared with the negative control group, the Bcl-2/Bax ratio was increased in the miR-601 mimic group, but this was decreased in the other groups (all P<0.05). Compared with the miR-601 inhibitor + KRT5 group, Bcl-2/Bax was upregulated in the miR-601 inhibitor and KRT5 groups (all P<0.05). Compared with the PRI-724 + KRT5 group, Bcl-2/Bax was upregulated in the PRI-724 and KRT5 groups (all P<0.05).
Figure 11.
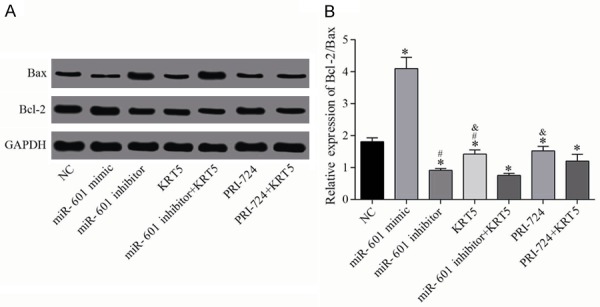
Relative protein levels of Bax and Bcl-2. A. Protein expression levels of Bax and Bcl-2 were determined by western blot analysis. B. Quantification of the protein expression data is shown. *P<0.05 vs. the negative control group; #P<0.05 vs. the miR-601 inhibitor + KRT5 group; &P<0.05 vs. the PRI-724 + KRT5 group. Data are expressed as the mean ± SD, and data were analyzed using one-way analysis of variance (ANOVA). The experiments were performed in triplicate. KRT5, keratin 5.
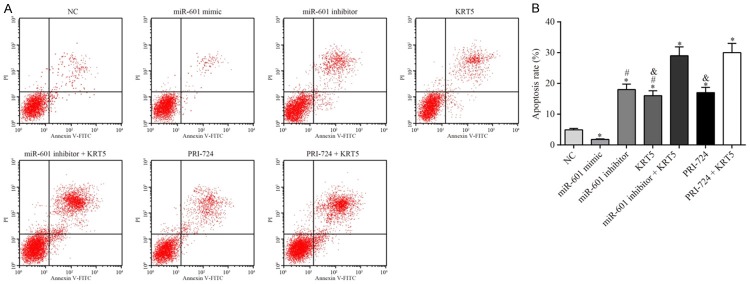
The cell apoptosis detection experiments revealed that, compared with the negative control group, apoptosis in the miR-601 mimic group was significantly inhibited, whereas it was upregulated in the other groups (all P<0.05). Compared with the miR-601 inhibitor + KRT5 group, the apoptotic rates in the KRT5 and miR-601 inhibitor groups were significantly suppressed (all P<0.05). Finally, the levels of apoptosis in the KRT5 and PRI-724 groups were significantly downregulated in comparison with the PRI-724 + KRT5 group (all P<0.05) (Figure 12).
Figure 12.
Apoptosis of the PCSCs in each experimental group. A. Results of the flow cytometric analysis are shown. B. The apoptotic rate of the PCSCs after transfection for 48 h was determined. *P<0.05 vs. the negative control group; #P<0.05 vs. the miR-601 inhibitor + KRT5 group; &P<0.05 vs. the PRI-724 + KRT5 group. Data are expressed as the mean ± SD, and data were analyzed using oneway analysis of variance (ANOVA). The experiments were performed in triplicate. KRT5, keratin 5; PCSC, prostate cancer stem cell.
Inhibition of miR-601, or overexpression of KTR5, inhibits tumor growth in nude mice by regulation of the Wnt signaling pathway
The cellular biological experiments described above were performed first, and the results obtained revealed that miR-601 was able to regulate the biological characteristics of PCSCs by regulation of the Wnt signaling pathway by targeting KRT5. Subsequently, xenograft tumor experiments in nude mice were performed to further explore the involvement of miR-601 in the regulation of PCSCs through interactions with KRT5 and the Wnt signaling pathway. These results demonstrated that, compared with the negative control group, the gross tumor volume in the miR-601 mimic group was significantly increased, although this was decreased in the other groups (all P<0.05). Compared with the miR-601 inhibitor + KRT5 group, the tumor volume in the KRT5 and miR-601 inhibitor groups was significantly increased (all P<0.05). Furthermore, the tumor volumes in the KRT5 and PRI-724 groups were clearly larger compared with the PRI-724 + KRT5 group (all P<0.05) (Figure 13).
Figure 13.
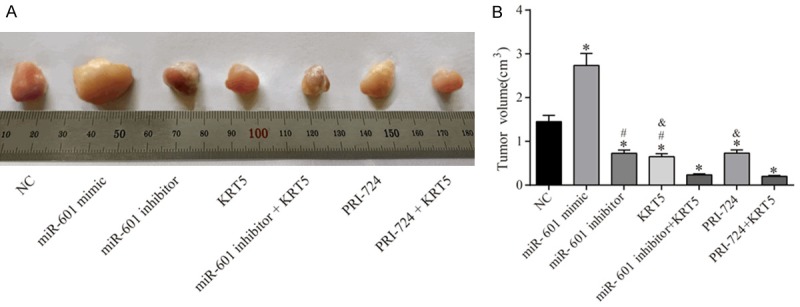
Results of the xenograft tumor experiments in nude mice. A. Observation of the subcutaneous tumor in nude mice. B. Tumor volume in each group. *P<0.05 vs. the negative control group; #P<0.05 vs. the miR-601 inhibitor + KRT5 group; &P<0.05 vs. the PRI-724 + KRT5 group. n = 5 mice were allocated to each group, and the data were expressed as the mean ± SD, analyzed using ANOVA.
Inhibition of miR-601 or KTR5 overexpression inhibits lymph node metastasis by regulating the Wnt signaling pathway
To detect lymph node metastasis in each group, immunohistochemistry was performed to measure the protein level of Ki-67. It was found that, compared with the negative control group, the positive rate of Ki-67 protein expression in the miR-601 mimic group was significantly upregulated; whereas, in the other groups, the positive rate of Ki-67 was downregulated (all P<0.05). Compared with the miR-601 inhibitor + KRT5 group, the expression levels of Ki-67 protein in the KRT5 and miR-601 inhibitor groups were significantly increased (all P<0.05). The positive rate of Ki-67 protein in the KRT5 and PRI-724 groups was also identified to be markedly increased in comparison with the PRI-724 + KRT5 group (all P<0.05) (Figure 14).
Figure 14.
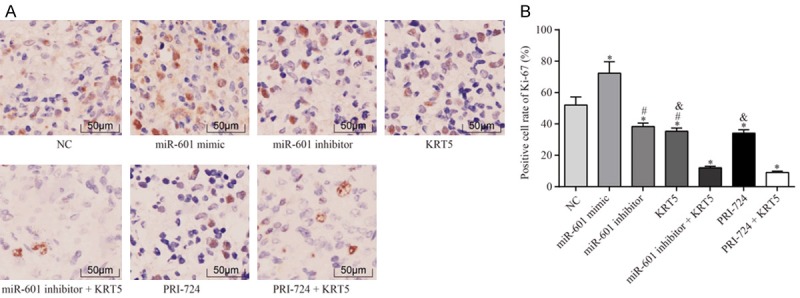
Expression of Ki-67 in the lymph gland in each group by immunohistochemical analysis. A. The immunohistochemistry staining results are shown. B. Statistical results of positive cell numbers of Ki-67 in lymph node; *P<0.05 vs. the negative control group; #P<0.05 vs. the miR-601 inhibitor + KRT5 group; &P<0.05 vs. the PRI-724 + KRT5 group. The data were expressed as the mean ± SD, analyzed using ANOVA. Each experiment was repeated 3 times.
Discussion
Prostate cancer is one of the most commonly diagnosed cancers in men [39]. Pharmacotherapy, immunotherapy, radiotherapy, chemotherapy, and palliative therapy are the common methods of treatment [40]. From the perspective of gene therapy, the present study aimed to explore the role of miR-601-KRT5 interaction on the Wnt signaling pathway in the pathogenesis of prostate cancer. As a result, it has been demonstrated that the inhibition of miR-601 may activate KRT5 and suppress the Wnt signaling pathway, and subsequently, positively affect the proliferation, migration, and invasion of PCSCs.
Initially, bioinformatic tools were employed to predict potential genes which are associated with prostate cancer, and it was revealed that KRT5 is closely associated with prostate cancer-linked genes; furthermore, evidence was accumulated to suggest that KRT5 participates in the incidence of numerous types of cancer. For example, Breyer et al [41] demonstrated that there was a strong correlation of KRT5 expression with the recurrence and metastasis of nonmuscleinvasive bladder cancer. Another study revealed that KRT5 could regulate the formation of cytoskeleton and venous invasion of cancer [42,43]. Furthermore, Ricciardelli et al [29] verified the tumor suppressor function of KRT5 in reducing the recurrence and chemotherapeutic resistance of ovarian cancer. All these findings suggested a positive role of KRT5 in cancer. miR-601 is the target RNA of KRT5, and a study reported that miR-601 overexpression could serve as an important marker in the diagnosis of colorectal cancer [34]. However, the role of miR-601 in prostatic cancer remains largely unknown. In order to explore the effects of miR-601 and KRT5 on PCSCs, real-time fluorescence quantitative assay and western blot assays were performed, and the results obtained demonstrated that the inhibition of miR-601, or KRT5 overexpression, are able to inhibit the expression of Nanog and Oct4, and that the miR-601 inhibitor + KRT5 group exhibited the most obvious decline. In addition, the expression of KRT5 was significantly decreased, whereas the expression levels of Wnt1 and β-catenin were significantly increased in the miR-601 mimic group, suggesting that the effects of miR-601 on PCSCs is mainly mediated through its interaction with KRT5, and by regulation of the Wnt signaling pathway. The Wnt signaling pathway exerts a crucially important role in the pathogenesis of prostate cancer [44]. Studies have confirmed that activation of the Wnt signaling pathway is able to promote the epithelial-mesenchymal metastasis of prostate cancer, and induce the proliferation of prostate cancer cells [45,46]. The present study has identified corroboratory evidence with respect to this pathway’s upstream miRNA and genes associated with prostatic cancer.
Cancer stem cells, as the primary causative agents of tumor formation, resistance to chemoradiotherapy and cancer recurrence, share numerous features with normal stem cells, such as self-renewal and differentiation [47]. Accumulating evidence has demonstrated that miRNAs and genes exert regulatory roles in prostatic cancer by affecting PCSCs [48-50]. In order to investigate the effects of miR-601 and KRT5 on the biological characteristics of PCSCs, in the present study a series of experiments, including cell scratch healing, transwell, MTT assays and flow cytometric analyses, were performed. It was revealed that inhibition of miR-601 could activate KRT5 and inhibit activation of the Wnt signaling pathway, subsequently suppressing the migration, invasion and proliferation of the PCSCs, and their advancement. Nude mouse tumorigenicity assay is considered as a ‘gold standard’ for testing the tumorforming ability of tumor cells [51]. The results of our nude mouse tumorigenesis experiment revealed that the tumor volume in the miR-601 mimic group was much larger compared with that in the negative control group, although the tumor volume in the other groups was clearly decreased. Furthermore, miR-601 inhibition combined with KRT5 overexpression, as well as PRI-724 combined with KRT5 overexpression, led to a downregulation of the volume of the tumors compared with treated the mice with miR-601 inhibitor/KRT5/PRI-724. Therefore, it was possible to conclude that inhibition of miR-601 or overexpression of KRT5 could inhibit tumor growth by inhibiting activation of the Wnt signaling pathway. In addition, the immunohistochemical method was utilized to detect Ki-67 protein expression in each group’s lymph nodes, and the results demonstrated that inhibition of miR-601 or KRT5 overexpression was able to inhibit metastasis of the lymph node, and exert protective effects in prostate cancer progression.
In conclusion, the present study has demonstrated that downregulation of miR-601 decreases the rates of proliferation, invasion and metastasis of PCSCs by a mechanism that involves the interaction of miR-601 with KRT5, which subsequently influences the Wnt signaling pathway, highlighting the potential therapeutic value of miR-601 and KRT5 in treatment of prostatic cancer. The molecular mechanism of the present study is highlighted in Figure 15. However, the current study is still in the preclinical stages, and therefore numerous further studies are required in order that this avenue of research may provide proper direction for prospective therapies in the future.
Figure 15.
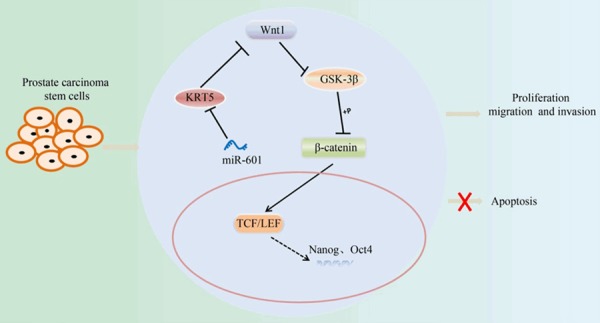
Molecular mechanism by which miR-601 downregulation inhibits the proliferation, migration and invasion of PCSCs by activating KRT5, and subsequently inhibiting the Wnt signaling pathway. PCSC, prostate cancer stem cell; KRT5, keratin 5.
Disclosure of conflict of interest
None.
References
- 1.Alqudah MAY, Mansour HT, Mhaidat N. Simvastatin enhances irinotecan-induced apoptosis in prostate cancer via inhibition of MCL-1. Saudi Pharm J. 2018;26:191–197. doi: 10.1016/j.jsps.2017.12.012. [DOI] [PMC free article] [PubMed] [Google Scholar]
- 2.Kumar C, Rasool RU, Iqra Z, Nalli Y, Dutt P, Satti NK, Sharma N, Gandhi SG, Goswami A, Ali A. Alkyne-azide cycloaddition analogues of dehydrozingerone as potential anti-prostate cancer inhibitors via the PI3K/Akt/NF-kB pathway. Medchemcomm. 2017;8:2115–2124. doi: 10.1039/c7md00267j. [DOI] [PMC free article] [PubMed] [Google Scholar]
- 3.Costa CD, Justo AA, Kobayashi PE, Story MM, Palmieri C, Laufer Amorim R, Fonseca-Alves CE. Characterization of OCT3/4, Nestin, NANOG, CD44 and CD24 as stem cell markers in canine prostate cancer. Int J Biochem Cell Biol. 2019;108:21–28. doi: 10.1016/j.biocel.2019.01.002. [DOI] [PubMed] [Google Scholar]
- 4.Gaur S, Gross ME, Liao CP, Qian B, Shih JC. Effect of monoamine oxidase A (MAOA) inhibitors on androgen-sensitive and castration-resistant prostate cancer cells. Prostate. 2019;79:667–677. doi: 10.1002/pros.23774. [DOI] [PMC free article] [PubMed] [Google Scholar]
- 5.Teo MY, Rathkopf DE, Kantoff P. Treatment of advanced prostate cancer. Annu Rev Med. 2019;70:479–499. doi: 10.1146/annurev-med-051517-011947. [DOI] [PMC free article] [PubMed] [Google Scholar]
- 6.Yang Y, Jia B, Zhao X, Wang Y, Ye W. miR-93-5p may be an important oncogene in prostate cancer by bioinformatics analysis. J Cell Biochem. 2019;120:10463–10483. doi: 10.1002/jcb.28332. [DOI] [PubMed] [Google Scholar]
- 7.Manogue C, Cotogno P, Ledet E, Lewis B, Wyatt AW, Sartor O. Biomarkers for programmed death-1 inhibition in prostate cancer. Oncologist. 2019;24:444–448. doi: 10.1634/theoncologist.2018-0546. [DOI] [PMC free article] [PubMed] [Google Scholar]
- 8.Chang W, Liu M, Xu J, Fu H, Zhou B, Yuan T, Chen P. MiR-377 inhibits the proliferation of pancreatic cancer by targeting Pim-3. Tumour Biol. 2016;37:14813–14824. doi: 10.1007/s13277-016-5295-4. [DOI] [PubMed] [Google Scholar]
- 9.Huang F, Tang J, Zhuang X, Zhuang Y, Cheng W, Chen W, Yao H, Zhang S. MiR-196a promotes pancreatic cancer progression by targeting nuclear factor kappa-B-inhibitor alpha. PLoS One. 2014;9:e87897. doi: 10.1371/journal.pone.0087897. [DOI] [PMC free article] [PubMed] [Google Scholar]
- 10.Xu XH, Li DW, Feng H, Chen HM, Song YQ. MiR-300 regulate the malignancy of breast cancer by targeting p53. Int J Clin Exp Med. 2015;8:6957–6966. [PMC free article] [PubMed] [Google Scholar]
- 11.Lee K, Ferguson LR. MicroRNA biomarkers predicting risk, initiation and progression of colorectal cancer. World J Gastroenterol. 2016;22:7389–7401. doi: 10.3748/wjg.v22.i33.7389. [DOI] [PMC free article] [PubMed] [Google Scholar]
- 12.Tian Y, Xue Y, Ruan G, Cheng K, Tian J, Qiu Q, Xiao M, Li H, Yang H, Wang L. Interaction of serum microRNAs and serum folate with the susceptibility to pancreatic cancer. Pancreas. 2015;44:23–30. doi: 10.1097/MPA.0000000000000204. [DOI] [PMC free article] [PubMed] [Google Scholar]
- 13.Yang Y, Gu X, Zhou M, Xiang J, Chen Z. Serum microRNAs: a new diagnostic method for colorectal cancer. Biomed Rep. 2013;1:495–498. doi: 10.3892/br.2013.109. [DOI] [PMC free article] [PubMed] [Google Scholar]
- 14.Srivastava SS, Alam H, Patil SJ, Shrinivasan R, Raikundalia S, Chaudhari PR, Vaidya MM. Keratin 5/14-mediated cell differentiation and transformation are regulated by TAp63 and Notch1 in oral squamous cell carcinomaderived cells. Oncol Rep. 2018;39:2393–2401. doi: 10.3892/or.2018.6298. [DOI] [PubMed] [Google Scholar]
- 15.Breyer J, Wirtz RM, Otto W, Erben P, Kriegmair MC, Stoehr R, Eckstein M, Eidt S, Denzinger S, Burger M, Hartmann A BRIDGE Consortium. In stage pT1 non-muscle-invasive bladder cancer (NMIBC), high KRT20 and low KRT5 mRNA expression identify the luminal subtype and predict recurrence and survival. Virchows Arch. 2017;470:267–274. doi: 10.1007/s00428-017-2064-8. [DOI] [PubMed] [Google Scholar]
- 16.Vasca V, Vasca E, Freiman P, Marian D, Luce A, Mesolella M, Caraglia M, Ricciardiello F, Duminica T. Keratin 5 expression in squamocellular carcinoma of the head and neck. Oncol Lett. 2014;8:2501–2504. doi: 10.3892/ol.2014.2591. [DOI] [PMC free article] [PubMed] [Google Scholar]
- 17.Ge C, Wu S, Wang W, Liu Z, Zhang J, Wang Z, Li R, Zhang Z, Li Z, Dong S, Wang Y, Xue Y, Yang J, Tan Q, Wang Z, Song X. miR-942 promotes cancer stem cell-like traits in esophageal squamous cell carcinoma through activation of Wnt/beta-catenin signalling pathway. Oncotarget. 2015;6:10964–10977. doi: 10.18632/oncotarget.3696. [DOI] [PMC free article] [PubMed] [Google Scholar]
- 18.Irizarry RA, Hobbs B, Collin F, Beazer-Barclay YD, Antonellis KJ, Scherf U, Speed TP. Exploration, normalization, and summaries of high density oligonucleotide array probe level data. Biostatistics. 2003;4:249–264. doi: 10.1093/biostatistics/4.2.249. [DOI] [PubMed] [Google Scholar]
- 19.Zhang X, Cheng X, Liu H, Zheng C, Rao K, Fang Y, Zhou H, Xiong S. Identification of key genes and crucial modules associated with coronary artery disease by bioinformatics analysis. Int J Mol Med. 2014;34:863–869. doi: 10.3892/ijmm.2014.1817. [DOI] [PubMed] [Google Scholar]
- 20.Blom J, Kreis J, Spanig S, Juhre T, Bertelli C, Ernst C, Goesmann A. EDGAR 2.0: an enhanced software platform for comparative gene content analyses. Nucleic Acids Res. 2016;44:W22–28. doi: 10.1093/nar/gkw255. [DOI] [PMC free article] [PubMed] [Google Scholar]
- 21.Magi-Galluzzi C. Prostate cancer: diagnostic criteria and role of immunohistochemistry. Mod Pathol. 2018;31:S12–21. doi: 10.1038/modpathol.2017.139. [DOI] [PubMed] [Google Scholar]
- 22.Asimakopoulos AD, Del Fabbro D, Miano R, Santonico M, Capuano R, Pennazza G, D’Amico A, Finazzi-Agrò E. Prostate cancer diagnosis through electronic nose in the urine headspace setting: a pilot study. Prostate Cancer Prostatic Dis. 2014;17:206–211. doi: 10.1038/pcan.2014.11. [DOI] [PubMed] [Google Scholar]
- 23.Xu J, Lu MX, Cui YD, Du YZ. Selection and evaluation of reference genes for expression analysis using qRT-PCR in chilo suppressalis (lepidoptera: pyralidae) J Econ Entomol. 2017;110:683–691. doi: 10.1093/jee/tow297. [DOI] [PubMed] [Google Scholar]
- 24.Zhou S, Zhang Z, Zheng P, Zhao W, Han N. MicroRNA-1285-5p influences the proliferation and metastasis of non-small-cell lung carcinoma cells via downregulating CDH1 and Smad4. Tumour Biol. 2017;39:1010428317705513. doi: 10.1177/1010428317705513. [DOI] [PubMed] [Google Scholar]
- 25.Ding X, Xiang L, Wang N, Zhao Z, Jin X, Sun Y, Duan W, Wang S, Jin X. Vandetanib-induced inhibition of neuroblastoma cell migration and invasion is associated with downregulation of the SDF-1/CXCR4 axis and matrix metalloproteinase 14. Oncol Rep. 2014;31:1165–1174. doi: 10.3892/or.2013.2963. [DOI] [PubMed] [Google Scholar]
- 26.Geissler C, Hambek M, Eckardt A, Arnoldner C, Diensthuber M, Stöver T, Wagenblast J. The role of recombinant epidermal growth factor and serotonin in the stimulation of tumor growth in a SCCHN xenograft model. Oncol Rep. 2012;28:785–790. doi: 10.3892/or.2012.1903. [DOI] [PMC free article] [PubMed] [Google Scholar]
- 27.Rioux-Leclercq N, Turlin B, Bansard J, Patard J, Manunta A, Moulinoux JP, Guillé F, Ramée MP, Lobel B. Value of immunohistochemical Ki-67 and p53 determinations as predictive factors of outcome in renal cell carcinoma. Urology. 2000;55:501–505. doi: 10.1016/s0090-4295(99)00550-6. [DOI] [PubMed] [Google Scholar]
- 28.Nan L, Kawamata H, Tan X, Kameyama S, Oyasu R. Differential expression of keratin 5 gene in non-tumorigenic and tumorigenic rat bladder cell lines. Cancer Lett. 1993;75:87–93. doi: 10.1016/0304-3835(93)90192-c. [DOI] [PubMed] [Google Scholar]
- 29.Ricciardelli C, Lokman NA, Pyragius CE, Ween MP, Macpherson AM, Ruszkiewicz A, Hoffmann P, Oehler MK. Keratin 5 overexpression is associated with serous ovarian cancer recurrence and chemotherapy resistance. Oncotarget. 2017;8:17819–17832. doi: 10.18632/oncotarget.14867. [DOI] [PMC free article] [PubMed] [Google Scholar]
- 30.Meng FJ, Meng FM, Wu HX, Cao XF. miR-564 inhibited metastasis and proliferation of prostate cancer by targeting MLLT3. Eur Rev Med Pharmacol Sci. 2017;21:4828–4834. [PubMed] [Google Scholar]
- 31.Mutlu M, Saatci O, Ansari SA, Yurdusev E, Shehwana H, Konu Ö, Raza U, Şahin Ö. miR-564 acts as a dual inhibitor of PI3K and MAPK signaling networks and inhibits proliferation and invasion in breast cancer. Sci Rep. 2016;6:32541. doi: 10.1038/srep32541. [DOI] [PMC free article] [PubMed] [Google Scholar]
- 32.Liang C, Xu Y, Ge H, Xing B, Li G, Wu J. miR-564 inhibits hepatocellular carcinoma cell proliferation and invasion by targeting the GRB2-ERK1/2-AKT axis. Oncotarget. 2017;8:107543–107557. doi: 10.18632/oncotarget.22504. [DOI] [PMC free article] [PubMed] [Google Scholar]
- 33.Yang B, Jia L, Guo Q, Ren H, Hu D, Zhou X, Ren Q, Hu Y, Xie T. MiR-564 functions as a tumor suppressor in human lung cancer by targeting ZIC3. Biochem Biophys Res Commun. 2015;467:690–696. doi: 10.1016/j.bbrc.2015.10.082. [DOI] [PubMed] [Google Scholar]
- 34.Wang Q, Huang Z, Ni S, Xiao X, Xu Q, Wang L, Huang D, Tan C, Sheng W, Du X. Plasma miR-601 and miR-760 are novel biomarkers for the early detection of colorectal cancer. PLoS One. 2012;7:e44398. doi: 10.1371/journal.pone.0044398. [DOI] [PMC free article] [PubMed] [Google Scholar]
- 35.Zeng W, Tu Y, Zhu Y, Wang Z, Li C, Lao L, Wu G. Predictive power of circulating miRNAs in detecting colorectal cancer. Tumour Biol. 2015;36:2559–2567. doi: 10.1007/s13277-014-2872-2. [DOI] [PubMed] [Google Scholar]
- 36.Hu JY, Yi W, Wei X, Zhang MY, Xu R, Zeng LS, Huang ZJ, Chen JS. miR-601 is a prognostic marker and suppresses cell growth and invasion by targeting PTP4A1 in breast cancer. Biomed Pharmacother. 2016;79:247–253. doi: 10.1016/j.biopha.2016.02.014. [DOI] [PubMed] [Google Scholar]
- 37.Wang Y, Yang QW, Yang Q, Zhou T, Shi MF, Sun CX, Gao XX, Cheng YQ, Cui XG, Sun YH. Cuprous oxide nanoparticles inhibit prostate cancer by attenuating the stemness of cancer cells via inhibition of the Wnt signaling pathway. Int J Nanomedicine. 2017;12:2569–2579. doi: 10.2147/IJN.S130537. [DOI] [PMC free article] [PubMed] [Google Scholar]
- 38.Wang L, Dehm SM, Hillman DW, Sicotte H, Tan W, Gormley M, Bhargava V, Jimenez R, Xie F, Yin P, Qin S, Quevedo F, Costello BA, Pitot HC, Ho T, Bryce AH, Ye Z, Li Y, Eiken P, Vedell PT, Barman P, McMenomy BP, Atwell TD, Carlson RE, Ellingson M, Eckloff BW, Qin R, Ou F, Hart SN, Huang H, Jen J, Wieben ED, Kalari KR, Weinshilboum RM, Wang L, Kohli M. A prospective genome-wide study of prostate cancer metastases reveals association of wnt pathway activation and increased cell cycle proliferation with primary resistance to abiraterone acetate-prednisone. Ann Oncol. 2018;29:352–360. doi: 10.1093/annonc/mdx689. [DOI] [PMC free article] [PubMed] [Google Scholar]
- 39.Barr RD, Ries LA, Lewis DR, Harlan LC, Keegan TH, Pollock BH, Bleyer WA US National Cancer Institute Science of Adolescent and Young Adult Oncology Epidemiology Working Group. Incidence and incidence trends of the most frequent cancers in adolescent and young adult Americans, including “nonmalignant/noninvasive” tumors. Cancer. 2016;122:1000–1008. doi: 10.1002/cncr.29867. [DOI] [PubMed] [Google Scholar]
- 40.Seisen T, Roupret M, Gomez F, Malouf GG, Shariat SF, Peyronnet B, Spano JP, Cancel-Tassin G, Cussenot O. A comprehensive review of genomic landscape, biomarkers and treatment sequencing in castration-resistant prostate cancer. Cancer Treat Rev. 2016;48:25–33. doi: 10.1016/j.ctrv.2016.06.005. [DOI] [PubMed] [Google Scholar]
- 41.Breyer J, Wirtz RM, Erben P, Rinaldetti S, Worst TS, Stoehr R, Eckstein M, Sikic D, Denzinger S, Burger M, Hartmann A, Otto W. FOXM1 overexpression is associated with adverse outcome and predicts response to intravesical instillation therapy in stage pT1 non-muscle-invasive bladder cancer. BJU Int. 2019;123:187–196. doi: 10.1111/bju.14525. [DOI] [PubMed] [Google Scholar]
- 42.Berens EB, Sharif GM, Schmidt MO, Yan G, Shuptrine CW, Weiner LM, Glasgow E, Riegel AT, Wellstein A. Keratin-associated protein 5-5 controls cytoskeletal function and cancer cell vascular invasion. Oncogene. 2017;36:593–605. doi: 10.1038/onc.2016.234. [DOI] [PMC free article] [PubMed] [Google Scholar]
- 43.Wang CC, Bajikar SS, Jamal L, Atkins KA, Janes KA. A time- and matrix-dependent TGFBR3-JUND-KRT5 regulatory circuit in single breast epithelial cells and basal-like premalignancies. Nat Cell Biol. 2014;16:345–356. doi: 10.1038/ncb2930. [DOI] [PMC free article] [PubMed] [Google Scholar]
- 44.de Bessa Garcia SA, Pavanelli AC, Cruz E Melo N, Nagai MA. Prostate apoptosis response 4 (PAR4) expression modulates WNT signaling pathways in MCF7 breast cancer cells: a possible mechanism underlying PAR4-mediated docetaxel chemosensitivity. Int J Mol Med. 2017;39:809–818. doi: 10.3892/ijmm.2017.2900. [DOI] [PMC free article] [PubMed] [Google Scholar]
- 45.Wang Y, Yang QW, Yang Q, Zhou T, Shi MF, Sun CX, Gao XX, Cheng YQ, Cui XG, Sun YH. Cuprous oxide nanoparticles inhibit prostate cancer by attenuating the stemness of cancer cells via inhibition of the Wnt signaling pathway. Int J Nanomedicine. 2017;12:2569–2579. doi: 10.2147/IJN.S130537. [DOI] [PMC free article] [PubMed] [Google Scholar]
- 46.Li R, Quan Y, Xia W. SIRT3 inhibits prostate cancer metastasis through regulation of FOXO3A by suppressing Wnt/beta-catenin pathway. Exp Cell Res. 2018;364:143–151. doi: 10.1016/j.yexcr.2018.01.036. [DOI] [PubMed] [Google Scholar]
- 47.Ridge SM, Bhattacharyya D, Dervan E, Naicker SD, Burke AJ, Murphy JM, O’leary K, Greene J, Ryan AE, Sullivan FJ, Glynn SA. Secreted factors from metastatic prostate cancer cells stimulate mesenchymal stem cell transition to a pro-tumourigenic ‘activated’ state that enhances prostate cancer cell migration. Int J Cancer. 2018;142:2056–2067. doi: 10.1002/ijc.31226. [DOI] [PubMed] [Google Scholar]
- 48.Liu C, Liu R, Zhang D, Deng Q, Liu B, Chao HP, Rycaj K, Takata Y, Lin K, Lu Y, Zhong Y, Krolewski J, Shen J, Tang DG. MicroRNA-141 suppresses prostate cancer stem cells and metastasis by targeting a cohort of pro-metastasis genes. Nat Commun. 2017;8:14270. doi: 10.1038/ncomms14270. [DOI] [PMC free article] [PubMed] [Google Scholar]
- 49.Lai X, Guo Y, Guo Z, Liu R, Wang X, Wang F. Downregulation of microRNA574 in cancer stem cells causes recurrence of prostate cancer via targeting REL. Oncol Rep. 2016;36:3651–3656. doi: 10.3892/or.2016.5196. [DOI] [PubMed] [Google Scholar]
- 50.Liu N, Mei L, Fan X, Tang C, Ji X, Hu X, Shi W, Qian Y, Hussain M, Wu J, Wang C, Lin S, Wu X. Phosphodiesterase 5/protein kinase G signal governs stemness of prostate cancer stem cells through Hippo pathway. Cancer Lett. 2016;378:38–50. doi: 10.1016/j.canlet.2016.05.010. [DOI] [PubMed] [Google Scholar]
- 51.Takehara M, Hoshino T, Namba T, Yamakawa N, Mizushima T. Acetaminophen-induced differentiation of human breast cancer stem cells and inhibition of tumor xenograft growth in mice. Biochem Pharmacol. 2011;81:1124–1135. doi: 10.1016/j.bcp.2011.02.012. [DOI] [PubMed] [Google Scholar]


