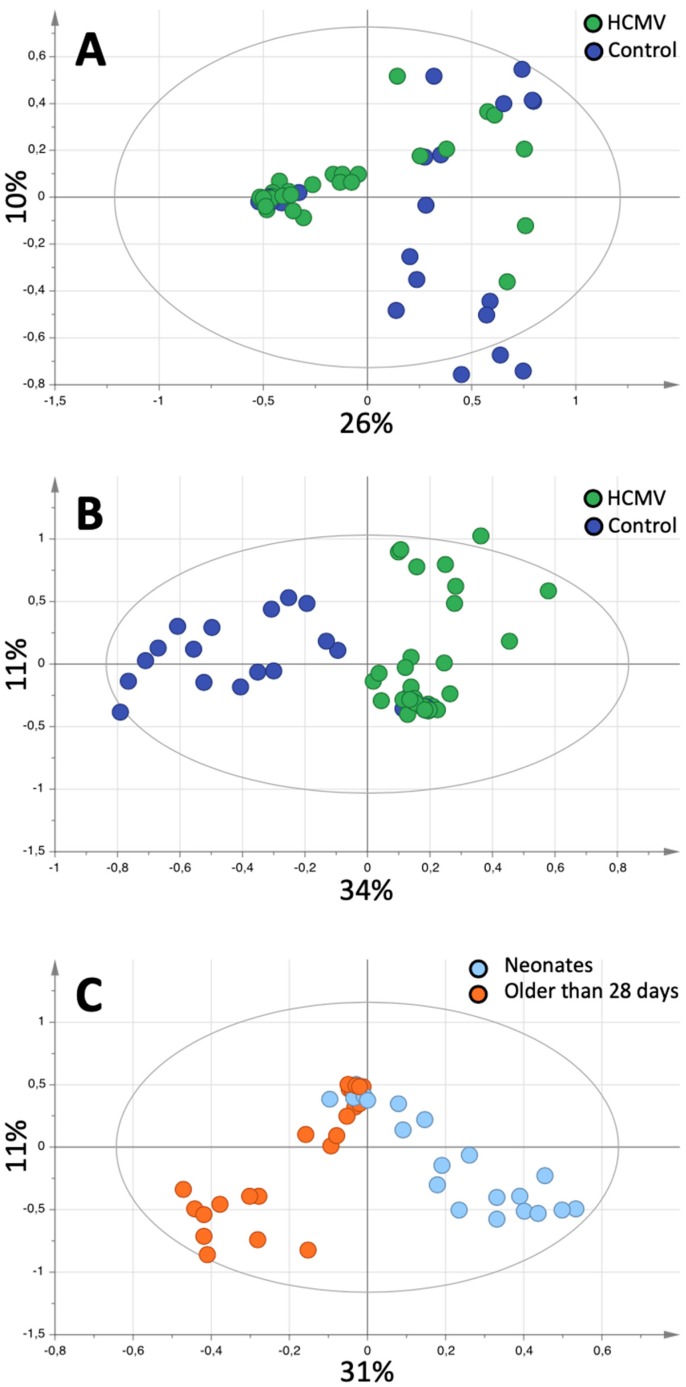
Figure 1.
Pattern recognition analysis of Human Cytomegalovirus (HCMV) infection fingerprinting. (A) Score plot of the Principal Component Analysis (PCA) of the spectra, colored according to HCMV infection (green) or controls (blue). (B) Score plot of the Orthogonal Projections to Latent Structures Discriminant Analysis (OPLS-DA) model differentiating between controls and HCMV-infected patients. (C) Corresponds to the score plot of the OPLS-DA analysis differentiating between neonates (light blue) and infants older than 28 days of life (orange). Each dot corresponds to a spectrum/sample/patient.

