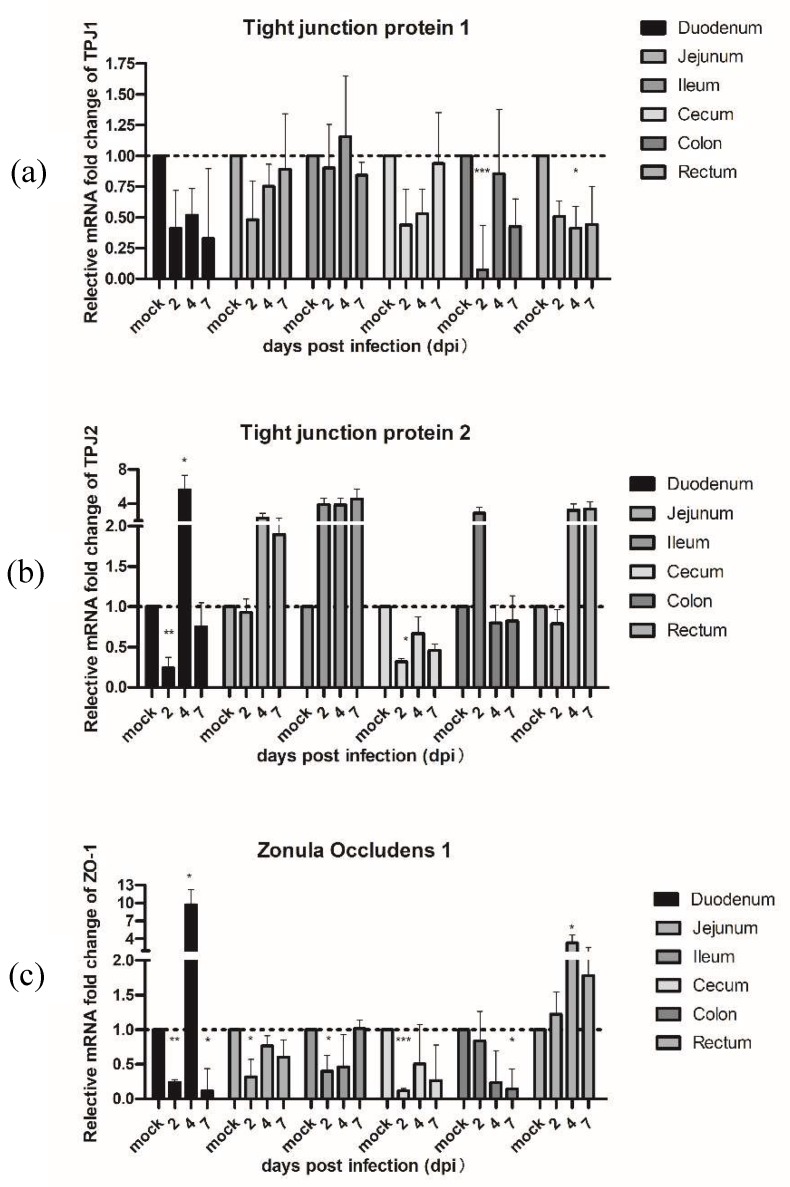
Figure 5.
Quantification of the mRNA expression levels of (a) tight junction protein 1 and (b) 2 and (c) zonula occludin 1 (ZO-1) by qRT-PCR in PAstV-challenged piglets at different days after infection. The qRT-PCR values with primers (Table S1) for different cytokines were normalized with endogenous β-actin mRNA levels on each day post infection. The fold change of relative gene expression levels was calculated using the formula: 2 − (ΔCt of gene − ΔCt of β-actin). Data represent the average of two independent samples from each piglet in the PAstV-challenged group and each sample was measured in triplicate. Error bars indicate standard deviations (SD). Asterisks show statistical significance as measured by the two-tailed Student t test as follows: *, **, and *** represent p < 0.05, p < 0.01, and p < 0.001, respectively.

