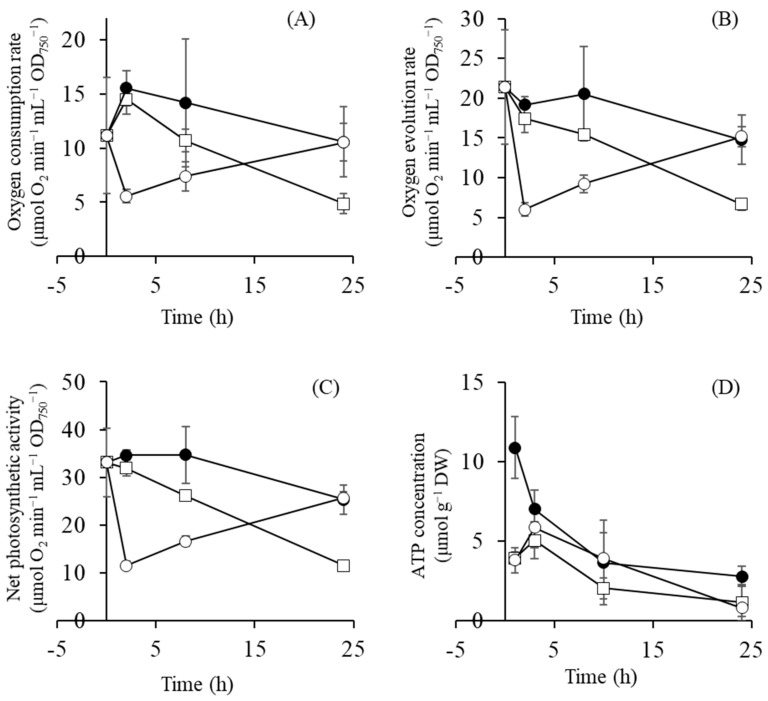
Figure 3.
Oxygen consumption rate (A), oxygen evolution rate (B), net photosynthetic activity (C), and ATP concentration (D) in Synechococcus sp. PCC 7002 cells cultivated in different media: without NaCl (control; open squares), with 0.5 M NaCl (filled circles), and with 1 M NaCl (open circles). Error bars indicate SD of three replicate experiments.

