

Abstract
Background
The difference in the predictive ability of the brachial‐ankle pulse wave velocity (baPWV) and its stiffness index β‐transformed value (β‐baPWV, ie, baPWV adjusted for the pulse pressure) for the development of pathophysiological abnormalities related to cardiovascular disease or future occurrence of cardiovascular disease was examined.
Methods and Results
In study 1, a 7‐year prospective observational study in cohorts of 3274 men and 3490 men, the area under the curve in the receiver operator characteristic curve analysis was higher for baPWV than for β‐baPWV for predicting the development of hypertension (0.73, 95% CI=0.70 to 0.75 versus 0.59, 95% CI=0.56 to 0.62; P<0.01) and/or the development of retinopathy (0.78, 95% CI=0.73 to 0.82 versus 0.66, 95% CI=0.60 to 0.71; P<0.01) by the end of the study period. During study 2, a 3‐year observation period on 511 patients with coronary artery disease, 72 cardiovascular events were confirmed. The C statistics of both markers for predicting the development of cardiovascular events were similar.
Conclusions
Stiffness index β transformation of the baPWV may attenuate the significance of the baPWV as a risk marker for development of pathophysiological abnormalities related to cardiovascular disease in male subjects.
Keywords: arterial stiffness, blood pressure, hypertension, organ damage, stiffness index β
Subject Categories: Hypertension
Clinical Perspective
What Is New?
Stiffness index β transformation of the brachial‐ankle pulse wave velocity attenuated the predictive value of brachial‐ankle pulse wave velocity for the development of pathophysiological abnormalities related to the development of cardiovascular disease (ie, hypertension and retinopathy).
What Are the Clinical Implications?
Based on the evidence available at present, adjustment of brachial‐ankle pulse wave velocity for the blood pressure to predict the development of pathophysiological abnormalities related to the development of cardiovascular disease (ie, hypertension and retinopathy) may have no merit as compared with using the absolute value of the brachial‐ankle pulse wave velocity.
Further studies are needed to clarify whether the blood pressure–adjusted pulse wave velocity is a better predictor than the unadjusted pulse wave velocity of the risk of development of cardiovascular disease.
Introduction
Arterial stiffness is a marker of atherosclerotic vascular damage and is also an independent predictor of development of risk of cardiovascular disease (CVD) and also of future cardiovascular events.1 Stiffening of arteries is related not only to structural factors, such as atherosclerotic vascular damage, but also to functional factors, such as the blood pressure (BP).1 The pulse wave velocity (PWV) is commonly used as a marker of segmental arterial stiffness. In addition, stiffness index β has also been used as a marker of regional arterial stiffness in several studies, and this marker has been reported to be a useful predictor of the development of hypertension or stroke.2, 3, 4 PWV is calculated as the distance between the points of detection of the pulse wave divided by the time taken for transmission of the pulse wave between the 2 points, and stiffness index β is calculated as the difference of the arterial diameter between diastole and systole divided by the pulse pressure.1, 2, 3, 4 Mathematically, in contrast to PWV, stiffness index β is less influenced by the BP.5 Thus, 1 of the limitations of using the PWV is that it is highly dependent on the operational mean BP,6 and it has been suggested that interpretation of the arterial stiffness based on the PWV may be limited by the nonlinear pressure‐elastic behavior of the arteries.7
Although adjustment of the PWV for the mean BP has been proposed as an approach to overcome this limitation,8 this approach has not yet been fully accepted in clinical practice. Recently, a marker determined by stiffness index β transformation of the PWV, namely the cardio‐ankle vascular index (CAVI) (ie, the heart‐ankle PWV adjusted for the pulse pressure), has been used not only in Asian countries but also in many other countries (ie, European countries and the United States).9, 10, 11, 12, 13 This index is less influenced by the BP as compared with the PWV.9 An aggravated‐data meta‐analysis revealed that this parameter is an independent predictor of the future development of cardiovascular events.13 If one were to consider the concept of the nonlinear pressure‐elastic behavior of the arteries in the risk assessment for CVD by measurement of the PWV to measure the arterial stiffness, then stiffness index β–transformed PWV could perhaps improve the reliability of the PWV as a risk marker for the development of CVD. On the other hand, if one were to consider that arterial stiffness derived from functional factors additionally affects the risk assessment for CVD, then PWV without stiffness index β transformation might be a better predictor of the development of CVD.
In addition to the carotid‐femoral PWV, a conventionally used marker,1, 14 especially in Asian countries, measurement of the brachial‐ankle PWV (baPWV) has also been shown to be a useful risk marker for the development of hypertension, chronic kidney disease, and future cardiovascular events.1, 15, 16, 17 The present study was conducted to examine the difference in the predictive ability of the baPWV and its stiffness index β–transformed value (β‐baPWV) for future occurrence of CVD.12 In the same study cohorts as those included in our previous studies,15, 16, 18 we examined whether the β‐baPWV had a better or worse predictive ability than the baPWV value for the development of pathophysiological abnormalities related to the risk of development of CVD or future cardiovascular events.
Methods
Data Sharing
The data, analytical methods, and study materials will not be made available to other researchers for the purpose of reproducing the results or replicating the procedure.
Design and Subjects
The present study was conducted in 2 cohorts: the first comprised employees working at the headquarters of a single large Japanese construction company, in which the association of the arterial stiffness with the development of hypertension or organ damage was examined15, 16; the other was a cohort of patients with coronary artery disease (CAD), who were the subjects of a multicenter prospective observational study, in whom the association of the arterial stiffness with the future development of cardiovascular events was examined.17 The findings of these studies have already been reported elsewhere.15, 16, 17
Design and Subjects Included for Evaluation of Hypertension Development or Subclinical Organ Damage
According to the Occupational Health and Safety Law in Japan, it is mandatory for all company employees to undergo annual health checkups. For employees working at the headquarters of a single large Japanese construction company located in downtown Tokyo, the baPWV is also measured annually. Informed consent was obtained from all the study participants before their participation in this study. The study was conducted with the approval of the Ethical Guidelines Committee of Tokyo Medical University (No. 209 and No. 210 in 2003).
We conducted our present study on the basis of the health checkup data of the subjects obtained for the years 2007 to 2015. The details are reported elsewhere.15 Of a total of 5857 subjects who were working at the headquarters of the company, subjects who fulfilled at least 1 of the following exclusion criteria were excluded: measurement of the baPWV conducted only once during the study period, unreliable accuracy of the measured baPWV (ankle/brachial systolic BP index <0.95 and/or presence of atrial fibrillation), current history of hemodialysis, heart disease, and/or cerebrovascular disease. The total study period was 8 years, but some of the subjects were withdrawn from the study because of transfer from the company headquarters to branch offices, layoffs, retirement, and so forth (ie, the study period was shorter in those subjects). Therefore, the mean study period was determined to be 6.4 years.
Of the remaining 4689 subjects, the data on the 3274 men who were not taking any antihypertensive medication and whose BP was categorized as being in the normal range (ie, <140/90 mm Hg) at the start of the study period were included in the analysis of the risk factors for the development of hypertension (Figure 1).15 In addition, the data on the remaining 3490 men without proteinuria or retinopathy in whom the estimated glomerular filtration rate was ≥60 mL/min per 1.73 m2 at the study baseline were included in the analysis of the risk factors for the development of renal damage and retinopathy (Figure 1).
Figure 1.
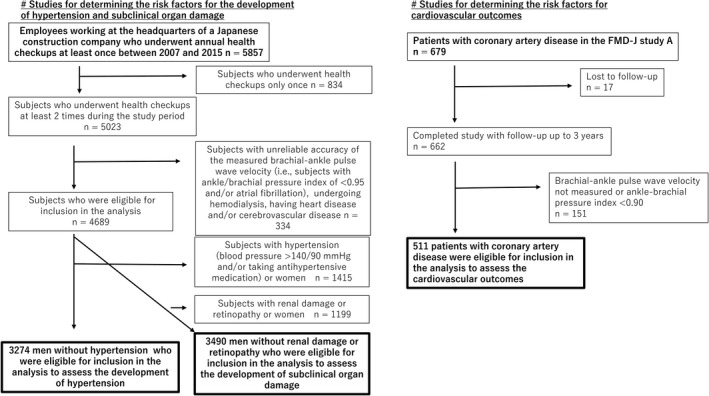
Flow diagram of subject enrollment in the study. FMD‐J indicates Flow‐Mediated Dilation Japan.
Design and Subjects Included for Evaluation of Prognosis of Coronary Artery Disease
The present 3‐year study (May 2010 to September 2012) was conducted as part of a previously reported prospective multicenter observational cohort study, which was conducted with the participation of 22 university hospitals and affiliated clinics in Japan, to examine the usefulness of vascular function tests (ie, to assess endothelial function or arterial stiffness) in the management of Japanese patients with CAD. The details are reported elsewhere.18, 19 The original study was conducted in subjects whose flow‐mediated vasodilatation data were available, but the present study was conducted in subjects whose baPWV data were available, regardless of the availability of the data on flow‐mediated vasodilatation. Patients with ankle/brachial systolic BP index values of <0.90 were excluded (Figure 1). The ethical guidelines committees of the participating institutions approved the study protocol. Informed consent for participation in the study was obtained from all subjects. The protocol is registered in the University Hospital Medical Information Network Clinical Trials Registry (UMIN000012950).
Study Outcomes
In the present study we assessed 4 outcomes (ie, new onset of hypertension, decline of the estimated glomerular filtration rate to <60 mL/min per 1.73 m2 [eGFR <60] or new onset of proteinuria or ≥15% decrease of the eGFR from the baseline to the end of the study period, new onset of retinopathy, and development of cardiovascular events during the study period); these outcomes were defined as follows:
Hypertension: systolic BP (SBP) ≥140 mm Hg and/or diastolic BP (DBP) ≥90 mm Hg and/or a history of the subject receiving antihypertensive drug therapy at the time of the annual health checkups.
eGFR: the eGFR was estimated by the Chronic Kidney Disease Epidemiology Collaboration equation.20
Proteinuria: urinary dipstick test result ≥1+(urinary protein concentration ≥30 mg/dL).16
Retinopathy: Based on fundus photographs, hypertensive (H stage H0, H1, H2, H3, H4) and arteriosclerotic (S: S0, S1, S2, S3) changes of both fundi evaluated according to the Scheie classification. Then, retinopathy was defined as the presence of any abnormal changes (H1‐4, or S1‐3), that is, the presence of either hypertensive or arteriosclerotic changes.
Cardiovascular events: A composite of coronary events (fatal or nonfatal myocardial infarction, coronary artery restenosis, and de novo coronary artery stenosis as confirmed by diagnostic imaging), stroke, heart failure, or sudden death were defined as cardiovascular events. The details are described elsewhere.18 All cardiovascular events were reported annually by each institution to the Efficacy Endpoint Review Committee. The Committee, consisting of members blinded to information about the patients, assessed the appropriateness of the clinical judgment of the cardiovascular events according to prespecified criteria.
BP Measurements
Brachial BP was measured as the mean of 2 measurements obtained in an office setting by the conventional cuff method using a mercury sphygmomanometer. These measurements were conducted by well‐trained nurses. Both measurements were performed on the same occasion with the subjects in a seated position after they had rested for at least 5 minutes.
Measurement of baPWV and Calculation of BP‐Adjusted baPWV
The baPWV was measured using a volume‐plethysmographic apparatus (Form/ABI, Omron Healthcare Co, Ltd, Kyoto, Japan), as previously described.15, 16, 17, 21 Briefly, occlusion cuffs connected to both the plethysmographic and oscillometric sensors were tied around both the upper arms and above the ankles of subjects lying in the supine position. The brachial and posttibial arterial pressures were measured by an oscillometric sensor. Measurements were conducted after the subjects had rested for at least 5 minutes in the supine position in an air‐conditioned room (maintained at 24°C) designated exclusively for this study. The duration of sampling of the pressure waveform was 10 seconds.
Recently, a method to calculate the BP‐adjusted PWV (ie, CAVI) has been partially developed.12 The stiffness index β‐transformed baPWV was calculated using the following formulas12:
SBPpwv and DBPpwv = Systolic and diastolic blood pressures measured at the time of measurement of the baPWV.
Fundus Findings
At the first health checkup (baseline), nonmydriatic macula‐centered fundus photographs of the posterior pole were taken using a fundus camera (AFC‐330; Nihon Koden Co, Ltd, Tokyo, Japan). All photographs were evaluated in a blinded manner by professional ophthalmologists.
Laboratory Measurements and eGFR
Serum concentrations of triglyceride, total cholesterol, low‐density lipoprotein cholesterol, high‐density lipoprotein cholesterol, and creatinine, as well as the plasma glucose concentrations and glycohemoglobin A1c levels were measured using standard enzymatic methods.
All blood samples were obtained in the morning after the patients had fasted overnight.
Diabetes Mellitus and Metabolic Syndrome
Diabetes mellitus was defined as a blood glycohemoglobin level of ≥6.5% and/or patient under medication for diabetes mellitus. We adopted the modified criteria of the Japanese Expert Committee on the Diagnosis and Classification of Metabolic Syndrome for the clinical diagnosis of metabolic syndrome22; namely, central obesity (body mass index >25), plus at least 2 of the following 3 criteria: dyslipidemia (hypertriglyceridemia ≥1.70 mmol/L and/or high‐density lipoprotein cholesterol<1.03 mmol/L), elevated BP (≥130/85 mm Hg), and elevated plasma glucose (≥6.11 mmol/L).
Statistical Analyses
Data are expressed as means±SD unless otherwise indicated. For assessment of the differences in a variable between 2 groups, the t test was applied. To examine the discrimination ability for the binary outcomes, we plotted receiver‐operating characteristic (ROC) curves, and the areas under the curves (AUCs) in the ROC curve analyses were compared. For censored survival data, the discrimination was evaluated by Harrell c‐statistics, accounting for censoring. Although this evaluation was fundamentally based on data obtained from annual health checkups, some subjects skipped the annual health checkups conducted at the company headquarters. Therefore, the mean duration of follow‐up was 6.44 years for the development of hypertension (n=3274) and 6.42 years for the development of subclinical organ damage (n=3490), and the mean number of times that the variables were measured was 5.24 in the former and 5.22 in the latter category. Thus, because the times to events were not determined for these outcomes, logistic regression analyses using a forward selection method were applied to determine the associations of the baPWV and β‐baPWV measured at the start of the study period with the outcomes. On the other hand, the associations of the baPWV and β‐baPWV at the start of the study period with the development of cardiovascular events during the study period were also assessed by the Cox proportional‐hazard regression models using a forward selection method, in which the cohort effect was adjusted for as a fixed effect by taking each cohort as a strata variable. The proportional‐hazard assumption was explored through the log‐negative‐log of survival function versus the log of time, and there was no evidence that the proportional‐hazard assumption was violated for either baPWV or β‐baPWV. The baPWV was closely correlated with the β‐baPWV (R=0.94, P<0.01), and, therefore, to avoid the effect of multiple colinearities, we did not enter the baPWV and β‐baPWV simultaneously in the same model of logistic regression analysis or the same Cox proportional‐hazards regression analysis model.
Covariates adjusted for in model A included the age, body mass index, current smoking history, current daily alcohol intake, mean BP, heart rate, serum levels of low‐density lipoprotein cholesterol, high‐density lipoprotein cholesterol, triglycerides, uric acid, creatinine, history of medication use for dyslipidemia, hypertension, and/or hyperuricemia (for each category: not receiving medication=0, receiving medication=1), and diabetes mellitus (absence of diabetes mellitus=0, and its presence=1). Covariates adjusted for in model B included the age, current smoking history, current daily alcohol intake, heart rate, serum levels of low‐density lipoprotein cholesterol, uric acid, and creatinine, history of medication use for dyslipidemia and/or hyperuricemia (for each category: not receiving medication=0, receiving medication=1), and metabolic syndrome (absence of metabolic syndrome=0, and its presence=1). Covariates adjusted for in model C included the age, sex, body mass index, mean BP, smoking history, left ventricular ejection fraction, serum level of brain natriuretic peptide, and history of medication use for hypertension, dyslipidemia, and/or diabetes mellitus, as reported previously.13 Model A and model B were applied for identifying predictors of new onset of hypertension (in this case, the family history of hypertension was added as an additional covariate), decline of eGFR to <60 or new onset of proteinuria, ≥15% decrease of the eGFR from the baseline to the end of the study period, and new onset of retinopathy, and model C for identifying predictors of the development of cardiovascular events.
The analyses were conducted using SPSS software (version 25.0; IBM/SPSS Inc, Armonk, NY) and Stata software (release 13; StataCorp, College Station, TX). Comparisons of the AUCs in the ROC curve analyses were conducted using JMP Pro 12 software (SAS, Cary, NC); P<0.05 was considered as denoting statistical significance in all of the statistical tests.
Results
Table 1 shows the clinical characteristics of the study subjects at the start of study period in each of the study cohorts. The baPWV and BP‐adjusted baPWV were higher in the subjects with CAD than in the subjects without CAD who were included for examination of the development of hypertension, and they were also higher than in those who were included for examination of subclinical organ damage by the end of the study period.
Table 1.
Clinical Characteristics of Study Subjects at Start of Study
| Parameter | For Assessment of the Development of Hypertension | For Assessment of Organ Damage | For Assessment of Prognosis in Patients With CAD |
|---|---|---|---|
| Number | 3274 | 3490 | 511 |
| Age, y | 42±9 | 43±9 | 64±9 |
| Sex, men/women | 3274/0 | 3490/0 | 432/79 |
| BMI, kg/m2 | 23.7±2.9 | 23.9±3.0 | 24.8±3.6 |
| Smoking (current), % | 1055 (32.2) | 1111 (31.8) | … |
| Hx of smoking, % | … | … | 337 (68.2)a |
| Alcohol drinking (current), n (%) | 2787 (85.1) | 2988 (85.6) | 217 (45.4) |
| Ethanol, g/d | 12.2±10.8 | 12.7±10.9 | 11.1±18.1 |
| SBP, mm Hg | 120±10 | 123±13 | 130±17 |
| DBP, mm Hg | 72±8 | 75±10 | 75±11 |
| Heart rate, bpm | 67±9 | 65±9 | 67±12 |
| baPWV, m/s | 12.4±1.4 | 12.8±1.8 | 16.4±2.9 |
| β‐baPWV | 3.4±0.7 | 3.5±0.8 | 5.7±1.9 |
| SBPpwv, mm Hg | 121±11 | 124±14 | 129±16 |
| DBPpwv, mm Hg | 74±9 | 76±10 | 78±9 |
| TC, mmol/L | … | … | 4.43±0.81 |
| LDL, mmol/L | 3.18±0.78 | 3.08±0.80 | … |
| HDL, mmol/L | 1.62±0.40 | 1.61±0.40 | 1.32±0.34 |
| TG, mmol/L | 1.35±0.95 | 1.40±0.99 | 1.55±1.05 |
| FPG, mmol/L | 5.00±0.69 | 5.00±0.70 | 6.58±2.00 |
| HbA1c, % | 5.2±0.5 | 5.3±0.5 | … |
| UA, μmol/L | 365±73 | 367±72 | 348±77 |
| Crnn, μmol/L | 75±9 | 75±9 | 75±22 |
| eGFR, mL/min per 1.73 m2 | … | 86±8 | … |
| DM, % | 81 (2.5) | 108 (3.1) | |
| MetS, % | 162 (4.9) | 277 (7.9) | |
| Prior myocardial infarction, % | … | … | 254 (49.7) |
| Prior coronary intervention, % | … | … | 426 (83.4) |
| BNP, pg/mL | … | … | 36±60 |
| Ejection fraction, % | … | … | 61±10 |
| Medications | |||
| Receiving medication for hypertension, % | 0 | 203 (5.8) | 468 (91.6) |
| Receiving medication for dyslipidemia, % | 56 (1.7) | 77 (2.2) | 474 (92.8) |
| Receiving medication for diabetes mellitus, % | 44 (1.3) | 63 (1.8) | 153 (29.9) |
| Receiving medication for hyperuricemia, % | 112 (3.4) | 138 (4.0) | … |
Alcohol drinking indicates number of current drinkers; baPWV, brachial‐ankle pulse wave velocity; β‐baPWV, stiffness index β–transformed brachial‐ankle pulse wave velocity; BMI, body mass index; BNP, brain natriuretic peptide; CAD, coronary artery disease; Crnn, serum creatinine; DBP, diastolic blood pressure; DBPpwv, diastolic blood pressure at the time of measurement of the baPWV; DM, number of subjects with diabetes mellitus; eGFR, estimated glomerular filtration rate by the Chronic Kidney Disease Epidemiology Collaboration equation; Final, at the end of the observation period; FPG, fasting plasma glucose; HbA1c, glycated hemoglobin A1c; HDL, serum high‐density lipoprotein cholesterol; Hx of smoking, history of smoking; LDL, serum low‐density lipoprotein cholesterol; Medications, number and percentage of subjects receiving medication(s); MetS, number of subjects with metabolic syndrome; prior myocardial infarction, number of subjects with a past history of myocardial infarction; prior myocardial intervention, number of subjects with a past history of percutaneous coronary intervention; SBP, systolic blood pressure; SBPpwv, systolic blood pressure at the time of measurement of the baPWV; smoking, number of current smokers; start, at the start of the observation period; TC, total cholesterol; TG, serum triglyceride; UA, uric acid.
Data on smoking were not available for 17 subjects.
Results of ROC Curve Analyses
Among the study subjects who did not have hypertension at the start of the study period (n=3274), 474 (14.5%) developed hypertension during the study period, as we reported in our previous report.15 The AUCs in the ROC curve analyses are summarized in Figure 2. The AUC of the baPWV was 0.73 (95% CI=0.70‐0.75), and the values for the β‐baPWV and the variable obtained by dividing the baPWV by the mean BP were 0.59 (0.56‐0.62) and 0.50 (0.47‐0.53), respectively. The AUC of the baPWV for predicting the development of hypertension was significantly larger than that of the β‐baPWV (difference in AUC=0.14, 95% CI=0.13‐0.15, P<0.01). The BP and age may exert an influence on the association of the arterial stiffness with the risk of development of hypertension.23, 24 When the subjects were divided into 3 tertiles according to the values of the mean BP at the start of the study period, the AUC of the baPWV for predicting the development of hypertension was 0.74 (95% CI=0.65‐0.83), and that of the β‐baPWV was 0.60 (95% CI=0.50‐0.70). Thus, although their 95% CIs overlapped, the AUC of the baPWV was significantly larger than that of the β‐baPWV (difference=0.14, 95% CI=0.07‐0.20, P<0.01). When the subjects were divided into 3 tertiles according to the age at the start of the study period, we found that even in the lowest age tertile (ie, patients aged <37 years old), the AUC of the baPWV (AUC=0.65, 95% CI=0.58‐0.72) for predicting the development of hypertension was significantly larger than that of the β‐baPWV (AUC=0.48, 95% CI=0.40‐0.55) (P<0.01).
Figure 2.
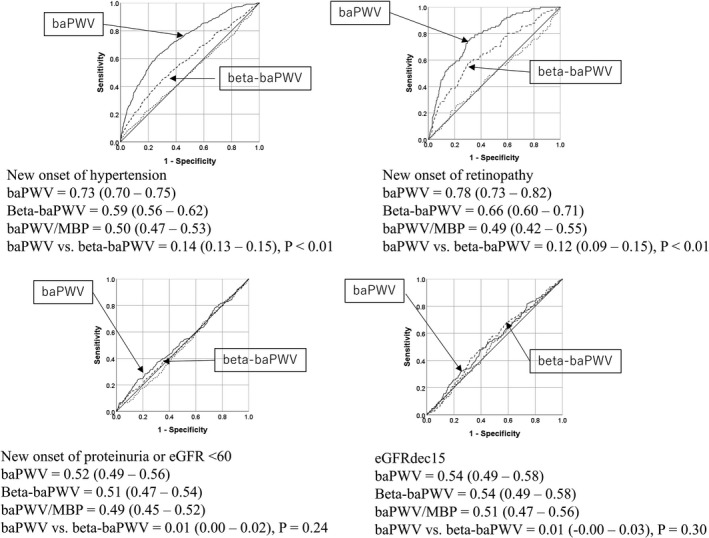
The areas under the curve in the receiver‐operator characteristic curve analysis. baPWV indicates brachial‐ankle pulse wave velocity; β‐baPWV, stiffness index β–transformed brachial‐ankle pulse wave velocity; dashed line, area under curve of the variable obtained by dividing the brachial‐ankle pulse wave velocity by the mean blood pressure; dashed line, with arrow, the areas under the curve of stiffness index β– transformed brachial‐ankle pulse wave velocity; eGFR <60 or proteinuria, estimated glomerular filtration rate <60 mL/min per 1.73 m2 or proteinuria; eGFRdec15, ≥15% decrease of eGFR from the baseline to end of study period; solid line with arrow, areas under the curve of the baPWV.
Among the study subjects who did not have renal damage or retinopathy at the start of the study period (n=3490), 250 developed proteinuria or decline of the eGFR to <60 (225 developed proteinuria and 29 showed a decline of the eGFR to <60), 161 had eGFR decreased by 15, and 91 developed retinopathy during the study period. The AUCs in the ROC curve analyses are summarized in Figure 2. The AUC of the baPWV for predicting the development of retinopathy was significantly larger than that of the β‐baPWV (difference in AUC=0.12, 95% CI=0.09‐0.15, P<0.01). On the other hand, the AUCs of the 2 markers for (1) the development of proteinuria, (2) decline of the eGFR to <60, or (3) ≥15% decrease of the eGFR from the baseline to the end of the study period were not significantly different (Figure 2).
Among the patients with coronary artery disease (n=511), 72 developed cardiovascular events (sudden death=2, stroke=4, cardiac events=66) during the study period. There was no significant difference in the C statistics of baPWV and β‐baPWV for predicting the development of cardiovascular events (difference=0.01, 95% CI=−0.01‐0.03, P=0.21) (Table 2).
Table 2.
Discrimination Statistics for Cardiovascular Events
| Variable | C Statistic | 95% CI |
|---|---|---|
| baPWV | 0.58 | 0.51 to 0.65 |
| β‐baPWV | 0.57 | 0.49 to 0.64 |
| baPWV/MBP | 0.53 | 0.45 to 0.60 |
| baPWV vs β‐baPWV | ΔC statistic | 95% CI |
| 0.01 | −0.01 to 0.03 | |
| P=0.21 | ||
baPWV indicates brachial‐ankle pulse wave velocity; baPWV/MBP = the variable obtained by dividing the brachial‐ankle pulse wave velocity by the mean blood pressure; β‐baPWV, stiffness index β–transformed brachial‐ankle pulse wave velocity; BP, blood pressure; MBP, mean BP.
The baPWV/mean BP showed no discrimination ability for any of the outcomes (Figure 2 and Table 2).
Results of Logistic Regression Analyses
In the present study we compared the predictive ability of the baPWV with that of the β‐baPWV for the development of hypertension by logistic regression analysis using a forward selection method. Both analyses using model A, and model B, in which family history of hypertension was used as an additional covariate, revealed a significant odds ratio of the baPWV as well as β‐baPWV for the development of hypertension (Table 3).
Table 3.
Results of Logistic Regression Analysis Using Forward Selection Method to Examine Predictive Values of baPWV and β‐baPWV
| Variable and Adjustments | Odds Ratio (per 1‐SD Increase) | 95% CI | P Value |
|---|---|---|---|
|
For new onset of hypertension Number of study subjects=3274 Number of subjects with new onset of hypertension=474 | |||
| Crude | |||
| baPWV | 2.76 | 2.43 to 3.14 | <0.01 |
| β‐baPWV | 1.47 | 1.33 to 1.63 | <0.01 |
| Model A+HxHBP | |||
| baPWV | 1.84 | 1.58 to 2.13 | <0.01 |
| β‐baPWV | 1.19 | 1.06 to 1.35 | <0.01 |
| Model B+HxHBP | |||
| baPWV | 2.08 | 1.80 to 2.42 | <0.01 |
| β‐baPWV | 1.14 | 1.01 to 1.28 | 0.03 |
|
For new onset of proteinuria or eGFR <60 Number of study subjects=3490 Number of subjects with new onset of proteinuria (225) or eGFR <60 (29) =total 250 | |||
| Crude | |||
| baPWV | 1.14 | 1.01 to 1.29 | 0.04 |
| β‐baPWV | 1.08 | 0.96 to 1.22 | 0.20 |
| Model A | |||
| baPWV | 1.01 | 0.85 to 1.20 | 0.92 |
| Model B | |||
| baPWV | 1.01 | 0.62 to 1.65 | 0.97 |
|
For eGFRdec15 Number of study subjects=3490 Number of subjects with eGFRdec15=161 | |||
| Crude | |||
| baPWV | 1.06 | 0.91 to 1.25 | 0.46 |
| β‐baPWV | 1.02 | 0.87 to 1.19 | 0.82 |
|
For new onset of retinopathy Number of study subjects=3490 Number of subjects with new onset of retinopathy=91 in a backward elimination model | |||
| Crude | |||
| baPWV | 1.98 | 1.70 to 2.29 | <0.01 |
| β‐baPWV | 1.50 | 1.29 to 1.74 | <0.01 |
| Model A | |||
| baPWV | 1.25 | 1.03 to 1.52 | 0.02 |
| β‐baPWV | … | … | 0.23 |
| Model B | |||
| baPWV | 1.93 | 1.66 to 2.25 | <0.01 |
| β‐baPWV | … | … | 0.09 |
baPWV indicates brachial‐ankle pulse wave velocity; β‐baPWV, stiffness index β–transformed brachial‐ankle pulse wave velocity; Crnn, serum creatinine; crude, without adjustment; eGFR <60, number of subjects with reduction of the estimated glomerular filtration rate calculated by the Chronic Kidney Disease Epidemiology Collaboration equation to <60 mL/min per 1.73 m2 by the end of the study period; eGFRdec15, 15% decrease of eGFR from the baseline to the end of the study period; HDL, high‐density lipoprotein cholesterol; HxHBP, family history of hypertension; LDL, low‐density lipoprotein cholesterol; model A, age, body mass index, current smoking, current daily alcohol intake, mean blood pressure, heart rate, LDL, HDL, TG, UA, Crnn, diabetes mellitus (HbA1c>6.5 and/or history of medication for diabetes mellitus), history of medication for dyslipidemia, hypertension, and/or hyperuricemia; model B, age, current smoking, current daily alcohol intake, heart rate, LDL, UA, Crnn, medication history for dyslipidemia and/or hyperuricemia, and metabolic syndrome; TG, serum triglyceride; UA, uric acid.
Logistic regression analyses using a forward selection method with adjustments for covariates (model A and model B) identified the baPWV, but not β‐baPWV, as showing a significant odds ratio for the development of retinopathy, although neither parameter showed significant odds ratios for any of the renal outcome variables (Table 3).
Results of Analyses Using Cox Proportional‐Hazards Model
Table 4 shows the results of analyses performed using a Cox proportional‐hazards model using a forward selection method to examine the predictive abilities of the baPWV and β‐baPWV for the development of cardiovascular events. Both baPWV and β‐baPWV showed significant hazard ratios for the development of cardiovascular events (Table 4).
Table 4.
Results of Analysis by Cox Proportional Hazards Model Using Forward Selection to Examine Predictive Values of baPWV and β‐Transformed baPWV for Cardiovascular Events
| Variable and Adjustments | Hazard Ratio (per 1‐SD Increase) | 95% CI | P Value |
|---|---|---|---|
|
For cardiovascular events Number of study subjects=511 Number of subjects with new cardiovascular events=72 (sudden death=2, Stroke=4, cardiac events=66) | |||
| Crude | |||
| baPWV | 1.33 | 1.07 to 1.66 | 0.01 |
| β‐baPWV | 1.31 | 1.04 to 1.64 | 0.03 |
| Model C | |||
| baPWV | 1.40 | 1.12 to 1.75 | <0.01 |
| β‐baPWV | 1.37 | 1.09 to 1.73 | <0.01 |
baPWV indicates brachial‐ankle pulse wave velocity; β‐baPWV, stiffness index β–transformed brachial‐ankle pulse wave velocity; model C, age, sex, body mass index, mean blood pressure, smoking history, left ventricular ejection fraction, serum level of brain natriuretic peptide, and history of medication for hypertension, dyslipidemia, and/or diabetes mellitus (the cohort effect was adjusted for as a fixed effect by taking each cohort as a strata variable).
Discussion
The significance of the PWV adjusted for BP as a marker of cardiovascular risk has not yet been fully clarified. Although several approaches have been proposed for adjustment of the PWV for BP,5, 6, 8, 12 the present study suggests that simply dividing the baPWV by the mean BP is not adequate for cardiovascular risk assessment. The present study demonstrates that the AUCs of the baPWV were significantly larger than those of the β‐baPWV (ie, stiffness index β–transformed baPWV) for predicting new onset of hypertension and new onset of retinopathy in healthy Japanese men.
Development of Hypertension
Arterial stiffness contributes to the development of hypertension, and several prospective studies have reported that both carotid‐femoral PWV and baPWV are predictors of the development of hypertension. In addition, a recent study has reported that the stiffness index β‐transformed heart‐ankle PWV (ie, CAVI) is also a predictor of the development of hypertension.25 In the present study the baPWV was found to be a better marker of the risk of development of hypertension than the β‐baPWV. It is well known that subjects with BP in the high normal range show a higher rate of development of hypertension as compared with subjects with BP in the normal range.23 BP increases the value of the baPWV. Therefore, it is plausible that the baPWV is a better marker than the β‐baPWV for predicting the development of hypertension. In the present study the mean BP was included as a covariate, and even in subjects with the mean BP in the lowest tertile at the start of the study period, the baPWV was found to be a better predictor of the development of hypertension. Furthermore, the trajectory for age and arterial stiffness has been demonstrated,24 but we confirmed our findings also in the youngest subjects (<37 years old) in this study cohort. These findings appear to lend support to the view that there is no merit to the current practice of stiffness β index transformation of the PWV for predicting the development of hypertension.
Development of Microvascular Damage
Increased arterial stiffness fails to attenuate the pulsatile energy within the blood vessels generated by cardiac contraction, which is then propagated to the peripheral microvasculature, causing microvascular damage.1, 26, 27, 28 Kario et al reported the existence of an association between the stiffness index β‐transformed heart‐ankle PWV (ie, CAVI) and the development of retinopathy.25 Our findings in the present study have demonstrated the baPWV to be a stronger predictor of new onset of retinopathy than the β‐baPWV. Thus, these findings may also underscore the limitation of the current practice of adjusting PWV for the BP to predict the progression of pulsatile microvasculopathy.
Our previous 3‐year follow‐up study demonstrated a significant association of the baPWV with the development of renal damage.16 However, the present 8‐year follow‐up study, failed to confirm the significance of that association. Further studies are needed to clarify whether increased arterial stiffness is a risk factor for the progression of renal damage in healthy Japanese subjects.
Cardiovascular Outcomes
The baPWV has been demonstrated to be an independent predictor of the prognosis in patients with CAD and also in those with stroke.18, 29, 30 In a previously reported study, although the number of study subjects was relatively small, the stiffness index β–transformed heart‐ankle PWV (ie, CAVI) was also identified as a predictor of the prognosis in patients with CAD.31 In the present study, the C statistics for the development of cardiovascular events, as also the hazard ratios for the development of cardiovascular events per 1 SD, were similar between the baPWV and the β‐baPWV. In addition, the β‐baPWV was significantly higher in patients with CAD than in middle‐aged healthy Japanese men. These findings led us to propose the hypothesis that, in subjects with increased structural arterial stiffness, the contribution of functional arterial stiffness to the prognosis is limited. That is, for the same BP levels, the stress on the arterial wall might be higher in the case of a rigid artery as compared with that in the case of a pliant artery because of the lower buffering effect of the arterial wall against BP in the former31; therefore, hemodynamic abnormalities associated with elevated BP 1, 26, 27, 28 might be observed even in the normal BP range in the presence of increased structural arterial stiffness. Further study is needed to clarify whether functional arterial stiffness is an important factor contributing to the onset of cardiovascular events in the absence of increased structural arterial stiffness in the general population.
Clinical Implications
As discussed above, if the concept of the nonlinear pressure‐elastic behavior of the arteries were to be considered in the risk assessment for CVD by arterial stiffness determined by measurement of the PWV, stiffness index β‐transformed PWV could possibly be more reliable as a risk marker for the development of CVD. However, in the present study, PWV without stiffness index β transformation was found to be a better predictor of the development of hypertension and retinopathy. Thus, the present study was the first to suggest the significance of the contribution of BP to increased arterial stiffness, which is associated with the development of pathophysiological abnormalities related to CVD (ie, hypertension and retinopathy). Therefore, in subjects with increased arterial stiffness, strict BP control could be crucial for the prevention of CVD.
Limitations
The present study had some limitations: (1) the CAVI is originally calculated from the heart‐ankle PWV.9, 10, 11, 12, 13 As shown in Figure 3, the baPWV showed a close correlation with the heart‐ankle PWV (R=0.92, P<0.01) in our cohort (ie, middle‐aged Japanese men); on the other hand, the correlation between the baPWV and the carotid‐femoral PWV, although significant, was not as strong (R=0.73, P<0.01).32 Therefore, the contribution of the BP to the arterial stiffness represented by the carotid‐femoral PWV, which is known to influence the risk of development of CVD, needs to be clarified. (2) the equations used to calculate the CAVI were not fully applicable for calculation of the BP‐adjusted baPWV, which was used in the present study12. (3) the present study, conducted to assess the risk of development of hypertension and subclinical organ damage, did not include female subjects, and the BP in most subjects was within the range of “normal BP.” Therefore, further studies are needed to confirm the present findings in women, subjects with hypertension, and subjects of other ethnicities. (4) For assessment of the risk of development of cardiovascular events, originally, the FMD‐J (Flow‐Mediated Dilation Japan) study was designed to examine the usefulness of flow‐mediated vasodilatation of the brachial artery to predict the risk of development of cardiovascular events during the 3‐year follow‐up period in patients with coronary artery disease, and the sample size was calculated as 642 subjects.19 However, data on the baPWV were available only for 511 subjects. Thus, the number of study subjects was not entirely sufficient for this subanalysis. (5) Although retinopathy is a predictor of future cardiovascular events,33 there is no clear consensus regarding the classification of retinopathy or whether retinal examination is useful for risk stratification.34 (6) An association has been demonstrated between arterial stiffness and progression of dementia35; therefore, the next step is to clarify whether PWV rather than stiffness index β‐transformed PWV is also a better predictor of the development of dementia.
Figure 3.
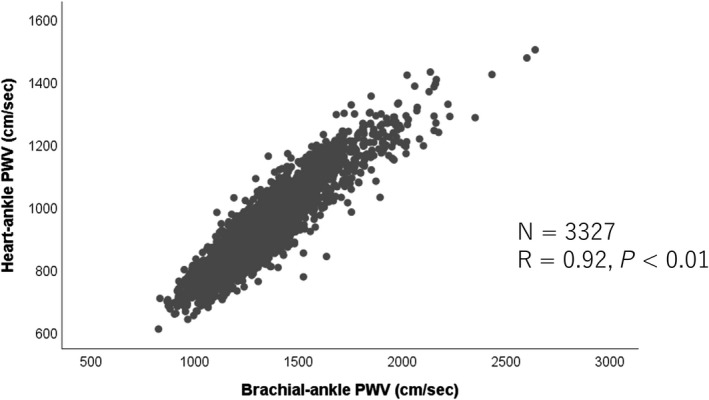
Correlation of the brachial‐ankle pulse wave velocity (PWV) with the heart‐ankle pulse wave velocity.
Conclusions
Adjustment of the PWV value for the BP, based on the stiffness index β, may attenuate the significance of the baPWV as a risk marker for the development of pathophysiological abnormalities related to CVD (ie, hypertension and retinopathy) in male subjects. In this study the PWV without stiffness index β transformation was found to be a better predictor of the development of these pathophysiological abnormalities.
Sources of Funding
This study was supported by Omron Health Care Company (Kyoto, Japan), Asahi Calpis Wellness Company (Tokyo, Japan), and the Japanese Atherosclerosis Prevention Research Fund (a study of multicenter assessment on the clinical usefulness of semiautomatic measurement of flow‐mediated vasodilatation of the brachial artery: FMD‐J [Flow‐Mediated Dilation Japan] study). The sponsor (Omron Health Care Company) assisted in the data formatting (ie, the data of the baPWV stored in the hard disk of the equipment used for measurement of the baPWV was transferred to an Excel file). Other than this, the company played no role in the design or conduct of the study, including data collection, management, analysis, and interpretation of the data, or in the preparation, review, or approval of the manuscript.
Disclosures
The sponsor (Omron Health Care Company) assisted in the data formatting (i.e., the data of the brachial‐ankle pulse wave velocity stored in the hard disc of the equipment used for measurement of the brachial‐ankle pulse wave velocity was transferred to an Excel file). Other than this, the company played no role in the design or conduct of the study, i.e., in the data collection, management, analysis or interpretation of the data, or in the preparation, review or approval of the manuscript. The authors have no other disclosure to make.
(J Am Heart Assoc. 2019;8:e013004 . DOI: 10.1161/JAHA.119.013004.)
References
- 1. Townsend RR, Wilkinson IB, Schiffrin EL, Avolio AP, Chirinos JA, Cockcroft JR, Heffernan KS, Lakatta EG, McEniery CM, Mitchell GF, Najjar SS, Nichols WW, Urbina EM, Weber T; American Heart Association Council on Hypertension . Recommendations for improving and standardizing vascular research on arterial stiffness: a scientific statement from the American Heart Association. Hypertension. 2015;66:698–722. [DOI] [PMC free article] [PubMed] [Google Scholar]
- 2. van Sloten TT, Sedaghat S, Laurent S, London GM, Pannier B, Ikram MA, Kavousi M, Mattace‐Raso F, Franco OH, Boutouyrie P, Stehouwer CDA. Carotid stiffness is associated with incident stroke: a systematic review and individual participant data meta‐analysis. J Am Coll Cardiol. 2015;66:2116–2125. [DOI] [PubMed] [Google Scholar]
- 3. Liao D, Arnett DK, Tyroler HA, Riley WA, Chambless LE, Szklo M, Heiss G. Arterial stiffness and the development of hypertension: The ARIC study. Hypertension. 1999;34:201–206. [DOI] [PubMed] [Google Scholar]
- 4. Yang EY, Chambless L, Sharrett AR, Virani SS, Liu X, Tang Z, Boerwinkle E, Ballantyne CM, Nambi V. Carotid arterial wall characteristics are associated with incident ischemic stroke but not coronary heart disease in the Atherosclerosis Risk in Communities (ARIC) study. Stroke. 2012;43:103–108. [DOI] [PMC free article] [PubMed] [Google Scholar]
- 5. Spronck B, Avolio AP, Tan I, Butlin M, Reesink KD, Delhaas T. Arterial stiffness index beta and cardio‐ankle vascular index inherently depend on blood pressure but can be readily corrected. J Hypertens. 2017;35:98–104. [DOI] [PubMed] [Google Scholar]
- 6. Fortier C, Sidibé A, Desjardins MP, Marquis K, De Serres SA, Mac‐Way F, Agharazii M. Aortic‐brachial pulse wave velocity ratio: a blood pressure‐independent index of vascular aging. Hypertension. 2017;69:96–101. [DOI] [PubMed] [Google Scholar]
- 7. Hermeling E, Hoeks AP, Winkens MH, Waltenberger JL, Reneman RS, Kroon AA, Reesink KD. Noninvasive assessment of arterial stiffness should discriminate between systolic and diastolic pressure ranges. Hypertension. 2010;55:124–130. [DOI] [PubMed] [Google Scholar]
- 8. Yannoutsos A, Ahouah M, Dreyfuss Tubiana C, Topouchian J, Safar ME, Blacher J. Aortic stiffness improves the prediction of both diagnosis and severity of coronary artery disease. Hypertens Res. 2018;41:118–125. [DOI] [PubMed] [Google Scholar]
- 9. Kubozono T, Miyata M, Ueyama K, Nagaki A, Otsuji Y, Kusano K, Kubozono O, Tei C. Clinical significance and reproducibility of new arterial distensibility index. Circ J. 2007;71:89–94. [DOI] [PubMed] [Google Scholar]
- 10. Wohlfahrt P, Cífková R, Movsisyan N, Kunzová Š, Lešovský J, Homolka M, Soška V, Dobšák P, Lopez‐Jimenez F, Sochor O. Reference values of cardio‐ankle vascular index in a random sample of a white population. J Hypertens. 2017;35:2238–2244. [DOI] [PubMed] [Google Scholar]
- 11. Ye Z, Pellikka PA, Kullo IJ. Sex differences in associations of cardio‐ankle vascular index with left ventricular function and geometry. Vasc Med. 2017;22:465–472. [DOI] [PubMed] [Google Scholar]
- 12. Takahashi K, Yamamoto T, Tsuda S, Okabe F, Shimose T, Tsuji Y, Suzuki K, Otsuka K, Takata M, Shimizu K, Uchino J, Shirai K. Coefficients in the CAVI equation and the comparison between CAVI with and without the coefficients using clinical data. J Atheroscler Thromb. 2019;26:465–475. [DOI] [PMC free article] [PubMed] [Google Scholar]
- 13. Matsushita K, Ding N, Kim ED, Budoff M, Chirinos JA, Fernhall B, Hamburg NM, Kario K, Miyoshi T, Tanaka H, Townsend R. Cardio‐ankle vascular index and cardiovascular disease: systematic review and meta‐analysis of prospective and cross‐sectional studies. J Clin Hypertens (Greenwich). 2019;21:16–24. [DOI] [PMC free article] [PubMed] [Google Scholar]
- 14. Ben‐Shlomo Y, Spears M, Boustred C, May M, Anderson SG, Benjamin EJ, Boutouyrie P, Cameron J, Chen CH, Cruickshank JK, Hwang SJ, Lakatta EG, Laurent S, Maldonado J, Mitchell GF, Najjar SS, Newman AB, Ohishi M, Pannier B, Pereira T, Vasan RS, Shokawa T, Sutton‐Tyrell K, Verbeke F, Wang KL, Webb DJ, Willum Hansen T, Zoungas S, McEniery CM, Cockcroft JR, Wilkinson IB. Aortic pulse wave velocity improves cardiovascular event prediction: an individual participant meta‐analysis of prospective observational data from 17,635 subjects. J Am Coll Cardiol. 2014;63:636–646. [DOI] [PMC free article] [PubMed] [Google Scholar]
- 15. Tomiyama H, Shiina K, Vlachopoulos C, Iwasaki Y, Matsumoto C, Kimura K, Fujii M, Chikamori T, Yamashina A. Involvement of arterial stiffness and inflammation in hyperuricemia‐related development of hypertension. Hypertension. 2018;72:739–745. [DOI] [PubMed] [Google Scholar]
- 16. Tomiyama H, Tanaka H, Hashimoto H, Matsumoto C, Odaira M, Yamada J, Yoshida M, Shiina K, Nagata M, Yamashina A. Arterial stiffness and declines in individuals with normal renal function/early chronic kidney disease. Atherosclerosis. 2010;212:345–350. [DOI] [PubMed] [Google Scholar]
- 17. Ohkuma T, Ninomiya T, Tomiyama H, Kario K, Hoshide S, Kita Y, Inoguchi T, Maeda Y, Kohara K, Tabara Y, Nakamura M, Ohkubo T, Watada H, Munakata M, Ohishi M, Ito N, Nakamura M, Shoji T, Vlachopoulos C, Yamashina A; Collaborative Group for J‐BAVEL (Japan Brachial‐Ankle Pulse Wave Velocity Individual Participant Data Meta‐Analysis of Prospective Studies) . Brachial‐ankle pulse wave velocity and the risk prediction of cardiovascular disease: an individual participant data meta‐analysis. Hypertension. 2017;69:1045–1052. [DOI] [PubMed] [Google Scholar]
- 18. Maruhashi T, Soga J, Fujimura N, Idei N, Mikami S, Iwamoto Y, Iwamoto A, Kajikawa M, Matsumoto T, Oda N, Kishimoto S, Matsui S, Hashimoto H, Aibara Y, Mohamad Yusoff F, Hidaka T, Kihara Y, Chayama K, Noma K, Nakashima A, Goto C, Tomiyama H, Takase B, Kohro T, Suzuki T, Ishizu T, Ueda S, Yamazaki T, Furumoto T, Kario K, Inoue T, Koba S, Watanabe K, Takemoto Y, Hano T, Sata M, Ishibashi Y, Node K, Maemura K, Ohya Y, Furukawa T, Ito H, Ikeda H, Yamashina A, Higashi Y. Endothelial dysfunction, increased arterial stiffness, and cardiovascular risk prediction in patients with coronary artery disease: FMD‐J (Flow‐Mediated Dilation Japan) Study A. J Am Heart Assoc. 2018;7:e008588DOI: 10.1161/JAHA.118.008588. [DOI] [PMC free article] [PubMed] [Google Scholar]
- 19. Tomiyama H, Kohro T, Higashi Y, Takase B, Suzuki T, Ishizu T, Ueda S, Yamazaki T, Furumoto T, Kario K, Inoue T, Koba S, Watanabe K, Takemoto Y, Hano T, Sata M, Ishibashi Y, Node K, Maemura K, Ohya Y, Furukawa T, Ito H, Yamashina A. A multicenter study design to assess the clinical usefulness of semi‐automatic measurement of flow‐mediated vasodilatation of the brachial artery. Int Heart J. 2012;53:170–175. [DOI] [PubMed] [Google Scholar]
- 20. Horio M, Imai E, Yasuda Y, Watanabe T, Matsuo S. Modification of the CKD epidemiology collaboration (CKD‐EPI) equation for Japanese: accuracy and use for population estimates. Am J Kidney Dis. 2010;56:32–38. [DOI] [PubMed] [Google Scholar]
- 21. Yamashina A, Tomiyama H, Takeda K, Tsuda H, Arai T, Hirose K, Koji Y, Hori S, Yamamoto Y. Validity, reproducibility, and clinical significance of noninvasive brachial‐ankle pulse wave velocity measurement. Hypertens Res. 2002;25:359–364. [DOI] [PubMed] [Google Scholar]
- 22. The committee of establishing the definition of the diagnosis of metabolic syndrome in Japan. J Jpn Soc Int Med. 2005;94:188–203(In Japanese). [Google Scholar]
- 23. Bolli P, Hemmelgarn B, Myers MG, McKay D, Tremblay G, Tobe SW; Canadian Hypertension Education Program . High normal blood pressure and prehypertension: the debate continues. Can J Cardiol. 2007;23:581–583. [DOI] [PMC free article] [PubMed] [Google Scholar]
- 24. Scuteri A, Morrell CH, Orrù M, Strait JB, Tarasov KV, Ferreli LA, Loi F, Pilia MG, Delitala A, Spurgeon H, Najjar SS, AlGhatrif M, Lakatta EG. Longitudinal perspective on the conundrum of central arterial stiffness, blood pressure, and aging. Hypertension. 2014;64:1219–1227. [DOI] [PMC free article] [PubMed] [Google Scholar]
- 25. Kario K, Kanegae H, Oikawa T, Suzuki K. Hypertension is predicted by both large and small artery disease. Hypertension. 2019;73:75–83. [DOI] [PubMed] [Google Scholar]
- 26. Tomiyama H, Yamashina A. Non‐invasive vascular function tests: their pathophysiological background and clinical application. Circ J. 2010;74:24–33. [DOI] [PubMed] [Google Scholar]
- 27. Chirinos JA, Sweitzer N. Ventricular‐arterial coupling in chronic heart failure. Card Fail Rev. 2017;3:12–18. [DOI] [PMC free article] [PubMed] [Google Scholar]
- 28. Nilsson PM, Laurent S, Cunha PG, Olsen MH, Rietzschel E, Franco OH, Ryliškyt≐ L, Strazhesko I, Vlachopoulos C, Chen CH, Boutouyrie P, Cucca F, Lakatta EG, Scuteri A; Metabolic syndrome, Arteries REsearch (MARE) Consortium . Characteristics of healthy vascular ageing in pooled population‐based cohort studies: the global Metabolic syndrome and Artery REsearch Consortium. J Hypertens. 2018;36:2340–2349. [DOI] [PMC free article] [PubMed] [Google Scholar]
- 29. Tomiyama H, Koji Y, Yambe M, Shiina K, Motobe K, Yamada J, Shido N, Tanaka N, Chikamori T, Yamashina A. Brachial‐ankle pulse wave velocity is a simple and independent predictor of prognosis in patients with acute coronary syndrome. Circ J. 2005;69:815–822. [DOI] [PubMed] [Google Scholar]
- 30. Lee YB, Park JH, Kim E, Kang CK, Park HM. Arterial stiffness and functional outcome in acute ischemic stroke. J Cerebrovasc Endovasc Neurosurg. 2014;16:11–19. [DOI] [PMC free article] [PubMed] [Google Scholar]
- 31. Otsuka K, Fukuda S, Shimada K, Suzuki K, Nakanishi K, Yoshiyama M, Yoshikawa J. Serial assessment of arterial stiffness by cardio‐ankle vascular index for prediction of future cardiovascular events in patients with coronary artery disease. Hypertens Res. 2014;37:1014–1020. [DOI] [PubMed] [Google Scholar]
- 32. Tanaka H, Munakata M, Kawano Y, Ohishi M, Shoji T, Sugawara J, Tomiyama H, Yamashina A, Yasuda H, Sawayama T, Ozawa T. Comparison between carotid‐femoral and brachial‐ankle pulse wave velocity as measures of arterial stiffness. J Hypertens. 2009;27:2022–2027. [DOI] [PubMed] [Google Scholar]
- 33. Sairenchi T, Iso H, Yamagishi K, Irie F, Okubo Y, Gunji J, Muto T, Ota H. Mild retinopathy is a risk factor for cardiovascular mortality in Japanese with and without hypertension: the Ibaraki Prefectural Health Study. Circulation. 2011;124:2502–2511. [DOI] [PubMed] [Google Scholar]
- 34. Wong TY, Mitchell P. Hypertensive retinopathy. N Engl J Med. 2004;351:2310–2317. [DOI] [PubMed] [Google Scholar]
- 35. Pase MP, Himali JJ, Mitchell GF, Beiser A, Maillard P, Tsao C, Larson MG, DeCarli C, Vasan RS, Seshadri S. Association of aortic stiffness with cognition and brain aging in young and middle‐aged adults: the Framingham Third Generation Cohort Study. Hypertension. 2016;67:513–519. [DOI] [PMC free article] [PubMed] [Google Scholar]