

Abstract
Background
Increased aortic stiffness has been associated with cognitive decline and dementia, but the results are inconsistent. This study investigated the longitudinal association of aortic stiffness and age with decreased cognitive performance in 3 cognitive tests.
Methods and Results
This study included 6927 participants, with a mean age of 58.8 years at baseline (2008–2010), who participated in the second wave (2012–2014) of the ELSA‐Brasil (Brazilian Longitudinal Study of Adult Health) (interval between visits ranging from 2–6 years). Cognitive performance was evaluated by Memory, Phonemic, and Semantic Verbal Fluency and Trail B Tests, applied at both cohort visits. Associations with the carotid‐femoral pulse wave velocity and age at baseline were investigated using linear models with mixed effects after adjusting for confounders. After all the adjustments, including for systolic blood pressure, the interaction term carotid‐femoral pulse wave velocity×time proved to be statistically significant for Memory and Verbal Fluency Tests, indicating that the higher carotid‐femoral pulse wave velocity at baseline was associated with a faster decline in cognitive performance in these tests between waves. The interaction term age×time was statistically significant for all cognitive tests, suggesting that increasing age at baseline was also associated with a faster decline in cognitive performance between waves.
Conclusions
In this relatively young cohort, and after a relatively short interval, an increased aortic stiffness at baseline was associated with a sharper decline in cognitive performances in memory and verbal fluency, regardless of systolic blood pressure levels. This study also showed that the decline in cognitive performance was faster among older individuals than among younger ones at baseline.
Keywords: aging, aortic stiffness, blood pressure, cognition, pulse wave velocity
Subject Categories: Cardiovascular Disease, Aging, Epidemiology, Risk Factors, High Blood Pressure
Clinical Perspective
What Is New?
Increased aortic stiffness is associated with poorer longitudinal trajectory in different cognitive abilities, regardless of systolic blood pressure levels and age.
Although the effect size is somewhat small, it is remarkable to detect a direct impact of increased aortic stiffness on cognitive decline in a highly educated and relatively young age population over a short time interval.
What Are the Clinical Implications?
The findings reinforce the importance of studying cognitive function from midlife and identifying modifiable factors that can potentially slow the age‐associated increase in aorta stiffness and its detrimental impact on cognitive function over time.
Introduction
Hypertension is a known risk factor for cognitive decline and dementia.1 However, recent evidence has shown that the association between hypertension and cognitive decline disappears or significantly fades when adjusted for aortic stiffness, one of the earliest subclinical indicators of changes in the structure and function of arterial walls.2 Aortic stiffness precedes and contributes to a sizable increase in systolic blood pressure (SBP). Likewise, a higher SBP can interact with increased arterial stiffness, leading to earlier and accelerated arterial stiffening.3
Three reviews, including both cross‐sectional and longitudinal studies, have reported associations of increased aortic stiffness with either poorer cognitive performance or cognitive decline.4, 5, 6, 7 Despite such evidence, the relative contribution of aortic stiffness to cognitive performance or decline, regardless of SBP, has not yet been fully established. Some longitudinal studies, for instance, have reported the absence of independent associations between aortic stiffness and cognitive decline8 and dementia incidence,9 whereas others have shown significant associations with faster cognitive decline in specific abilities.8, 10
Aortic stiffness may be useful for the early detection of individuals with a high risk for cognitive decline.11, 12 Modifying risk factors that accelerate the process of arterial aging beyond that expected for one's age may delay the progression of age‐related cognitive impairment.13 The possibility of the early prevention of accelerated arterial stiffening is now increasingly under investigation.12, 13
As far as we know, few longitudinal studies have evaluated the impact of carotid‐femoral pulse wave velocity (cf‐PWV) on the cognitive decline in specific cognitive abilities.2, 8, 9, 10, 14 Most studies were conducted with relatively small samples from developed countries2, 8, 10; targeted populations at an advanced age9, 10, 15; selected participants with health conditions, including those with memory loss16; or institutionalized patients.17 In addition, although it is well known that general cognitive function declines in old age, and that aging is accompanied by progressive stiffening of great arteries, there are indications that different cognitive abilities decline at different rates over time,18, 19 and this decline is disproportionately faster in elderly individuals.19 Elias and collaborators, using a comprehensive test battery in a cross‐sectional analysis, showed that pulse wave velocity interacted with age in a multiplicative way to exert a negative influence on the cognitive performance level.7
This study aims to assess whether aortic stiffness, measured by the cf‐PWV and age at the baseline, was associated with the rate of decline in 3 cognitive tests performed between visits in a cohort of middle‐aged and older adults. We hypothesize that cognitive performance will decline faster among individuals with a higher PWV and an older age at the baseline compared with those with a lower PWV and a younger age and that these effects are independent of SBP and other known risk factors for the cognitive decline measured at the beginning of the study.
Methods
The data that support the findings of this study are available from the corresponding author on request.
Study Design
This study follows a longitudinal study design, using baseline (2008–2010) and follow‐up (wave 2: 2012–2014) data from ELSA‐Brasil (Brazilian Longitudinal Study of Adult Health), a multicenter cohort study of 15 105 participants (aged 35–74 years), all of whom were active or retired civil servants from higher education or research organizations in 6 Brazilian cities. The exclusion criteria for the ELSA‐Brasil cohort were severe cognitive or communication impairment, intention to change jobs or quit working at the institution in the near future, and retired participants living outside the corresponding metropolitan area. Currently or recently pregnant women were not included as such but were invited to join the study 4 months after delivery. Detailed information on the baseline of the ELSA‐Brasil was published elsewhere.20, 21
Study Sample
Of the 15 105 participants at the baseline, 1091 (7.2%) did not attend the second study visit, 223 of whom (20.4%) had died. Thus, 94% of the eligible population completed wave 2. Cognitive function tests were applied to the entire sample at the baseline and only to participants aged ≥55 years at wave 2. Thus, all participants with valid information on cognitive tests at both assessments were eligible for the present analysis.
From this sample, participants who reported prior diagnosis of stroke at the baseline (n=132), with missing or invalid cf‐PWV data (n=188), and who were using anticholinesterase drugs on entry (n=1) were excluded. Because of missing information on the cognitive test, the final analytical sample varied from test to test (Memory Test, N=6520; Fluency Test, N=6674; Trail B Test, N=6493). The sample selection is described in Figure 1.
Figure 1.
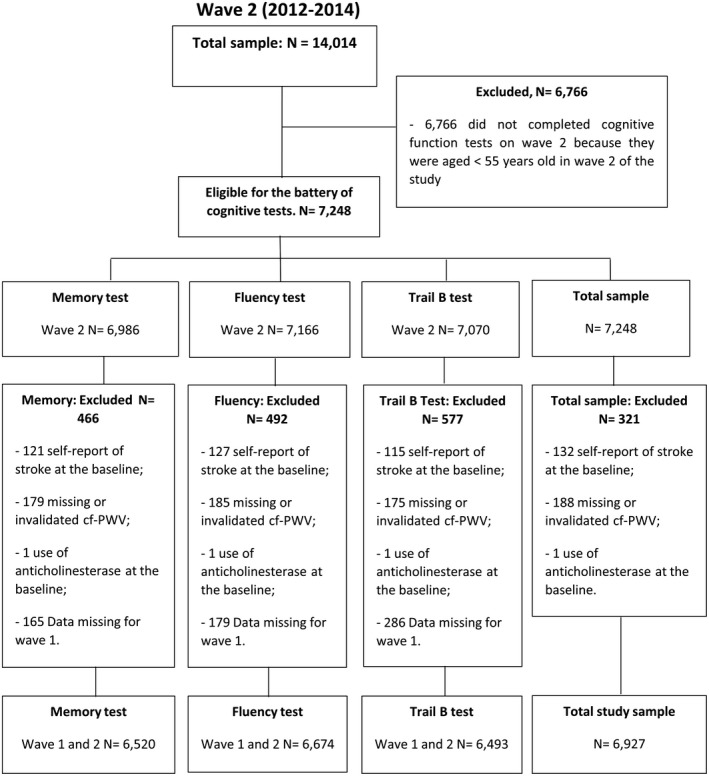
Study population flowchart. cf‐PWV indicates carotid‐femoral pulse wave velocity.
Study Variables
The total scores for the 3 cognitive tests included in this study, both at the baseline and at the second wave, represented the response variables. Higher scores in Memory and Verbal Fluency Tests indicate better cognitive function, whereas longer execution time in the Trail B Test suggests poorer performance. The reliability of cognitive tests at the baseline varied from moderate to nearly perfect (intraclass correlation coefficient included): Word Learning Test (0.56), Word Recall (0.50), Word Recognition (0.35), Phonemic (0.61) and Semantic (0.53) Verbal Fluency Test, and Trail B Test (0.91).22
Memory tests
Memory tests were obtained by the neuropsychological test battery Consortium to Establish a Registry for Alzheimer's Disease to evaluate declarative memory.23, 24 The total score represents the total number of correct words, ranging from 0 to 50 words, and was obtained by the direct sum of the scores in word learning, recall, and recognition tests.
Verbal fluency tests
In verbal fluency tests, the total score represents the total number of correct words and was obtained by the sum of the Semantic and Phonemic Verbal Fluency Test scores, ranging from 0 to 68 words. These tests were used to evaluate the executive function and explicit memory, semantics, and language. At the baseline, the phonemic and semantic categories used in this study were letter F and animals. At the second wave, these categories were letter A and flora (eg, vegetables, flowers, and trees), respectively. The Semantic Verbal Fluency Test is part of the Consortium to Establish a Registry for Alzheimer's Disease battery.23, 24
Trail test (version B)
First, Trail A Test was applied, and only the participants who were able to complete it performed Trail B test. This test evaluates the executive function, attention span, concentration, and psychomotor speed.25 The score consisted of the time (in seconds) spent by participants to complete Trail B Test (ranging from 34 to 1853 seconds), as the time spent on the Trail A Test was not recorded. This analysis assumed that individuals who failed to complete Trail B Test (n=472) took longer than those in the same sex, age, and schooling group who were able to complete the test, and assigned them the maximum time taken plus one in that specific subgroup, as these variables were all strong predictors of completing the test. Because the final score was not normally distributed, it was log transformed for the statistical analysis.
Age and aortic stiffness were the explanatory variables of interest. Age at the baseline was analyzed as a continuous variable, and specific ages are used to show the results in graphic analyses.
Aortic stiffness was determined at the baseline by the cf‐PWV with participants in the supine position, using a validated automated device (Complior, Artech Medicale, France),26 as described elsewhere.27 The cf‐PWV was analyzed as a continuous variable and was subsequently grouped into percentiles to facilitate the viewing of results in graphic analyses.
Covariates were obtained at the baseline through standardized face‐to‐face interviews and clinical and laboratory procedures. Participants were fasting and were instructed to avoid drinking alcoholic beverages and caffeine and to avoid exercising within 12 hours before the examination. Blood samples were collected after 10 to 14 hours of fasting and stored, using standardized protocol.20
Sociodemographic data included age (in years), sex, and schooling in complete years of formal education. Health‐related behaviors included smoking, leisure‐time physical activity, and consumption of alcoholic beverages (in g/d). Smoking was classified as never, ex‐smoker, and current smoker. Physical activity was assessed by the International Physical Activity Questionnaire28 and classified as light, moderate, and vigorous.29 The clinical measures were SBP, mean heart rate, weight (in kilograms), height (in centimeters), and total cholesterol/high‐density lipoprotein cholesterol ratio.
The main analysis of this study considered the SBP obtained immediately before assessing cf‐PWV, after a 5‐minute rest, with the subject in the supine position, and using an oscillometric device (Omron HEM 705 CP) on the subject's right arm.27 In addition, the analysis was conducted by adjusting for mean arterial pressure, where mean arterial pressure=diastolic blood pressure+(SBP−diastolic blood pressure)/3, using blood pressure levels obtained before the cf‐PWV measurement.
The mean heart rate was assessed with participants sitting up, using the same oscillometric device and at a different time than the cf‐PWV measurement.27 Three recordings were performed, and the mean of the second and third measurements was used.
The statistical analysis was also adjusted for self‐reported cardiovascular disease (acute myocardial infarction, unstable angina, congestive heart failure, or coronary artery bypass graft), diabetes mellitus, and the use of lipid‐lowering and antihypertensive drugs at the baseline. Diabetes mellitus was defined as the prior diagnosis of diabetes mellitus or any of the following criteria: the use of antidiabetic drugs, fasting glucose ≥126 mg/dL, the glucose tolerance test ≥200 mg/dL, or hemoglobin A1c ≥6.5%. Covariates were described in more detail elsewhere20, 27 (Table S1).
Finally, a time variable (in years) was created. It was assigned a zero value for all individuals at the baseline visit, whereas at the second wave it corresponded to the interval (in years) between the baseline and the second wave for each individual (date of second wave visit−date of baseline visit)/365.25).
Statistical Analysis
Categorical variables were described as proportions, and continuous variables were described as medians and ranges or as means and SDs, when appropriate.
Linear mixed‐effect regression models were used to assess longitudinal changes in cognitive performance between the baseline and second wave visits because these models are particularly adequate for unbalanced data and/or data unevenly spaced over time.30 In addition, these models easily accommodate the hierarchical structure of data,31 allowing for the description of time trends, considering the correlation between successive measures, as expected for cognitive tests in a cohort. They are, therefore, especially appropriate for data in which intersubject variability is higher than intrasubject variability.32
In mixed‐effect regression models, the regression coefficients of the exposure indicate the mean variation in the outcome at the baseline and at each time point (second wave in this work). The interaction terms between a fixed‐effect variable (cf‐PWV or age in this work) and time determine whether this variable predicts longitudinal changes in the dependent variable over time. Therefore, the interaction terms between time and the explanatory variables of interest were evaluated, but only the statistically significant (P<0.05) terms were retained in the models.
The cf‐PWV, age, and all covariates assessed at the baseline were included in all models as fixed effects, and time (interval between visits) was modeled as a random effect. All models included random effects at the intercept and time slope. Random effects at the intercept and time slope allow both the initial value and the subject's longitudinal trajectory to vary in relation to the mean and the population trajectory.30 The estimation of the fixed effects (β) and the components of the variance (α) of the mixed linear model was performed using the methods of maximum likelihood restricted, as it showed a better adjustment when compared with the model using only the f maximum likelihood method.33
For each cognitive function test, the analysis was first conducted with the explanatory variables of interest (cf‐PWV and age). Next, the covariables (sex, schooling level, smoking, consumption of alcoholic beverages, physical activity, diabetes mellitus, cardiovascular disease, total cholesterol/high‐density lipoprotein cholesterol ratio, use of lipid‐lowering drugs, use of antihypertensive drugs, weight, height, and mean heart rate) were entered into the models step by step with forward elimination. All variables associated with the response variables at P<0.05 were retained in the final model, except for the variables of sex, age, schooling, and use of antihypertensive medication, which we decided, on a priori basis, to maintain in the analysis, regardless of statistical significance. Finally, the interaction terms cf‐PWV×time and age×time were added and adjusted for SBP, and the final results are reported.
Models were also adjusted for mean arterial pressure instead of SBP. The results remained virtually unchanged, as shown in Tables S2 and S3.
Analyses were conducted using Stata 14.0 (Stata Corporation, College Station, TX), whereas graphic analyses were performed using R statistical software, version 3.5.3 (R Core Team, Vienna, Austria).
ELSA‐Brasil was approved by the Research Ethics Committees of the participating institutions and by the National Committee for Research Ethics (CONEP 976/2006) of the Ministry of Health. All study participants signed an informed consent form.
Results
Participants’ characteristics at the baseline and second wave are presented in Table 1. At the baseline, 55.0% were women, with a mean age of 58.8 (SD=5.9) years; 53.6% had ≥14 years of schooling, and the mean cf‐PWV was 9.9 (SD=1.9) m/s. The median interval between visits was 3.8 years (range, 1.7–6.0 years). The mean scores of Verbal Fluency Tests were 29.8 (range, 4.0–64.0) and 27.7 (range, 0.0–68.0) correct words at the baseline and second wave, respectively. Mean Memory Test scores were 36.8 (range, 0.0–50.0) correct words at the baseline and 37.2 (range, 10.0–50.0) correct words at the second wave. The median execution time of the Trail B Test did not vary between waves (median=109 seconds).
Table 1.
Characteristics of the Study Population at the Baseline (2008–2010) and Wave 2 (2012–2014): ELSA‐Brasil
| Characteristics | Wave 1 | Wave 2 |
|---|---|---|
| Age, y | 58.8 (5.9) | 62.7 (5.9) |
| Sex, women | 55.0 | … |
| Schooling (time of study), y | ||
| ≥14 | 53.5 | 55.4 |
| 11–13 | 29.9 | 28.2 |
| 8–10 | 8.6 | 8.6 |
| <8 | 8.0 | 7.8 |
| Smoking | ||
| Never smoker | 50.5 | 51.7 |
| Former smoker | 37.0 | 38.2 |
| Current smoker | 12.5 | 10.1 |
| Consumption of alcoholic beverages, g/d | 6.5 (11.0) | … |
| Leisure‐time physical activity | ||
| Mild | 75.3 | 72.9 |
| Moderate | 18.5 | 20.3 |
| Vigorous | 6.2 | 6.8 |
| Weight, kg | 73.0 (14.3) | 73.3 (14.5) |
| Height, cm | 163.6 (9.3) | 163.1 (9.3) |
| Cardiovascular disease | 8.0 | … |
| Diabetes mellitus | 22.9 | 25.9 |
| Systolic blood pressure, mm Hg | 130.2 (18.9) | … |
| Mean heart rate, bpm | 69.3 (10.4) | 68.7 (10.4) |
| Total cholesterol/HDL cholesterol ratio | 4.0 (1.0) | 3.8 (1.1) |
| Use of lipid‐lowering drugs | 20.0 | 32.4 |
| Use of antihypertensive drugs | 39.4 | 49.0 |
| Carotid‐femoral pulse wave velocity, m/s | 9.9 (1.9) | … |
| Memory Test score (number of correct words)a | 36.8 (0–50.0) | 37.2 (10.0–50.0) |
| Verbal Fluency Test score (number of correct words)b | 29.8 (4.0–64.0) | 27.7 (0.0–68.0) |
| Trail B Test score,c | 109.0 (29.0–1584.0) | 109.0 (34.0–1853.0) |
| Duration of follow‐up, y | 0 | 3.8 (1.7–6.0) |
Data are given as percentage, mean (SD), or median (range). N=6927. Bpm indicates beats per minute; ELSA‐Brasil, Brazilian Longitudinal Study of Adult Health; HDL, high‐density lipoprotein.
Score ranging from 0 to 50 correct words.
Score ranging from 0 to ∞ correct words remembered in a time interval of 1 minute.
Score ranging from 1 to ∞ seconds.
After considering all covariables, the interaction term cf‐PWV×time was only statistically significant for Memory and Verbal Fluency Tests, indicating an interaction between the cf‐PWV at the baseline and time between waves. This interaction term remained statistically significant after adjusting for SBP, suggesting that an increase in cf‐PWV is associated with a more pronounced decrease in cognitive scores as the time interval between the visits increased. The effect of cf‐PWV was small but significant (Table 2).
Table 2.
Association of cf‐PWV at the Baseline and Performance in Cognitive Function Tests in Time Interval Between Visits, Estimated by Linear Mixed‐Effect Regression
| Variables | Cognitive Function Test | ||
|---|---|---|---|
| Memory Tests (No. of Correct Words) (N=6520) | Verbal Fluency Tests (No. of Correct Words) (N=6674) | Trail B Test (N=6493)* | |
| Intercept | 48.17 (46.31 to 50.04)† | 42.74 (40.35 to 45.12)† | 3.56 (3.35 to 3.76)† |
| cf‐PWV, m/s | −0.03 (−0.11 to 0.05) | 0.01 (−0.09 to 0.12) | −0.00 (−0.00 to 0.00) |
| Time, y | 1.14 (0.83 to 1.45)† | 0.19 (−0.23 to 0.63) | −0.06 (−0.10 to −0.02)† |
| cf‐PWV×time | −0.02 (−0.04 to −0.00)‡ | −0.02 (−0.04 to −0.00)§ | −0.00 (−0.00 to 0.00) |
Data are given as β (95% CI). ELSA‐Brasil (Brazilian Longitudinal Study of Adult Health) data were used (N=6927). Final model adjusted by the following: follow‐up time, sex, age, schooling level, smoking, consumption of alcoholic beverages, diabetes mellitus, cardiovascular disease, total cholesterol/high‐density lipoprotein cholesterol ratio, antihypertensive drug use, lipid‐lowering drugs, mean heart rate, interaction of age×time, interaction of cf‐PWV×time, and systolic blood pressure. cf‐PWV indicates carotid‐femoral pulse wave velocity.
*(β) Regression coefficients are log transformed. † P≤0.001, ‡ P≤0.01, § P≤0.05.
The interaction term age×time was statistically significant for all cognitive tests, suggesting that increasing age is associated with a more pronounced decrease in cognitive scores as the time interval between the visits increased (Table 3).
Table 3.
Association of Age at the Baseline and Performance in Cognitive Function Tests in Time Interval Between Visits, Estimated by Linear Mixed‐Effect Regression
| Cognitive Function Tests | |||
|---|---|---|---|
| Variables | Memory Tests (No. of Correct Words) (N=6520) | Verbal Fluency Tests (No. of Correct Words) (N=6674) | Trail B Test (N=6493)* |
| Intercept | 48.17 (46.31 to 50.04)† | 42.74 (40.35 to 45.12)† | 3.56 (3.35 to 3.76)† |
| Age, y | −0.14 (−0.16 to −0.11)† | −0.10 (−0.13 to −0.07)† | 0.01 (0.00 to 0.01)† |
| Time, y | 1.14 (0.83 to 1.45)† | 0.19 (−0.23 to 0.63) | −0.06 (−0.10to −0.02)† |
| Age×time | −0.01 (−0.01 to −0.00)† | −0.00 (−0.01 to −0.00)‡ | 0.00 (0.00 to 0.00)† |
Data are given as β (95% CI). ELSA‐Brasil (Brazilian Longitudinal Study of Adult Health) data were used (N=6927). Final model adjusted by the following: follow‐up time, sex, schooling level, smoking, consumption of alcoholic beverages, diabetes mellitus, cardiovascular disease, total cholesterol/high‐density lipoprotein cholesterol ratio, antihypertensive drug use, lipid‐lowering drugs, mean heart rate, carotid‐femoral pulse wave velocity (cf‐PWV), interaction of cf‐PWV×time, interaction of age×time, and systolic blood pressure.
*(β) Regression coefficients are log transformed. † P≤0.001, ‡ P≤0.05, § P≤0.01.
On the basis of the results of the final models, we can estimate, for instance, the decrease in the Fluency Test score (number of words remembered) for all participants who presented a cf‐PWV of 14.7 and 7.1 m/s at the baseline and who repeated the cognitive tests 6 years apart. After 6 years, participants with a cf‐PWV equal to 14.7 m/s at the baseline, on average, remembered ≈1.1 less words when compared with participants who had a cf‐PWV of 7.1 m/s at the baseline. The parameters for PWV‐cf of 14.7 and PWV‐cf of 7.1, used to generate the result described above, are presented below.
Fluency Test score (in individuals with a PWV‐cf of 14.7)=β of intercept+(14.7×β of cf‐PWV)+(6×β of time)–(β of interaction term cf‐PWV×time×14.7×6).
Fluency Test score (in individuals with a PWV‐cf of 7.1)=β of intercept+(7.1×β of cf‐PWV)+(6×β of time)–(β of interaction term cf‐PWV×time×7.1×6).
The interaction term between a fixed‐effect variable (PWV and age) and the time interval between repeated measures of cognitive tests represents the duration of time each individual took to repeat the test. In our study, some individuals repeated the cognitive test within <2 years, whereas others took 6 years, with the average time equal to 3.8 years. On the basis of this information, we were able to predict the change in cognitive performance at different time intervals, although we only have 2 measurements. Predicted values are values of the dependent variable based on the estimated regression coefficients (mean ratios observed in the regression) and a prediction about the values of the independent variables.
Thus, each margin of the 6 predictive margins (point estimates) in our graphic analyses represents the prediction time (1–6 years) estimated using the performance of the group of individuals who repeated the cognitive test at the same time interval.
The interaction between cf‐PWV and follow‐up time found for the Memory and Verbal Fluency Tests indicated that participants with a high cf‐PWV at the baseline showed a downward trajectory for these tests as the time interval between tests increased (Figure 2A and 2B, respectively). The graphic analysis suggests that, for the Memory Test, this effect is seen only among participants with a high cf‐PWV (>95th percentile) (Figure 2A), whereas for the Verbal Fluency Test, the higher the cf‐PWV value at the baseline, the steeper the decline as the time interval increases (Figure 2B).
Figure 2.
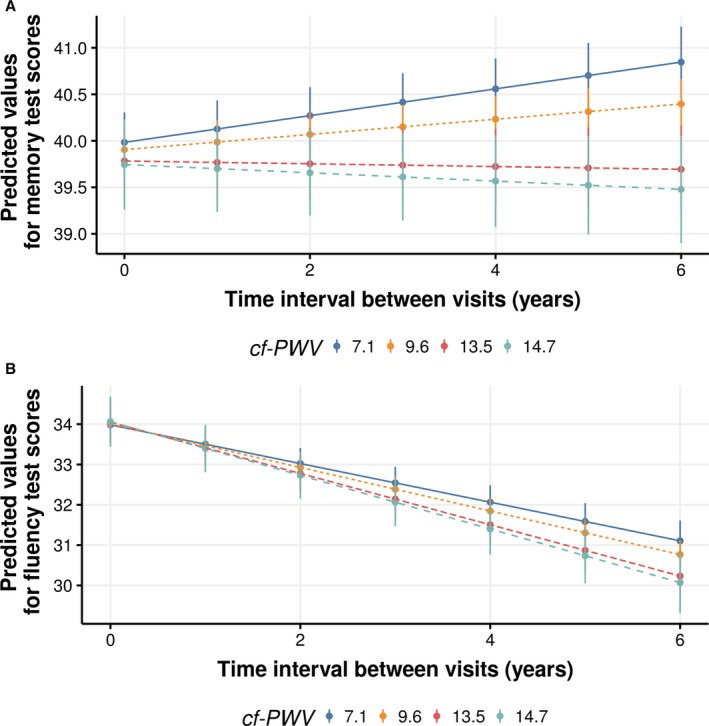
Predicted values (95% CI) of Memory Test (A) and Verbal Fluency Test (B) performance, according to carotid‐femoral pulse wave velocity (cf‐PWV; in m/s) in time interval between visits, after adjustments. ELSA‐Brasil (Brazilian Longitudinal Study of Adult Health) (2008–2010 and 2012–2014) data were used. cf‐PWV values correspond to 2.5, 50, 95, and 97.5 percentiles of its distribution. Predicted values are values of the dependent variable based on the estimated regression coefficients (mean ratios observed in the regression) and a prediction about the values of the independent variables. Time interval between visits represents an individual's interval between study assessments (waves 1 and 2).
The interactions between age and follow‐up time observed for all tests are shown in Figure 3A (Memory Test), 3B (Verbal Fluency Test), and 3C (Trail B Test). The graphic analyses revealed that only participants who were older at the baseline had a downward trajectory in cognitive performance for the Memory Test (Figure 3A) and the Trail B Test (Figure 3C), whereas all participants showed a decline in the Verbal Fluency Test, with this decline being steeper as the age at the baseline increased (Figure 3C).
Figure 3.
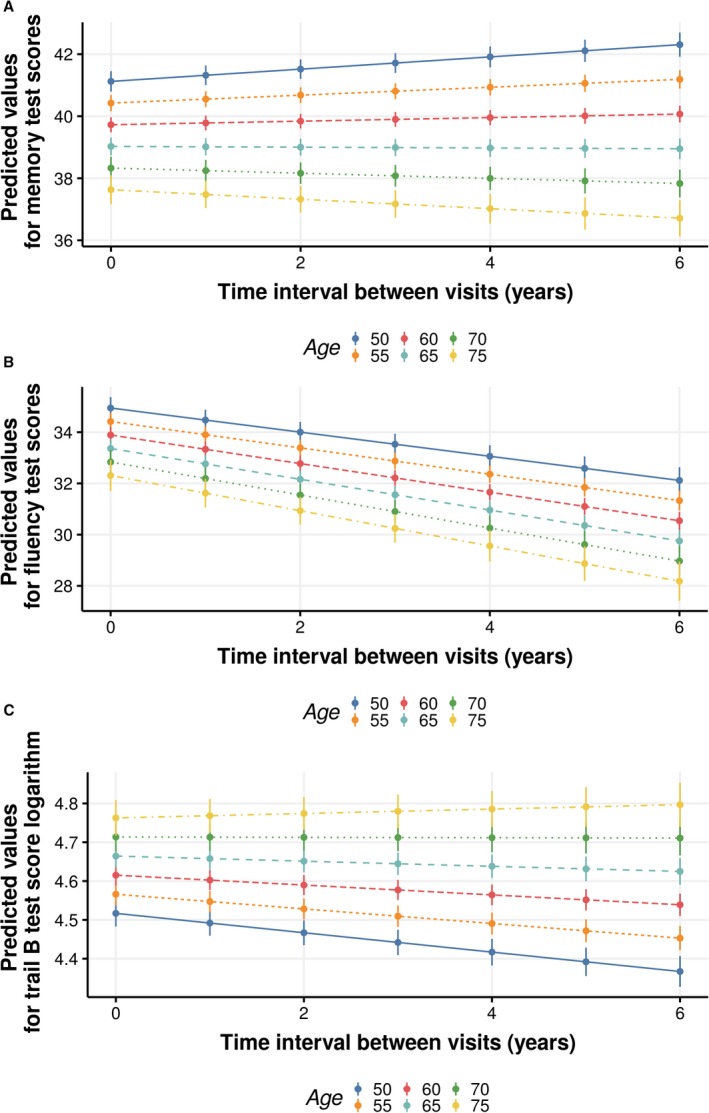
Predicted values (95% CI) of Memory Test (A), Verbal Fluency Test (B), and Trail B Test (C) performance, according to age at the baseline (in years), in time interval between visits, after adjustments. ELSA‐Brasil (Brazilian Longitudinal Study of Adult Health) (2008–2010 and 2012–2014) data were used. Predicted values are values of the dependent variable based on the estimated regression coefficients (mean ratios observed in the regression) and a prediction about the values of the independent variables. Time interval between visits represents an individual's interval between study assessments (waves 1 and 2).
Graphic analyses also suggest that participants who were younger (aged ≤65 years) at the baseline showed improved performance in the Memory Test (Figure 3A) and Trail B Test (Figure 3C) over time, whereas participants with a lower cf‐PWV at the baseline (<95th percentile) only improved their performance in the Memory Test (Figure 2A).
Discussion
In this large cohort of middle‐aged and older adults, high cf‐PWV and older age at the baseline were associated with poorer cognitive performance in different cognitive abilities evaluated by a range of tests in the second visit of the ELSA‐Brasil cohort. A higher cf‐PWV remained longitudinally associated with poorer Memory and Verbal Fluency Test results, whereas older age at the baseline was associated with poorer cognitive performance in all tests. Subsequent graphic analyses showed that the higher the cf‐PWV at the baseline, the greater the decrease in Verbal Fluency Test performance, but that Memory Test decline was restricted to participants with high values of cf‐PWV at the baseline. For age, the graphic analysis indicated a decreased performance in Verbal Fluency Test for all individuals, but only older participants showed a downward performance trajectory in Memory and Trail B Tests.
Most studies on the relation between cf‐PWV and cognitive function in specific cognitive abilities, although inconsistent on the cognitive abilities, found an inverse association in at least one cognitive test.2, 8, 10, 14 The Rotterdam study, however, found no association between cf‐PWV and change over time in any cognitive test. The authors suggested that regression to the mean and selection bias may explain their negative findings because participants who repeated the cognitive tests had fewer cardiovascular diseases and lower arterial stiffness than those who did not.9
The present study's results on the longitudinal association between aortic stiffness and performance in Fluency and Memory Tests concur with 3 longitudinal studies.2, 8, 14 Although it cannot be affirmed that the performance decline observed in this study is enduring, it refers to a population with a high schooling level, which proved to be similar to the cited studies.2, 8, 14 Interestingly, all of these studies, including the present study, investigated a relatively young population (mean ages, 57, 49.2, 61, and 58.9 years, respectively).2, 8, 14 Aortic stiffness is a slow and gradual process, beginning at 30 to 40 years of age, reaching higher levels as people age.34 It is possible, therefore, that an association between high cf‐PWV and decreased performance in these cognitive abilities, regardless of age, might be easier to detect in relatively younger populations, like the present one.
As presented in the present study's results, the regression parameters indicate small effects of cf‐PWV on cognitive performance changes in Fluency and Memory Tests, but these did prove to be statistically significant, even after adjusting for SBP. This finding is consistent with aortic stiffening, which precedes and contributes to an increase in SBP and pulse pressure in middle‐aged and elderly participants3, 35 and suggests a potential direct and deleterious effect of aortic stiffening on these cognitive abilities over time.
The present study's results concur with the BLSA (Baltimore Longitudinal Study of Aging) about an existing association of cf‐PWV with memory decline, but they are in disagreement with this study on verbal fluency, as they found no impact of cf‐PWV on tests of simple attention, executive functions, and language. Despite using a more comprehensive battery of tests and having a longer follow‐up, the study sample of Waldstein et al was much smaller than ours, which might have limited their ability to identify an existing effect.8
Contrary to other studies,2, 10, 14 our results found no longitudinal association between aortic stiffness and Trail B Test performance. Studies that identified an impact of aortic stiffness on executive function usually assessed older participants10 or had slightly longer follow‐up times,14 as compared with ours. However, one cannot rule out the fact that an association of cf‐PWV with executive function changes might occur as follow‐up time increases.
Pulsatile stress, caused by increased pulse pressure, is described as the main pathway linking aortic stiffness to decreased cognitive function.36 The excessive transmission of pulsatile energy in microcirculation may lead to hypertrophic remodeling and rarefaction of small cerebral vessels.37 These changes can also lead to microvascular brain damage, which manifests as white matter hyperintensities, brain microbleeds, and lacunar infarctions.38 Microvascular injuries may or may not result in cognitive impairment, including dementia.37 Another pathway would be endothelial dysfunction, which, through oxidative stress and inflammation, can affect the brain's microcirculation, in turn leading to ischemia, microvascular hemorrhage,39 and abnormal permeability of the blood‐brain barrier.15 Decreased brain perfusion, nutrition, and clearance of toxic products would be compromised, potentially resulting in neurodegeneration and cognitive dysfunction.40, 41
Cognitive function is usually poorer in old age,18, 41, 42 but the speed of its decline seems to vary for different domains or cognitive abilities.19 Verbal skills, general knowledge, and numerical skills seem to decline slower18 than other cognitive abilities, such as memory,43 which usually begins to decline at middle age.41 Although our sample was relatively young, and we compared only 2 consecutive visits, statistically significant interactions between age and time were found for all cognitive tests, confirming that older participants at the baseline had a poorer longitudinal trajectory in all cognitive abilities in this short follow‐up time. This study's findings concur with those of the ELSA (English Longitudinal Study of Aging), in which memory, executive function, and processing speed significantly declined over 8 years of follow‐up, most markedly in older participants.19
The strengths of this study include a large study population from a middle‐income country, high compliance rate, relatively young age, and evaluation of different cognitive abilities. We used the cf‐PWV, the gold standard method for measuring aortic stiffness, and a robust statistical model that considers the hierarchical structure of the data and allows for the analysis of unbalanced and/or unevenly spaced longitudinal data over time. The hierarchical structure of the data allows us to consider the fact that observations between individuals are independent, but repeated measures of the same individual are dependent and correlated errors. The mixed models allow for a more adequate modeling of the covariance matrix (error correlation structure).44, 45 Most studies on this subject used a linear regression model,9, 14, 16, 46 ignoring this correlation, thus generating less reliable results. In particular, the estimates of the SEs of the coefficients of the model are vitiated.30, 45
One key limitation of this study is the fact that measurements referred to only 2 visits within a relatively short time interval. Moreover, in some cases, only a single measurement of cf‐PWV was performed, hampering our ability to investigate the association between concomitant changes in cf‐PWV and cognitive function over time. This study's analysis also included individuals who failed to complete the Trail B Test, assuming that they took 1 second longer than the maximum time taken by their counterparts of the same sex, age, and schooling group. This strategy has the advantage of including in the analysis individuals whose performances were clearly worse than those of the participants who completed the test, but this time is likely to be underestimated.
Although the participants generally demonstrated a relatively high performance in all tests observed at the baseline, the participants were not evaluated to rule out dementia and stroke before taking part in the study. Therefore, it cannot be guaranteed that this analytical sample did not include individuals with stroke or cognitive impairment. On the other hand, the high cognitive performance at the baseline may have produced a ceiling effect and hindered our ability to detect positive changes in the test scores of younger people. In addition, cognition is a comprehensive term that refers to several higher‐order behavioral skills,47 and the tests analyzed in this study embrace few mental abilities. Thus, because the ELSA‐Brasil test battery is limited, we could not fully investigate important domains of cognitive performance that might be affected by cf‐PWV. Finally, our results are based on 2 waves of testing, and hence do not allow testing curvilinear changes in cognition over time, as reported in the BLSA for cf‐PWV and memory.8
The retention rate at wave 2 was high (94.1%); however, among the participants eligible for this study, 509 chose not to participate. Lost individuals were older, with a lower schooling level and a higher prevalence of hypertension and diabetes mellitus than the participants. Although the losses were small, as these factors are associated with PWV and cognitive function decline, this may have contributed to underestimate the associations observed in the present study.
Our graphic analysis suggests that participants who were younger (aged ≤65 years) at the baseline showed improved performance in the Memory and Trail B Tests over time, whereas participants with a lower cf‐PWV at the baseline (<95th percentile) only improved their performance in the Memory Test. The reapplication of these tests in a shorter time frame may lead to improved performance, particularly in the Memory Test, because of the learning effect.
To minimize the learning effect, in the follow‐up visit, the 10 words of the Memory Test were presented in a different order. Flora (eg, trees, flowers, fruit, and vegetables) and letter (A) were used for verbal fluency tests in the second visit, instead of animals (eg, 4‐legged animals, birds, fish, and insects) and letter (F) at the baseline. We do not believe that these changes have affected our results, as both flora and the letter (A) and animals and the letter (F) have broad and well‐known vocabularies.
Conclusions
The results of this study, based on a large and unique sample from a middle‐income country and a sophisticated statistical analysis, support that aortic stiffness and older age are associated with poorer longitudinal trajectory in different cognitive abilities, evaluated by 3 tests over a short time interval. There are still some gaps to fulfill in relation to cf‐PWV and cognitive decline, which can only be addressed by a longer follow‐up using a comprehensive battery of tests combined with a large sample.
Sources of Funding
This work was supported by the Brazilian Ministry of Health (Department of Science and Technology) and the Ministry of Science, Technology, and Innovation (FINEP, Financiadora de Estudos e Projetos and CNPq, National Research Council) and Ministry of Education. S.T. Menezes received a postgraduate fellowship from the Brazilian Coordination for the Improvement of Higher Education Personnel (CAPES), Finance Code 001. Drs Barreto, Mill, and Ribeiro are research fellows of CNPq, Brazil. ALPR and SMB were also supported by the Fundação de Amparo à Pesquisa de Minas Gerais (FAPEMIG, Brazil; PPM‐00428‐17 and PPM‐00274‐17).
Disclosures
The disclosures are correct.
Supporting information
Table S1. Additional Methods Information
Table S2. Association of Carotid Femoral Pulse Wave Velocity (cf‐PWV) at Baseline and Performance in the Cognitive Function Test in the Time Interval Between Visits, Estimated by Linear Mixed‐Effect Regression. ELSA‐Brasil. (N=6.927)
Table S3. Association of Age at Baseline and Performance in the Cognitive Function Test in the Time Interval Between Visits, Estimated by Linear Mixed‐Effect Regression. ELSA‐Brasil. (N=6.927)
Acknowledgments
We thank all ELSA‐Brasil (Brazilian Longitudinal Study of Adult Health) participants for their valuable contribution to this study.
(J Am Heart Assoc. 2019;8:e013248 DOI: 10.1161/JAHA.119.013248.)
References
- 1. Breteler MM. Vascular risk factors for Alzheimer's disease: an epidemiologic perspective. Neurobiol Aging. 2000;21:153–160. [DOI] [PubMed] [Google Scholar]
- 2. Hajjar I, Goldstein FC, Martin GS, Quyyumi AA. Roles of arterial stiffness and blood pressure in hypertension‐associated cognitive decline in healthy adults. Hypertension. 2016;67:171–175. [DOI] [PMC free article] [PubMed] [Google Scholar]
- 3. Mitchell GF. Arterial stiffness and hypertension: chicken or egg? Hypertension. 2014;64:210–214. [DOI] [PMC free article] [PubMed] [Google Scholar]
- 4. Singer J, Trollor JN, Baune BT, Sachdev PS, Smith E. Arterial stiffness, the brain and cognition: a systematic review. Ageing Res Rev. 2014;15:16–27. [DOI] [PubMed] [Google Scholar]
- 5. Iulita MF, Noriega de la Colina A, Girouard H. Arterial stiffness, cognitive impairment and dementia: confounding factor or real risk? J Neurochem. 2017;144:527–548. [DOI] [PubMed] [Google Scholar]
- 6. Li X, Lyu P, Ren Y, An J, Dong Y. Arterial stiffness and cognitive impairment. J Neurol Sci. 2017;380:1–10. [DOI] [PubMed] [Google Scholar]
- 7. Elias MF, Robbins MA, Budge MM, Abhayaratna WP, Dore GA, Elias PK. Arterial pulse wave velocity and cognition with advancing age. Hypertension. 2009;53:668–673. [DOI] [PMC free article] [PubMed] [Google Scholar]
- 8. Waldstein SR, Rice SC, Thayer JF, Najjar SS, Scuteri A, Zonderman AB. Pulse pressure and pulse wave velocity are related to cognitive decline in the Baltimore Longitudinal Study of Aging. Hypertension. 2008;51:99–104. [DOI] [PubMed] [Google Scholar]
- 9. Poels MM, van Oijen M, Mattace‐Raso FU, Hofman A, Koudstaal PJ, Witteman JC, Breteler MM. Arterial stiffness, cognitive decline, and risk of dementia: the Rotterdam study. Stroke. 2007;38:888–892. [DOI] [PubMed] [Google Scholar]
- 10. Watson NL, Sutton‐Tyrrell K, Rosano C, Boudreau RM, Hardy SE, Simonsick EM, Najjar SS, Launer LJ, Yaffe K, Atkinson HH, Satterfield S, Newman AB. Arterial stiffness and cognitive decline in well‐functioning older adults. J Gerontol A Biol Sci Med Sci. 2011;66:1336–1342. [DOI] [PMC free article] [PubMed] [Google Scholar]
- 11. Laurent S, Cockcroft J, Van Bortel L, Boutouyrie P, Giannattasio C, Hayoz D, Pannier B, Vlachopoulos C, Wilkinson I, Struijker‐Boudier H; European Network for Non‐invasive Investigation of Large Arteries . Expert consensus document on arterial stiffness: methodological issues and clinical applications. Eur Heart J. 2006;27:2588–2605. [DOI] [PubMed] [Google Scholar]
- 12. Scuteri A, Lakatta EG. Bringing prevention in geriatrics: evidences from cardiovascular medicine supporting the new challenge. Exp Gerontol. 2013;48:64–68. [DOI] [PMC free article] [PubMed] [Google Scholar]
- 13. Benetos A, Adamopoulos C, Bureau JM, Temmar M, Labat C, Bean K, Thomas F, Pannier B, Asmar R, Zureik M, Safar M, Guize L. Determinants of accelerated progression of arterial stiffness in normotensive subjects and in treated hypertensive subjects over a 6‐year period. Circulation. 2002;105:1202–1207. [DOI] [PubMed] [Google Scholar]
- 14. Tsao CW, Himali JJ, Beiser AS, Larson MG, DeCarli C, Vasan RS, Mitchell GF, Seshadri S. Association of arterial stiffness with progression of subclinical brain and cognitive disease. Neurology. 2016;86:619–626. [DOI] [PMC free article] [PubMed] [Google Scholar]
- 15. Zeki Al Hazzouri A, Newman AB, Simonsick E, Sink KM, Sutton Tyrrell K, Watson N, Satterfield S, Harris T, Yaffe K; Health ABC Study . Pulse wave velocity and cognitive decline in elders: the Health, Aging, and Body Composition study. Stroke. 2013;44:388–393. [DOI] [PMC free article] [PubMed] [Google Scholar]
- 16. Scuteri A, Tesauro M, Guglini L, Lauro D, Fini M, Di Daniele N. Aortic stiffness and hypotension episodes are associated with impaired cognitive function in older subjects with subjective complaints of memory loss. Int J Cardiol. 2013;169:371–377. [DOI] [PubMed] [Google Scholar]
- 17. Benetos A, Watfa G, Hanon O, Salvi P, Fantin F, Toulza O, Manckoundia P, Agnoletti D, Labat C, Gautier S; PARTAGE Study Investigators . Pulse wave velocity is associated with 1‐year cognitive decline in the elderly older than 80 years: the PARTAGE study. J Am Med Dir Assoc. 2012;13:239–243. [DOI] [PubMed] [Google Scholar]
- 18. Deary IJ, Corley J, Gow AJ, Harris SE, Houlihan LM, Marioni RE, Penke L, Rafnsson SB, Starr JM. Age‐associated cognitive decline. Br Med Bull. 2009;92:135–152. [DOI] [PubMed] [Google Scholar]
- 19. Zaninotto P, Batty GD, Allerhand M, Deary IJ. Cognitive function trajectories and their determinants in older people: 8 years of follow‐up in the English Longitudinal Study of Ageing. J Epidemiol Community Health. 2018;72:685–694. [DOI] [PMC free article] [PubMed] [Google Scholar]
- 20. Aquino EM, Barreto SM, Bensenor IM, Carvalho MS, Chor D, Duncan BB, Lotufo PA, Mill JG, Molina Mdel C, Mota EL, Passos VM, Schmidt MI, Szklo M. Brazilian Longitudinal Study of Adult Health (ELSA‐Brasil): objectives and design. Am J Epidemiol. 2012;175:315–324. [DOI] [PubMed] [Google Scholar]
- 21. Schmidt MI, Duncan BB, Mill JG, Lotufo PA, Chor D, Barreto SM, Aquino EM, Passos VM, Matos SM, Molina Mdel C, Carvalho MS, Bensenor IM. Cohort profile: longitudinal study of adult health (ELSA‐Brasil). Int J Epidemiol. 2015;44:68–75. [DOI] [PMC free article] [PubMed] [Google Scholar]
- 22. Batista JA, Giatti L, Barreto SM, Galery ARP, Passos VMA. Reliability of cognitive tests of ELSA‐Brasil, the brazilian longitudinal study of adult health. Dement Neuropsychol. 2013;7:367–373. [DOI] [PMC free article] [PubMed] [Google Scholar]
- 23. Bertolucci PHF, Okamoto IH, Toniolo Neto J, Ramos LR, Brucki SMD. Desempenho da população brasileira na bateria neuropsicológica do Consortium to Establish a Registry for Alzheimer's Disease (CERAD). Rev Psiquiatr Clín (São Paulo). 1998;23:80–83. [Google Scholar]
- 24. Morris JC, Heyman A, Mohs RC, Hughes JP, van Belle G, Fillenbaum G, Mellits ED, Clark C. The Consortium to Establish a Registry for Alzheimer's Disease (CERAD), part I: clinical and neuropsychological assessment of Alzheimer's disease. Neurology. 1989;39:1159–1165. [DOI] [PubMed] [Google Scholar]
- 25. Lezak MD. Neuropsychological Assessment. New York: Oxford University Press; 2004. [Google Scholar]
- 26. Asmar R, Benetos A, Topouchian J, Laurent P, Pannier B, Brisac AM, Target R, Levy BI. Assessment of arterial distensibility by automatic pulse wave velocity measurement: validation and clinical application studies. Hypertension. 1995;26:485–490. [DOI] [PubMed] [Google Scholar]
- 27. Mill JG, Pinto K, Griep RH, Goulart A, Foppa M, Lotufo PA, Maestri MK, Ribeiro AL, Andreão RV, Dantas EM, Oliveira I, Fuchs SC, Cunha Rde S, Bensenor IM. Medical assessments and measurements in ELSA‐Brasil. Rev Saude Publica. 2013;47:54–62. [DOI] [PubMed] [Google Scholar]
- 28. The IPAQ Research Committee . Guidelines for data processing and analysis of the International Physical Activity Questionnaire (IPAQ)–short and long forms. 2005. Available at: http://www.ipaq.ki.se. Accessed May 18, 2018.
- 29. NIAAA . What is a standard drink? National Institute on Alcohol Abuse and Alcoholism (NIAAA). https://www.niaaa.nih.gov/alcohol-health/overview-alcohol-consumption/what-standard-drink. Accessed April 18, 2019.
- 30. Fausto MA, Carneiro M, Antunes CM, Pinto JA, Colosimo EA. Mixed linear regression model for longitudinal data: application to an unbalanced anthropometric data set. Cad Saude Publica. 2008;24:513–524. [DOI] [PubMed] [Google Scholar]
- 31. Cnaan A, Laird NM, Slasor P. Using the general linear mixed model to analyse unbalanced repeated measures and longitudinal data. Stat Med. 1997;16:2349–2380. [DOI] [PubMed] [Google Scholar]
- 32. Molenberghs G, Verbeke G. A review on linear mixed models for longitudinal data, possibly subject to dropout. Stat Model. 2001;1:235–269. [Google Scholar]
- 33. Diggle P, Liang K‐Y, Zeger SL. Longitudinal Data Analysis. New York, NY: Oxford University Press; 1994;5:13. [Google Scholar]
- 34. O'Rourke MF, Hashimoto J. Mechanical factors in arterial aging: a clinical perspective. J Am Coll Cardiol. 2007;50:1–13. [DOI] [PubMed] [Google Scholar]
- 35. Kaess BM, Rong J, Larson MG, Hamburg NM, Vita JA, Levy D, Benjamin EJ, Vasan RS, Mitchell GF. Aortic stiffness, blood pressure progression, and incident hypertension. JAMA. 2012;308:875–881. [DOI] [PMC free article] [PubMed] [Google Scholar]
- 36. Mitchell GF. Effects of central arterial aging on the structure and function of the peripheral vasculature: implications for end‐organ damage. J Appl Physiol. 2008;105:1652–1660. [DOI] [PMC free article] [PubMed] [Google Scholar]
- 37. Mitchell GF, van Buchem MA, Sigurdsson S, Gotal JD, Jonsdottir MK, Kjartansson Ó, Garcia M, Aspelund T, Harris TB, Gudnason V, Launer LJ. Arterial stiffness, pressure and flow pulsatility and brain structure and function: the Age, Gene/Environment Susceptibility‐Reykjavik study. Brain. 2011;134:3398–3407. [DOI] [PMC free article] [PubMed] [Google Scholar]
- 38. Pase MP, Herbert A, Grima NA, Pipingas A, O'Rourke MF. Arterial stiffness as a cause of cognitive decline and dementia: a systematic review and meta‐analysis. Intern Med J. 2012;42:808–815. [DOI] [PubMed] [Google Scholar]
- 39. Scuteri A, Nilsson PM, Tzourio C, Redon J, Laurent S. Microvascular brain damage with aging and hypertension: pathophysiological consideration and clinical implications. J Hypertens. 2011;29:1469–1477. [DOI] [PubMed] [Google Scholar]
- 40. Sadekova N, Iulita MF, Vallerand D, Muhire G, Bourmoum M, Claing A, Girouard H. Arterial stiffness induced by carotid calcification leads to cerebral gliosis mediated by oxidative stress. J Hypertens. 2017;36:286–298. [DOI] [PubMed] [Google Scholar]
- 41. Hedden T, Gabrieli JD. Insights into the ageing mind: a view from cognitive neuroscience. Nat Rev Neurosci. 2004;5:87–96. [DOI] [PubMed] [Google Scholar]
- 42. Deary IJ. Intelligence. Annu Rev Psychol. 2012;63:453–482. [DOI] [PubMed] [Google Scholar]
- 43. Horn JL, Cattell RB. Age differences in fluid and crystallized intelligence. Acta Psychol (Amst). 1967;26:107–129. [DOI] [PubMed] [Google Scholar]
- 44. Van der Elst W, Molenberghs G, Van Boxtel MP, Jolles J. Establishing normative data for repeated cognitive assessment: a comparison of different statistical methods. Behav Res Methods. 2013;45:1073–1086. [DOI] [PubMed] [Google Scholar]
- 45. Pinheiro J, Bates D. LME and nLME: mixed effects models methods and classes for S and S‐Plus. PC Windows.1995;96:1–35. [Google Scholar]
- 46. Scuteri A, Tesauro M, Appolloni S, Preziosi F, Brancati AM, Volpe M. Arterial stiffness as an independent predictor of longitudinal changes in cognitive function in the older individual. J Hypertens. 2007;25:1035–1040. [DOI] [PubMed] [Google Scholar]
- 47. Elias MF, Torres RV, Davey A. Clinical trials of blood pressure lowering and antihypertensive medication: is cognitive measurement state‐of‐the‐art? Am J Hypertens. 2018;31:631–642. [DOI] [PMC free article] [PubMed] [Google Scholar]
Associated Data
This section collects any data citations, data availability statements, or supplementary materials included in this article.
Supplementary Materials
Table S1. Additional Methods Information
Table S2. Association of Carotid Femoral Pulse Wave Velocity (cf‐PWV) at Baseline and Performance in the Cognitive Function Test in the Time Interval Between Visits, Estimated by Linear Mixed‐Effect Regression. ELSA‐Brasil. (N=6.927)
Table S3. Association of Age at Baseline and Performance in the Cognitive Function Test in the Time Interval Between Visits, Estimated by Linear Mixed‐Effect Regression. ELSA‐Brasil. (N=6.927)