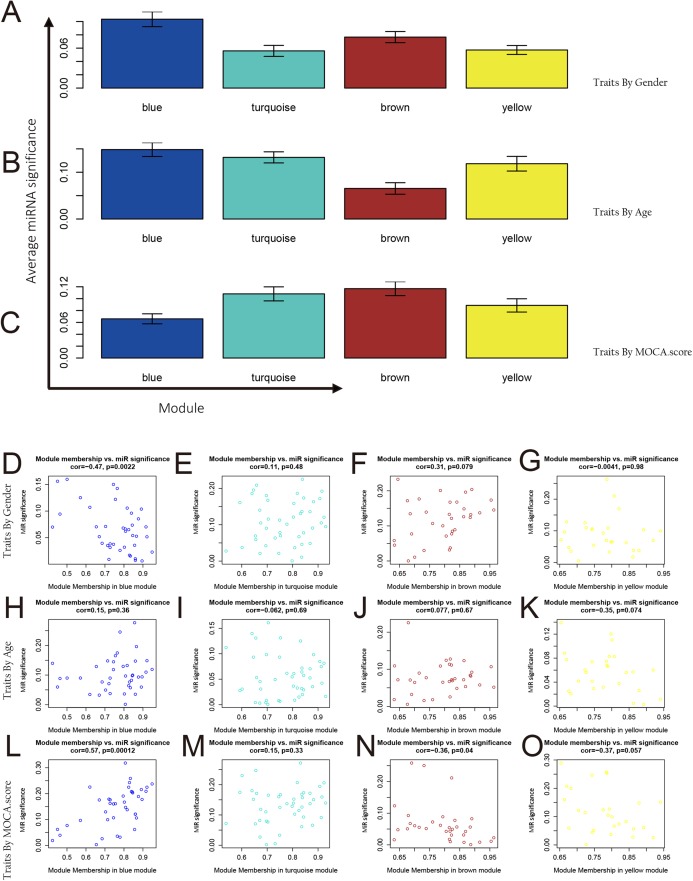
Figure 5. MiRNAs and phenotype correlation of modules.
(A–C) Correlation between integration modules and phenotypes and miRNA and phenotypic correlation in modules. The average miRNA significance in the blue module, the turquoise module, and the yellow module was highly correlated with age; the average miRNA significance in the turquoise module and the brown module was highly correlated with the MOCA score. (D–O) Analysis of miRNAs and phenotype correlation of modules. From the analysis results in the figure, it was known that age has a high correlation with the miRNA in the blue module (p < 0.001) and the brown module (p < 0.05). The MOCA score was highly correlated with the miRNA in the blue module (p < 0.01).

