Abstract
The G protein-coupled estrogen receptor 1 (GPER) produces cardioprotective effects. However, the underlying mechanisms are not well understood. We aimed to investigate the role of GPER in β adrenoceptor-mediated cardiac contraction and myocardial signaling. In anesthetized animals, intrajugular administration of isoproterenol produces a rapid and sustained rise in left ventricular pressure (LVP) and increases ectopic contractions. Administration of the GPER agonist G-1 during the plateau phase of isoproterenol-induced LVP increase rapidly restores LVP to baseline levels and reduces the frequency of ectopic contractions. In freshly isolated cardiomyocytes, isoproterenol potentiates electrically induced peak currents of L-type Ca2+ channels (LTCC) and increases the potential sensitivity of their inactivation. Coadministration of G-1 prevents isoproterenol-induced potentiation of peak LTCC currents and makes channels more sensitive to being inactivated compared to isoproterenol alone. Isoproterenol treatment of cardiomyocytes without electrical stimulation triggers slow-rising Ca2+ signals that are inhibited by the β1AR antagonist metoprolol but not by β2AR antagonist ICI-118551. G-1 pretreatment dose-dependently suppresses isoproterenol-induced total Ca2+ signals and the amplitude and frequency of the intrinsic Ca2+ oscillatory deflections. Pretreatment with the GPER antagonist G-36 produces opposite effects, dose-dependently increasing these signals. ISO promotes robust phosphorylation of Cav1.2 channels at Ser1928. G-1 pretreatment inhibits isoproterenol-stimulated phosphorylation of Cav1.2 at Ser1928, while G-36 pretreatment enhances this signal. Our data indicate that GPER functions as an intrinsic component of β1AR signaling to moderate myocardial Ca2+ dynamics and contraction.
Keywords: β1 adrenoceptor, GPER, Contraction, Calcium, Cav1.2 channel
Graphical Abstract

1. Introduction
Sympathetic nerve activities are essential for normal cardiac functions. Excessive and prolonged sympathetic activation, however, promotes pathological ventricular remodeling. Measures to control sympathetic responses thus constitute an important component of the management of heart failure [1]. The β1 adrenoceptor (β1AR) is the predominant adrenergic receptor in the heart. Physiologically, β1AR activation potentiates electrically induced Ca2+ current through L-type voltage-dependent Ca2+ channels (ICa,L), thereby enhancing myocardial contractility [2]. β1AR activation also facilitates SR Ca2+ release via increase in ICa,L trigger [3]. Mechanistically, most of these effects result from cAMP-dependent protein kinase A (PKA) activation; β1AR-mediated PKA activation promotes phosphorylation of Cav1.2 channels, where Ser1928 is frequently recognized as a target site [4, 5].
While the effects of β1AR activation in the heart are relatively well understood, regulatory inputs of β1AR activity are not entirely clear, notably in the context of estrogen biology. Following menopause, the incidence of cardiac dysfunction in women increases [6, 7]. These changes are largely attributed to loss of cardioprotective effects of 17β-estradiol (E2). However, mechanisms whereby E2 protects cardiac functions are not well understood. This is partially due to the existence of three estrogen receptors (ERs) with distinct and complex actions, including ERα, ERβ and the G protein-coupled estrogen receptor 1 (GPER, a.k.a. GPR30). ERβ is not expressed in the heart, yet the vascular effects of its deletion cause hypertension and indirectly lead to alterations in myocardial intercalated discs, gap junctions and nuclear structure.[8] Following ischemia and reperfusion, ERα−/− hearts show lower coronary flow, greater Ca2+ accumulation, less nitrite production, and enhanced interstitial edema and contraction bands [9], consistent with ERα expression in cardiomyocytes [10]. However, deletion of both ERα and ERβ does not affect E2-induced inhibition of voltage-dependent Ca2+ influx and contraction in cardiomyocytes [11]. These findings indicate that ERα and ERβ are not fully responsible for the effects of E2 on cardiac function and suggest that another receptor is involved. GPER is an estrogen-sensitive 7-pass transmembrane receptor [12, 13] and is implicated in many cardiovascular functions [14, 15]. GPER deletion leads to reduced myocardial contractility and increased left ventricular (LV) end-diastolic pressure [16]. Cardiomyocyte-specific deletion of GPER causes ventricular dysfunction and adverse remodeling [17]. In the vasculature, GPER promotes eNOS activity via various mechanisms [18-20] and protects from atherosclerosis [21].
Despite numerous implications of GPER in cardiovascular function, the impact of its activity on βAR-mediated myocardial functions is unclear. In this study, we tested the hypothesis that GPER directly regulates βAR-mediated changes in cardiac contractility and myocardial Ca2+ dynamics. Effects of acute alterations in GPER activity were examined on isoproterenol (ISO)-stimulated activities in living hearts and Ca2+ signaling in freshly isolated cardiomyocytes. The results indicate that GPER activity is an intrinsic component of β1AR-mediated signaling in the myocardium.
2. Methods and Materials
2.1. Measurement of left ventricular pressure
Sprague-Dawley female rats (170-207 g body weight) were anesthetized with inhaled 2-3% isoflurane (Phoenix Mfr. for Clipper Distributing Company, LLC, St. Joseph, MO). The ventral region of the neck was shaved for a midline longitudinal incision. After exposure of the left jugular vein, a saline-filled polyethylene catheter was inserted and secured with ties for experimental agent infusion. The catheter was connected to a 2-way stopcock attached to a syringe. The right common carotid artery was then isolated, through which a pressure-transducer catheter (SPR-320, Millar Instruments, Houston, TX) was advanced into the LV. Pressure measurements were coupled to a bridge amp connected to a PowerLab 8/35 (AD Instruments, Colorado Springs, CO) for signal acquisition. Signals were digitized and analyzed using LabChart 8 software (AD Instruments). After stabilization and baseline recording, ISO (1 μg/g. Millipore Sigma, Burlington, MA) was administered IV and the response was recorded. GPER agonist G-1 (1 μg/g, Cayman Chemical, Ann Arbor, MI) was administered IV during the plateau phase of ISO-induced increase in LVP. Heart rate, LVP (mmHg), and LVP change over time dP/dt (mmHg/s) were monitored using the LabChart software. The animals’ body temperature was maintained throughout the experimental duration using a heated platform. All animal experiments were approved by Des Moines University Institutional Animal Care and Use Committee.
2.2. Isolation of primary murine cardiomyocytes (PMCMs)
Male mice 8 – 16 weeks of age were used for solation of cardiomyocytes according to a protocol described by Ackers-Johnson and colleagues [22]. Briefly, mice were sacrificed by cervical dislocation, followed by incision of the chest. The descending aorta and vena cava were severed, followed by injection of ethylenediaminetetra-acetic acid (EDTA) buffer (in mM: 130 NaCl, 5 KCl, 0.5 NaH2PO4, 10 HEPES, 10 glucose, 10 butanedione monoxime (BDM, Millipore-Sigma, St. Louis, MO), 10 taurine, 5 EDTA, pH 7.8) into the right ventricle to chelate Ca2+, which stops contraction and prevents coagulation. The ascending aorta was then clamped and cut above the clamp to remove the heart. The clamped heart was submerged in EDTA buffer, while the LV received injection of this buffer to further prevent coagulation and contraction. The heart was next submerged in perfusion buffer (in mM: 130 NaCl, 5 KCl, 0.5 NaH2PO4, 10 HEPES, 10 glucose, 10 BDM, 1 MgCl2, pH 7.8), which was also injected into the LV to remove the EDTA buffer. The heart was then submerged in and injected with pre-warmed collagenase buffer [in mM: 0.5 collagenase 2, 0.5 collagenase 4 (Worthington Biochemical Corp., Lakewood, NJ), 0.05 protease XIV (Millipore Sigma, Burlington, MA)]. After sufficient digestion, the atria were removed, the ventricles were submerged in new collagenase buffer and were gently teased apart, followed by trituration with a cut pipet tip. Stop buffer (perfusion buffer plus 5% fetal bovine serum) was then added to stop further digestion by collagenases, and the pieces were gently triturated again. The cell suspension was next passed through a 100-μm pore size strainer, followed by washing with an additional volume of stop buffer. Cells were settled by gravity, followed by successive resuspension in three Ca2+-reintroduction buffers [containing 75, 50 and 25 vol% perfusion buffer and 25, 50 and 75 vol% culture media [M-199 medium, 0.1% bovine serum albumin, 10 mM BDM, 1X ITS-Plus media supplement (R&D Systems, Minneapolis, MN)], respectively, yielding final CaCl2 concentrations of 0.34, 0.68, and 1.02 mM, respectively] to allow the medium to return to physiological Ca2+ levels. PMCMs were seeded onto laminin (Corning, Tewksbury, MA)-coated culture dishes or #1.5 cover glass in pre-warmed plating media (5% fetal bovine serum, 10 mM BDM in M-199 medium). After an hour, the plating media was replaced with culture media to reduce ionic fluctuations and the PMCMs were then ready for experimentation. The myocardial nature of the isolated cells was confirmed by typical rod-shaped morphology and cardiac troponin T immunofluorescence (mouse monoclonal antibody 00/07-T19-C11, Advanced Immunochemical Inc., Long Beach, CA).
2.3. Cell electrophysiology
Freshly isolated PMCMs were plated onto 15-mm circular coverslips and maintained at 37°C before recordings. For whole-cell patch clamp recordings, coverslips were transferred to a submerged recording chamber at room temperature perfused (2 ml/min) by oxygenated (95% O2/5% CO2) artificial cerebral spinal fluid (aCSF) containing (in mM): 140 NaCl, 10 CsCl, 10 glucose, 10 HEPES, 1.0 MgCl2, with 1.8 BaCl2 substituted for CaCl2, and 10 2,3-butanedione monoxime (BDM) adjusted to pH 7.4 with NaOH. Patch electrodes were filled with an internal solution containing (in mM): 140 CsCl, 10 HEPES, 2 MgCl2, 5 NaATP, 0.6 NaGTP, 10 EGTA, and 2.0 QX314, and had an open tip resistance of 3-6Ω. Inclusion criteria for analysis were that access resistance and baseline holding currents did not change over 20% throughout the experimental duration. Data were acquired at 2 kHz with an Axon 700B patch-clamp amplifier (Axon Instruments, Sunnyvale, USA), digitized using a Digidata 1550B (Axon Instruments) and analyzed offline using Clampex software (Molecular Devices, San Jose, USA). Recording protocols were similar to those previously reported [23]. Briefly, current-voltage (IV) relationships were recorded in voltage-clamp mode using stepwise depolarization of membrane potentials every 20s (−50 mV baseline, 10-mV steps). Inactivation measures were conducted using a two-pulse gapped protocol (−40 mV baseline), where a conditioning prepulse (−80mV to +10mV) was followed by a return to baseline (−40 mV, 10 ms), followed by a stepped depolarization (0 mV, 250 ms) at 10 s intervals.
2.4. Measurement of intracellular Ca2+ concentration
Two-four hours after isolation, PMCMs were loaded with 5 μM fura-2/AM (Thermo Fisher Scientific, Waltham, MA) in culture media at 37°C for 30 min. Fura-2/AM was then completely removed, followed by a 15-minute equilibration period in modified Tyrode’s buffer (composition in mM: 150 NaCl, 2.7 KCl, 1.2 KH2PO4, 1.2 MgSO4, 10 HEPES, 1.5 CaCl2, pH 7.4) before the beginning of experiment. The imaging system and measurement procedures were described previously [24]. All ratio values were derived from individual fura-2 fluorescence intensities at 510 nm in response to excitation at 340 and 380 nm, after subtraction of no-cell zone background time course obtained in each experiment. To calculate free Ca2+ levels in individual cells, Rmax values were obtained in all cells by addition of 10 μM ionomycin (Cayman Chemical, Ann Arbor, MI) and 10 mM CaCl2 at the end of every time course. Rmin values were calculated from Rbasal values in individual cells using equations described earlier [24]. To compare the effects of treatments, integrated areas under the curve (AUCs) were calculated for the entire time courses of changes in Ca2+ concentration for individual cells. Average AUC values from all cells were used for statistical analysis.
2.5. Molecular Biology
The fragment representing murine Cav1.2 a.a. 1887-1905 sequence LRSASLGRRASFHLECLKR was PCR amplified, incorporating a BamHI restriction site to the N terminus and XbaI site following a stop codon at the C terminus. The primers (IDTDNA, Coraville, IA) were: CATTGGATCCCTTCGCTCTGCCTCTCTAGGTCGAAGGGCCTCCTTC (forward), and CGCGCTCTAGATTATCGCTTTAGACATTCCAGATGGAAGGAGGCCCTTCG (reverse). Similar procedure was carried out for fragment LRSASLGAAAAFHLECLKR with the primers: CAATGGATCCCTTCGCTCTGCCTCTCTAGGTGCTGCAGCCGCTTTCCA (forward), and CACGTCTAGATTATCGCTTTAGACATTCCAGATGGAAAGCGGCTGCAG (reverse). The fragments were subsequently inserted downstream of an EYFP in place of calmodulin (CaM) in a pcDNA3.1 plasmid encoding EYFP-CaM (a gift from Dr. Anthony Persechini, University of Missouri-Kansas City). All constructs were verified by DNA sequencing.
2.6. Cell line culture and transfection
Human embryonic kidney (HEK) 293 cells were purchased from AddexBio (T0011001, initial passage 10) and cultured in DMEM medium with 10% fetal bovine serum and 1% penicillin/streptomycin in 90% humidified condition with 5% CO2 at 37°C. Transfection was carried out as described previously [25].
2.7. Immunoblotting
Immunoblotting was carried out as described previously [25]. After treatment, PMCMs were lysed, and protein content of lysate was measured in triplicate using the BCA assay (Thermo Fisher Scientific, Waltham, MA). Equal amounts of total proteins were loaded for Western blotting. Following SDS-PAGE, membranes were stained with Ponceau-S to verify equal total protein loading. After washing of membranes, Cav1.2 phosphorylation at Ser1928 was immunoblotted using a polyclonal rabbit phosphospecific antibody (PA5-64748, ThermoFisher Scientific, Waltham, MA). Relative densitometric values of phosphorylation at Ser1928 Cav1.2 were corrected for total protein loading Ponceau-S staining using the corresponding densitometric values of the entire protein lanes. Densitometric analysis was done using Image Lab 5.2.1 software (Bio-Rad, Hercules, CA).
2.8. Statistical analysis
Data were normally distributed and show means ± S.D. Statistical analysis was done using Student’s t-test or one-way ANOVA. Tukey post-hoc tests were subsequently applied where appropriate, across all possible group comparisons. Statistical significance was determined as p < 0.05. Group sizes were estimated prior to experiments by effect size calculations and previous experimental outcomes. All p values obtained are indicated on figures or figure legends where appropriate. Statistical analysis was conducted using GraphPad Prism 8.0 (San Diego, CA) software.
3. Results
3.1. GPER activation inhibits ISO-induced changes in LVP, heart rate and ectopic contractions
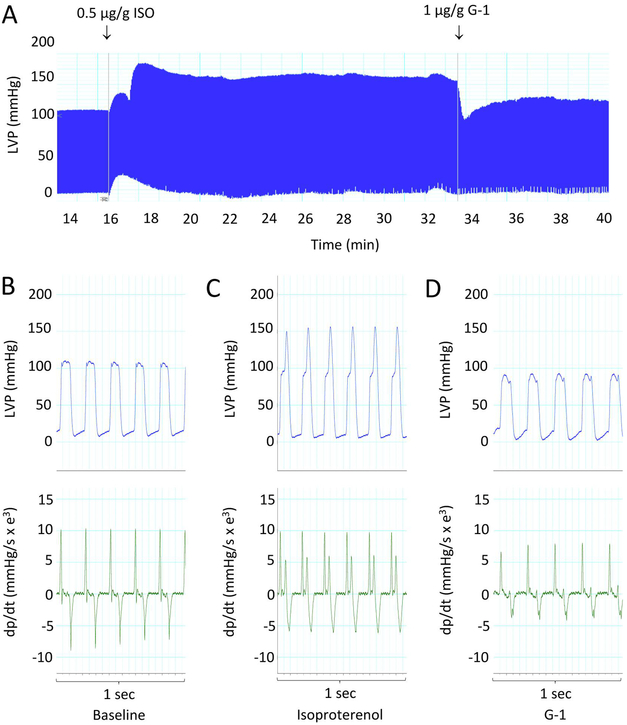
GPER is equally expressed in cardiovascular tissues between male and female rats [26] and between premenopausal women and age-matched men [27]. To assess how GPER activity acutely affects βAR-mediated cardiac contraction/relaxation, we tested the effect of the GPER agonist G-1 on isoproterenol-induced changes in left ventricular pressure in female anesthetized rats. An intraventricular catheter was introduced via the aortic arch. After catheter stabilization, LVP was monitored for 10 minutes with two 1.0-ml flushes of 0.9% saline for baseline recording. Baseline LVP was stable at 100/0 mmHg. ISO injection rapidly increased LVSP from 100 ± 5 to 165 ± 3 mmHg within 1-2 min and maintained it around 150 ± 8 mmHg over a prolonged period. LVDP was reduced from 10 ± 5 to 5 ± 3 mmHg. Injection of GPER agonist G-1 (1 μg/g) during the sustained phase of ISO-induced LVP increase rapidly reduced LVSP to 95 ± 5 mmHg, which slowly rose to and remained at 105 ± 5 mmHg for an extended period (Fig. 1A). Figures 1B-D show 1-sec intervals of regular (without ectopic contractions) pressure tracing (upper panels) and rate of LV pressure change (dp/dt, lower panels) at baseline (B), after ISO injection (C), and after G-1 injection (D). ISO increased the rates of pressure change during the later phase of LV ejection (Fig. 1C). G-1 injection restored both the peak LVP and the rate of LVP rise in the presence of ISO to baseline levels (Fig. 1D).
Figure 1.
Effect of G-1 on ISO-induced increases in myocardial contraction. A, LVP measured in an anesthetized rat using a direct LV pressure probe. ISO and G-1 were injected via a via a jugular catheter as indicated (arrows). B–D, 1-second strips of regular LVP and corresponding dp/dt at baseline, during ISO response, and after injection of G-1, respectively. Data are representative of n = 4 animals.
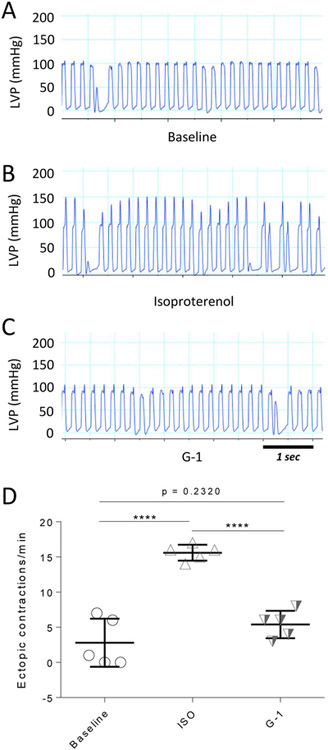
ISO injection significantly increased heart rate from a basal value of 336 ± 1 bpm to 352 ± 0.5 bpm. Injection of G-1 during the plateau phase of ISO-induced LVP increases significantly reduced heart rate to 304 ± 0.3 bpm. ISO also caused a significant increase in the number of ectopic contractions. Figures 2A-C show 5-sec intervals of LVP recordings at baseline, after ISO injection, and after G-1 injection, respectively. ISO significantly increased the number of ectopic contractions 3-fold from baseline. Injection of G-1 virtually abolished this effect (Fig. 2D).
Figure 2.
Effect of G-1 on ISO-induced ectopic contractions. A-C, 5-s strips of LVP tracing at baseline, after ISO injection, and following injection of G-1, respectively. D, Number of ectopic contractions at baseline, during ISO injection, and after G-1 injection. ****, p < 0.0001. Data are from 4 animals.
3.2. Effect of GPER activation on ISO-induced L-type Ca2+ channel activities
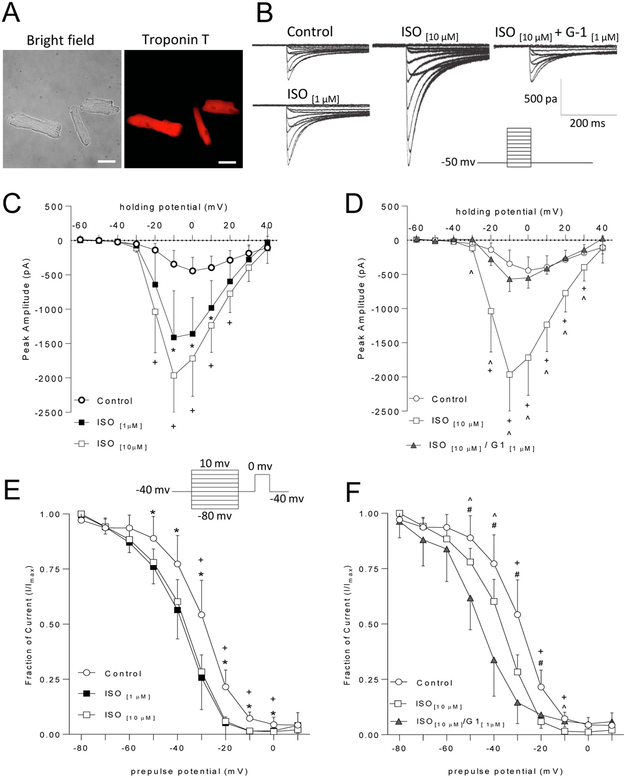
To begin examining the mechanisms underlying the observed effects of GPER activation on βAR-mediated potentiation of cardiac contraction/relaxation, we freshly isolated primary murine cardiomyocytes and tested the effects of GPER agonist G-1 on ISO-induced potentiation of L-type Ca2+ channel activities. Figure 3A shows typical cardiomyocyte morphology in bright-field image (left) and cardiac troponin T immunofluorescence (right) of freshly isolated PMCMs. Figure 3B shows representative LTCC-mediated current responses in response to various clamped voltages in PMCMs under control condition, in the presence of ISO or ISO plus G-1. LTCC-mediated current responses were significantly potentiated after bath application of 1 μM and 10 μM ISO. Increasing the ISO concentration from 1 μM to 10 μM did not produce significant enhancement in peak amplitudes (Fig. 3C) nor did further increase in concentration to 50 μM (not shown). However, increasing ISO concentration to 10 μM broadened the range of membrane potentials that produced significant increases in peak amplitude from control values (Figure 3C at −20 mV, +20 mV) as compared to 1 μM ISO. ISO induced a modest leftward shift in the membrane potential that triggered maximal responses. To test the effect of GPER activation on LTCC activities stimulated by ISO, we co-applied 1 μM G-1 (Kd for GPER = 11 nM, [28]) with 10 μM ISO. G-1 significantly attenuated ISO-induced increases in response amplitudes across a wide range of membrane holding potentials, such that 1 μM G-1 + 10 μM ISO did not differ from control responses at any potential measured. Interestingly, G-1 inhibition of peak amplitudes also occurred at holding potentials not significantly increased by ISO alone (−30 mV) (Fig. 3D).
Figure 3.
Effects of G-1 on ISO-induced changes in ICa,L in fresh cardiomyocytes. A, Bright-field images and corresponding immunofluorescence of cardiac troponin T of cardiomyocytes. B, Representative current-voltage traces in the presence of the specified treatment conditions. C, Current-voltage relationships of ICa,L in cardiomyocytes treated with vehicle (control) or the specified concentrations of ISO [One-way ANOVA, Tukey post hoc Tests. Con vs ISO 1μM: −20mV: p = 0.1296; −10mV: p = 0.0086; 0mV: p = 0.0052; +10mV: p = 0.0144; +20mV: p = 0.0725. Con vs ISO 10μM: −20mV: p = 0.0037; −10mV: p = 0.0001; 0mV: p = 0.0002; +10mV: p = 0.0005; +20mV: p = 0.0032. ISO 1 μM vs ISO 10μM: −20mV: p = 0.2670; −10mV: p = 0.2087; 0mV: p = 0.3438; +10mV: p = 0.3746; +20mV: p = 0.3795. D, Current-voltage relationship of ICa,L in cardiomyocytes treated with vehicle (control) ISO 10μM, or G-1. [One-way ANOVA, Tukey post hoc tests: Con vs ISO 10μM: −30mV: p = 0.1176; −20mV: p = 0.001; −10mV: p < 0.0001; 0mV: p < 0.0001; +10mV: p < 0.0001; +20mV: p = 0.0006; +30mV: p = 0.0425. Con vs G1+ISO 10μM: −30mV: p = 0.1319; −20mV: p = 0.8080; −10mV: p = 0.6723; 0mV: p = 0.8673; +10mV: p = 0.9903; +20mV: p = 0.9705; +30mV: p = 0.8539. ISO 10μM vs G1+ISO 10μM: −30mV: p = 0.0029; −20mV: p = 0.0084; −10mV: p = 0.0002; 0mV: p = 0.0001; +10mV: p = 0.0002; +20mVp = 0.0008; +30mV: p = 0.0232]. E, Steady-state inactivation curves in PMCMs treated with vehicle (control) or the specified concentrations of ISO, [One-way ANOVA, Tukey post hoc tests: Con vs ISO 1μM: −50mV: p = 0.0236, −40mV: p = 0.0173; −30mV: p = 0.0027; −20mV: p = 0.0001; −10mV: p = 0.0001; 0mV: p = 0.0434. Con vs ISO 10μM: −50mV: p = 0.0609; −40mV: p = 0.0528; −30mV: p = 0.0059; −20mV: p = 0.0002; −10mV: p = 0.0001: 0mV: p = 0.0001. ISO 1μM vs ISO 10μM: −50mV: p = 0.8747; −40mV: p = 0.8337; −30mV: p = 0.9206; −20mV: p = 0.9620; −10mV: p = 0.9980; 0mV: p = 0.9980]. F, Steady-state inactivation curves in PMCMs treated with vehicle, ISO 10μM, or ISO 10μM + G-1 [One-way ANOVA, Tukey post hoc tests: Con vs.ISO 10μM. −30mV: p = 0.0033: −20mV: p = 0.0005: −10mV: p = 0.001. Con vs G1+ISO 10μM: −30mV: p = 0.0003: −20mV: p = 0.0091; −10mV: p = 0.7481. ISO 10μM vs G1 + ISO 10μM: −30mV: p = 0.1715; −20mV: p = 0.6639; −10mV: p = 0.0118]. Data are presented as mean ± SD of n = 6–9 cells for each condition. *, p < 0.05 control vs 1 μM ISO; +, p < 0.05 control vs 10 μM ISO; ^, p < 0.05 10 μM ISO vs 10 μM ISO + G1; #, p < 0.05 control vs 10 μM ISO + G1. Scale bars, 50 μm.
The observed effects of ISO on peak amplitude could be due to changes in channel inactivation following activity. To test this, we used an established steady state inactivation protocol [23]. As expected, more robust responses at the test pulse were seen following prolonged holding at hyperpolarized potentials compared to those at more depolarized potentials, as reflected by decreased fraction of remaining current (I/Imax) with more depolarized prepulse potentials (Fig. 3E). ISO treatment shifted the SS-inactivation curve downward in a concentration- and prepulse potential-dependent manner (Fig. 3E). Given that peak amplitudes were increased at similar holding potentials (Fig. 3C), this suggests that current transfer is increased at more hyperpolarized potentials leading to decreased responses during the test pulse. Interestingly, 1 μM ISO induced significant inactivation across a wider range of holding potentials than 10 μM ISO but did not differ in magnitude from 10 μM ISO at any prepulse potential (Fig. 3E). Surprisingly, G-1 co-application induced a membrane potential-dependent downward shift in SS-inactivation curves in comparison to 10 μM ISO and no treatment control cells (Fig. 3F).
3.3. Effects of GPER activation on ISO-induced Ca2+ signals in PMCMs
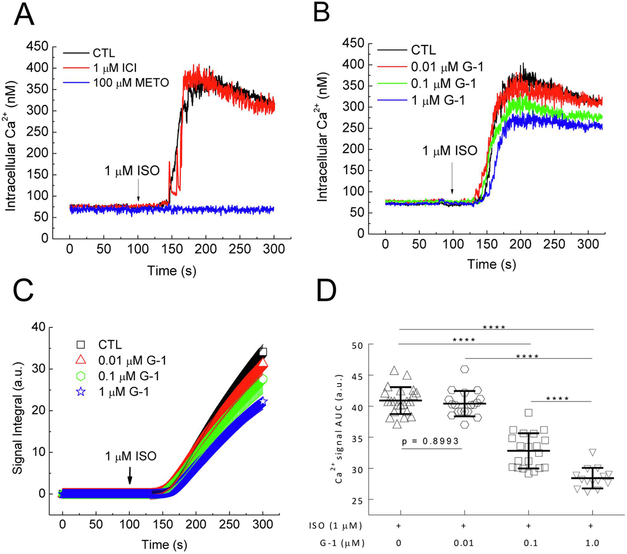
While the data above indicate a role of GPER in dynamically regulating acute cardiac β adrenergic responses, we reasoned that a response produced by a βAR agonist without electrical stimulation of the cells would present a parameter more direct to βAR activation. Administration of ISO (1 μM) to the extracellular medium in the absence of voltage clamping induced a slow increase in intracellular Ca2+ that started ~50s after ISO addition, with small oscillations during the sustained phase (Fig. 4A). ISO did not trigger any Ca2+ signals in the absence of extracellular Ca2+ (not shown), indicating that the signal observed is due to entry of extracellular Ca2+. Pretreatment for 15 minutes with 100 μM metoprolol, a specific β1AR antagonist (Ki = 47 nM, [29]) completely prevented the ISO-induced Ca2+ signal while the β2AR specific antagonist 1 μM ICI-118551, a specific β2-AR antagonist (Ki = 0.7 nM, [29]) did not have an effect (Fig. 4A). This indicates that the ISO-induced Ca2+ signal mainly represents activation of β1AR in PMCMs. To examine the effect of GPER activation on β1AR-mediated Ca2+ signals, PMCMs were pretreated for 15 minutes with various doses of G-1 for 15 minutes before ISO was added. This caused dose-dependent inhibition of the ISO-induced Ca2+ signals (Fig. 4B). To quantitate the signals, integrated areas under the curve of the entire Ca2+ signal time courses were generated (Fig. 4C). Comparisons of the AUC values clearly demonstrated a dose-dependent inhibitory effect of GPER activation on β1AR-mcdiatcd Ca2+ signals in PMCMs (Fig. 4D).
Figure 4.
Effect of G-1 on ISO-induced Ca2+ signals in cardiomyocytes. A, Intracellular Ca2+ time courses in response to 1 μM ISO in PMCMs pretreated for 15 min with the specified concentrations of metoprolol (METO) or ICI-118551 (ICI) before ISO addition (arrow). B–C, Intracellular Ca2+ (B) and corresponding integrated AUC (C) time courses in response to 1 μM ISO in PMCMs pretreated for 15 min with the specified concentrations of GPER agonist G-1 before ISO addition (arrows). D, Average integrated AUC values. ****, p <0.0001; n = 12 – 22 cells from 9 – 16 experiments for each condition.
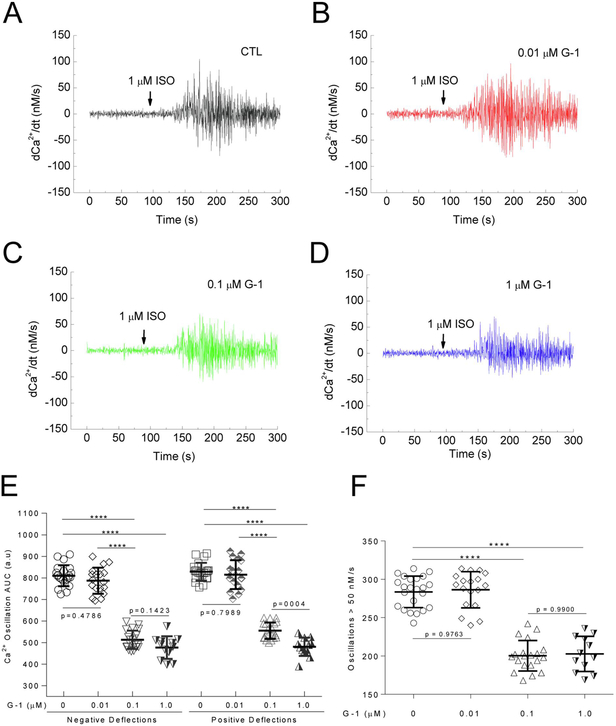
The time courses of the Ca2+ signals induced by ISO in cells treated with of G-1 display apparent decreases in the Ca2+ oscillations. To assess this effect in detail, we obtained the first derivative of Ca2+ values (dCa2+/dt) in the entire time courses of the Ca2+ signals. dCa2+/dt tracing represents positive and negative deflections of the Ca2+ signals, and these alterations, when sufficiently large, are predicted to contribute to changes in contraction. Pretreatment of PMCMs with G-1 appears to produce a dose-dependent suppression of dCa2+/dt values (Fig. 5A-D). To compare these changes, AUC values were obtained for both the positive and negative deflections of all dCa2+/dt time courses, which clearly demonstrates dose-dependent inhibition of ISO-induced Ca2+ oscillations in PMCMs (Fig. 5E). To assess the effects of G-1 on the frequency of Ca2+ oscillations, absolute dCa2+/dt values greater than 50 nM/s were counted and compared among doses of G-1, as significant Ca2+-troponin T binding begins at 50 nM Ca2+ and is predicted to trigger myocardial contraction.[30] This revealed that G-1 reduced the frequency of ISO-induced Ca2+ oscillations exceeding 50 nM/s (Fig. 5F).
Figure 5.
Effect of GPER activation on ISO-induced Ca2+ oscillations. Cardiomyocytes were pre-treated with the specified doses of GPER agonist G-1 before the addition of ISO (arrows). A–D, First derivatives of the averaged Ca2+ signals (dCa2+/dt). E, Average integrated AUC values for upward and downward deflections in Ca2+ from A – D. E, Average AUC values. F, Average number of Ca2+ oscillations > 50 nM/s after addition of ISO. n = 12 – 22 cells from 9 – 16 experiments for each condition; ****, p < 0.0001.
3.4. Effects of GPER inhibition on ISO-induced Ca2+ signals in PMCMs.
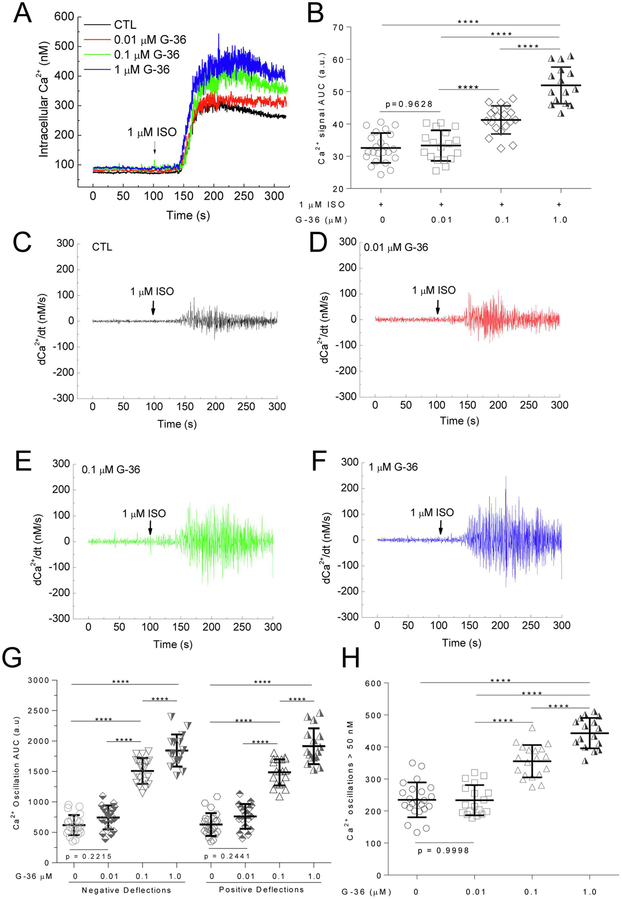
The G-1 data suggest involvement of GPER in β1AR-mediated signaling in PMCMs. We reasoned that if GPER activity is constitutively involved in β1AR-mediated signaling, then its inhibition should affect ISO-induced Ca2+ signals. PMCMs were pretreated with various doses of the specific GPER antagonist G-36 (Ki = 112 nM,[31]) for 15 minutes before ISO addition. G-36 pretreatment increased the total Ca2+ signal induced by 1 μM ISO in PMCMs (Fig. 6A). AUC analysis clearly showed significant dose-dependent stimulatory effects of G-36 on β1AR-mediated total Ca2+ signal (Fig. 6B). To assess the effects of GPER inhibition on the Ca2+ oscillations, similar procedures as in Fig. 5 were performed. The data showed a clear dose-dependent increases in the amplitude of the ISO-induced Ca2+ oscillations (Fig. 6C-F). Integration AUC analyses of both the positive and negative deflections of the oscillations showed clear dose-dependent stimulatory effects (Fig. 6G). Similarly, the frequency of Ca2+ oscillations with speed > 50 nM/s was also increased dose-dependently by G-36 treatment (Fig. 6F).
Figure 6.
Effect of GPER antagonist G-36 on ISO-induced Ca2+ signals. A-B, Intracellular Ca2+ (A) and corresponding average integrated AUC values (B) in response to 1 μM ISO in cardiomyocytes pretreated for 15 min with the specified concentrations of G36 before ISO addition (arrows). C – F, First derivatives of the averaged Ca2+ signals (dCa2+/dt) in cells pretreated with the specified concentrations of G-36 before addition of ISO (arrows). G, Average integrated AUC values for upward and downward deflections in Ca2+ from C – F. H, Average numbers of Ca2+ oscillations > 50 nM/s after addition of ISO. n = 16 – 23 cells from 10 – 23 experiments for each condition; ****, p < 0.0001.
3.5. Effects of GPER activity on ISO-induced phosphorylation of Cav1.2.
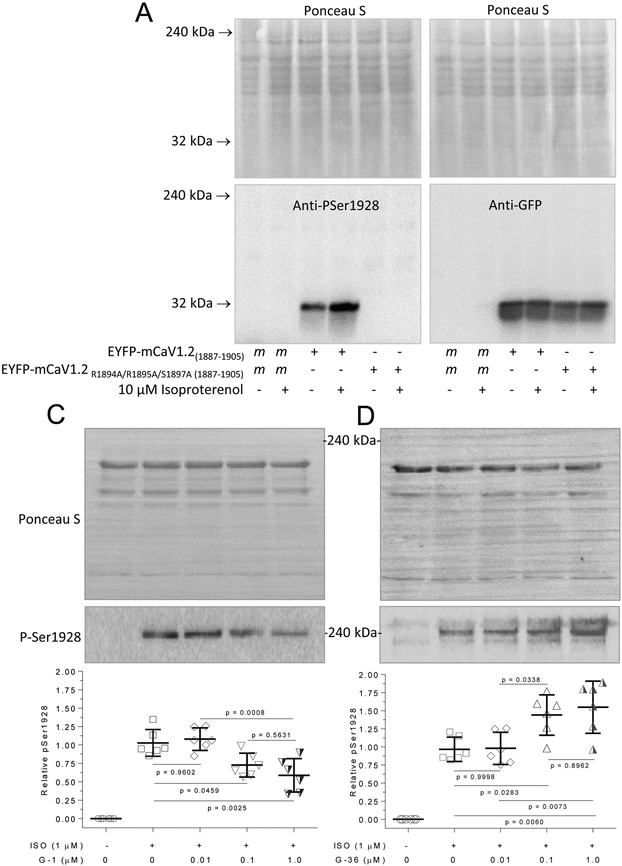
The results so far indicate a possibility that GPER activity is an intrinsic component in β1AR-mediated signaling in cardiomyocytes, with GPER agonism and antagonism exerting opposing effects on ISO-induced Ca2+ signals. A key signaling event following activation of β1AR is the activation of protein kinase A (PKA). We tested the idea that changes in ISO-stimulated Ca2+ signals caused by alterations in GPER activity were associated with changes in PKA-dependent phosphorylation of L-type Ca2+ channels in cardiomyocytes. Ser1928 on Cav1.2 is robustly phosphorylated by PKA [4, 32]. To assess phosphorylation at this site, we utilized an anti-phosphoSer1928 Cav1.2 polyclonal antibody (Cat. # PA5-64748, ThermoFisher Scientific, Waltham, MA). According to the manufacturer, this antibody was purified by affinity chromatography using the phosphopeptide LRSASLGRRApSFHLECLKR: non-phospho specific antibodies were removed by chromatography using non-phosphorylated peptide; and manufacturer’s specificity studies included phosphopeptide competition, which completely inhibited antibody binding in Western blot analysis while the non-phosphorylated peptide had no effect on antibody binding. To further verify this antibody, we generated fusions between enhanced yellow fluorescent protein (EYFP) and the murine sequence fragment that corresponds to its epitope (a.a. 1887-1905) with wild-type sequence or one in which R1894, R1895 and S1897 have been substituted with a non-phosphorylatable alanine residue. A common phosphorylation motif for protein kinase A is RR-X-S/T [33], in which the arginine residues are important for guiding the kinase towards the phosphorylatable serine/threonine. This motif is present in the Cav1.2 phospho antibody epitope, in which S1897 represents the phosphorylatable serine that corresponds with S1928 in the human sequence. In mock-transfected human embryonic kidney (HEK) 293 cells, treatment with 10 μM isoproterenol did not promote any signal recognized by this antibody. In cells overexpressing the EYFP-Cav1.2(1887-1905) fusion, we detected basal signal at ~30 kDa, corresponding to the size of the fusions expressed, which was enhanced by treatment with 10 μM ISO (Fig. 7A, left lower panel). However, in cells overexpressing the fusion with the R1894A/R1895A/S1897A substitutions, there were no detectible signals in basal condition or following treatment with 10 μM ISO (Fig. 7A, left lower panel). Probing of the same samples with an anti-GFP antibody (Cat#ab6673, Abcam, Cambridge, MA) showed equal expression of the fusions (Fig. 7A, right lower panel); Ponceau S staining of the membrane demonstrated equal loading across conditions (Fig. 7A, upper panels). Additionally, pilot studies indicated that 10 μM ISO triggers Ca2+ signals in HEK293 cells, suggesting the presence of functional of β-ARs in these cells (data not shown). Using this anti-phospho Ser1928 Cav1.2 antibody, in basal conditions, we observed no detectible phosphorylation at Ser1928 in PMCMs. Treatment with 1 μM ISO induced robust phosphorylation here. Pretreatment for 15 minutes with increasing doses of G-1 before ISO application dose-dependently suppressed this increase (Fig. 7B). In turn, pretreatment with G-36 dose-dependently enhanced ISO-induced phosphorylation at Ser1928 (Fig. 7C).
Figure 7.
Effects of G-1 and G-36 on ISO-stimulated phosphorylation of Cav1.2. A and B, Verification of anti-phospho Ser1928 antibody. HEK293 cells were transfected with mock conditions or plasmids encoding EYFP-CaV1.2(1887-1905) with wild-type or R1894A/R1895A/S1897A substitutions as indicated. Cells were treated for 10 min with or without 10 μM ISO as specified in medium containing 1.5 mM CaCl2, followed by lysis. Upper panels, Ponceau-S stains. Lower panels, corresponding immunoblots using the anti-phospho Ser1928 antibody (PA5-64748, left) or anti-GFP antibody (ab6673, right). Freshly isolated cardiomyocytes were pre-treated with the specified doses of G-1 (B) or G-36 (C) for 15 minutes followed by 1 μM ISO treatment for 10 minutes, lysis, and immunoblotting. Following SDS-PAGE, membranes were stained with Ponceau-S followed by washing and probing with anti-PSer1928 Cav1.2 antibody (upper blots). Histograms, relative densitometric values of P-Ser1928/total protein loading. ****, p < 0.0001 vs control; n = 6 for each condition.
Discussion
17β-estradiol has been shown to produce negative inotropic and chronotropic effects in isolated hearts unstimulated or stimulated with ISO [34, 35]. However, the roles of specific estrogen receptors in myocardial contraction stimulated by β adrenoceptor activity are unclear. In this work, we provide evidence from several experimental paradigms that GPER activity is intrinsically involved in β1AR-mediated signaling and contraction of the myocardium. First, we show that GPER activation blocks ISO-induced increases in myocardial contraction and ectopic contractions in live animals, prevents ISO-induced potentiation of electrically evoked LTCC activities, and reduces β1AR-stimulated Ca2+ signals and phosphorylation of Cav1.2 in freshly isolated cardiomyocytes. Our observations that G-1 quickly restores ISO-induced increases in LVP, heart rate and ectopic contractions to baseline levels provide the first evidence that GPER activation can quickly reverse cardiac β adrenergic response. This is supported by earlier observations that E2-induced inhibition of contraction in ISO-stimulated heart is not inhibited by tamoxifen [35], an ERα/ERβ antagonist that is now known to be a GPER agonist [36].
Effects of E2 on LTCC activities have been well studied due to the important role of these channels in myocardial contraction. Overall, there is consensus that estrogens inhibit ICa,L. Indeed, E2 reduces peak inward Ca2+ current and delays channel recovery from inactivation [37]; the phytoestrogen resveratrol inhibits electrically stimulated Ca2+ transients and cell shortening [38]; and electrically simulated Ca2+ transients are larger in cardiomyocytes from ovariectomized mice compared to those from sham female mice [39]. Nevertheless, identity of the specific estrogen receptor responsible for these effects has been elusive. Our results that GPER activation inhibits βAR-mediated potentiation of ICa,L and channel inactivation indicate that GPER mediates the previously observed effects of E2 on LTCC activities. This conclusion is further supported by observations that genetic deletion of ERα and ERβ does not affect the inhibitory effect of E2 on ICa,L and that there is no difference in steady-state inactivation curves between WT, ERα−/− and ERβ−/− ventricular cardiomyocytes [11].
Our data further implicate GPER as an intrinsic component of β1AR signaling in cardiomyocytes, acting as a clamp of β1AR-mediated PKA activity. Several lines of evidence support this conclusion. First, GPER agonism suppresses ISO-stimulated total Ca2+ signal, Ca2+ oscillation amplitude and frequency, while GPER antagonism exert opposite effects, enhancing all these signals. The Ca2+ signal produced by ISO without electrical activation provides a direct parameter for β adrenoceptor activity. Our data show that this signal is associated mainly with activation of β1AR, as evidenced by its complete inhibition by antagonism of β1AR but not β2AR. While identification of the Ca2+ channels responsible for this signal was not the focus of our study, previous works indicate that TRP channels might be components, some of which are regulated by PKA [40-42]. Regardless, the opposing effects of GPER agonism and antagonism on ISO-induced Ca2+ signal indicate that GPER activity is intrinsically involved in β1AR-mediated regulation of myocardial Ca2+ dynamics. Our data also indicate that alterations in PKA activity are associated with these effects, as evidenced by opposing effects of GPER agonism and antagonism on ISO-induced PKA-dependent phosphorylation at Ser1928 of Cav1.2. Mechanistically, two possibilities may explain the intrinsic involvement GPER in β1AR-stimulated PKA activity. First, GPER may physically interact with β1AR and regulate its activity at the receptor level. Consistent with this idea, both receptors possess C-terminal type-I PDZ-binding domains and interact with PDZ proteins such as PSD95 and SAP97 [24, 43-45]. GPER interacts via this domain with the plasma membrane Ca2+-ATPase4b, an association that inhibits the activity of PMCA4b while promotes that of GPER [24]. Second, GPER may directly regulate PKA activity. This is supported by previous reports that GPER’s interactions with membrane-associated guanylate kinases and protein kinase A-anchoring protein 5 inhibit cAMP signaling [46].
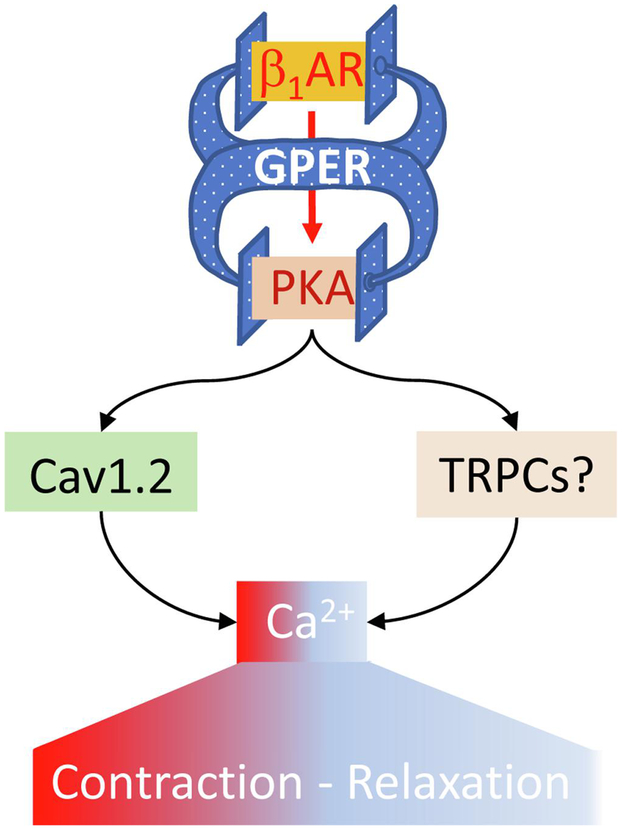
Based on our data with multiple paradigms and existing evidence, we propose that GPER functions as an intrinsic component that clamps β1AR-mediated signaling, thereby regulating myocardial Ca2+ machinery and contraction (Fig. 8). In this model, activation of β1AR is proposed to be associated with activity of GPER, so that GPER antagonism potentiates β1AR-mediated effects while GPER activation does the opposite. As such, GPER could be considered a “self-control” mechanism for adrenergic activities in the heart. The evidence for this model is pharmacological at this stage. We currently do not know for certain the mechanisms whereby activation of β1AR is associated with GPER activity. Further detailed studies with molecular, cellular and animal models will answer this question.
Figure 8.
Proposed role of GPER as an intrinsic component of β1AR signaling in the myocardium. See text for details.
Acknowledgments:
This study was supported by the National Institutes of Health (grant R15HL112184 to Q-KT); American Heart Association (grant 15SDG25090279 to EW); Des Moines University start-ups (to DC and SC); and Iowa Osteopathic Education and Research Funds (grant IOER091707 to Q-KT).
Footnotes
Disclosures: None declared.
Publisher's Disclaimer: This is a PDF file of an unedited manuscript that has been accepted for publication. As a service to our customers we are providing this early version of the manuscript. The manuscript will undergo copyediting, typesetting, and review of the resulting proof before it is published in its final form. Please note that during the production process errors may be discovered which could affect the content, and all legal disclaimers that apply to the journal pertain.
References
- [1].Florea VG, Cohn JN, The autonomic nervous system and heart failure, Circ Res 114(11) (2014) 1815–26. [DOI] [PubMed] [Google Scholar]
- [2].Bers DM, Cardiac excitation-contraction coupling, Nature 415(6868) (2002) 198–205. [DOI] [PubMed] [Google Scholar]
- [3].Ginsburg KS, Bers DM, Modulation of excitation-contraction coupling by isoproterenol in cardiomyocytes with controlled SR Ca2+ load and Ca2+ current trigger, J Physiol 556(Pt 2) (2004) 463–80. [DOI] [PMC free article] [PubMed] [Google Scholar]
- [4].Gao T, Yatani A, Dell'Acqua ML, Sako H, Green SA, Dascal N, Scott JD, Hosey MM, cAMP-dependent regulation of cardiac L-type Ca2+ channels requires membrane targeting of PKA and phosphorylation of channel subunits, Neuron 19(1) (1997) 185–96. [DOI] [PubMed] [Google Scholar]
- [5].Nystoriak MA, Nieves-Cintron M, Patriarchi T, Buonarati OR, Prada MP, Morotti S, Grandi E, Fernandes JD, Forbush K, Hofmann F, Sasse KC, Scott JD, Ward SM, Hell JW, Navedo MF, Ser1928 phosphorylation by PKA stimulates the L-type Ca2+ channel CaV1.2 and vasoconstriction during acute hyperglycemia and diabetes, Science signaling 10(463) (2017). [DOI] [PMC free article] [PubMed] [Google Scholar]
- [6].Stampfer MJ, Colditz GA, Estrogen replacement therapy and coronary heart disease: a quantitative assessment of the epidemiologic evidence, Preventive medicine 20(1) (1991) 47–63. [DOI] [PubMed] [Google Scholar]
- [7].Grady D, Rubin SM, Petitti DB, Fox CS, Black D, Ettinger B, Ernster VL, Cummings SR, Hormone therapy to prevent disease and prolong life in postmenopausal women, Annals of internal medicine 117(12) (1992) 1016–37. [DOI] [PubMed] [Google Scholar]
- [8].Forster C, Kietz S, Hultenby K, Warner M, Gustafsson JA, Characterization of the ERbeta−/−mouse heart, Proc Natl Acad Sci U S A 101(39) (2004) 14234–9. [DOI] [PMC free article] [PubMed] [Google Scholar]
- [9].Zhai P, Eurell TE, Cooke PS, Lubahn DB, Gross DR, Myocardial ischemia-reperfusion injury in estrogen receptor-alpha knockout and wild-type mice, Am J Physiol Heart Circ Physiol 278(5) (2000) H1640–7. [DOI] [PubMed] [Google Scholar]
- [10].Pugach EK, Blenck CL, Dragavon JM, Langer SJ, Leinwand LA, Estrogen receptor profiling and activity in cardiac myocytes, Molecular and cellular endocrinology 431 (2016) 62–70. [DOI] [PMC free article] [PubMed] [Google Scholar]
- [11].Ullrich ND, Krust A, Collins P, MacLeod KT, Genomic deletion of estrogen receptors ERalpha and ERbeta does not alter estrogen-mediated inhibition of Ca2+ influx and contraction in murine cardiomyocytes, Am J Physiol Heart Circ Physiol 294(6) (2008) H2421–7. [DOI] [PubMed] [Google Scholar]
- [12].Filardo EJ, Quinn JA, Bland KI, Frackelton AR Jr., Estrogen-induced activation of Erk-1 and Erk-2 requires the G protein-coupled receptor homolog, GPR30, and occurs via trans-activation of the epidermal growth factor receptor through release of HB-EGF, Mol Endocrinol 14(10) (2000) 1649–60. [DOI] [PubMed] [Google Scholar]
- [13].Revankar CM, Cimino DF, Sklar LA, Arterburn JB, Prossnitz ER, A transmembrane intracellular estrogen receptor mediates rapid cell signaling, Science 307(5715) (2005) 1625–30. [DOI] [PubMed] [Google Scholar]
- [14].Wang H, Sun X, Chou J, Lin M, Ferrario CM, Zapata-Sudo G, Groban L, Inflammatory and mitochondrial gene expression data in GPER-deficient cardiomyocytes from male and female mice, Data in brief 10 (2017) 465–473. [DOI] [PMC free article] [PubMed] [Google Scholar]
- [15].Meyer MR, Barton M, Estrogens and Coronary Artery Disease: New Clinical Perspectives, Adv Pharmacol 77 (2016) 307–60. [DOI] [PubMed] [Google Scholar]
- [16].Delbeck M, Golz S, Vonk R, Janssen W, Hucho T, Isensee J, Schafer S, Otto C, Impaired left-ventricular cardiac function in male GPR30-deficient mice, Mol Med Rep 4(1) (2011) 37–40. [DOI] [PubMed] [Google Scholar]
- [17].Wang H, Sun X, Chou J, Lin M, Ferrario CM, Zapata-Sudo G, Groban L, Cardiomyocyte-specific deletion of the G protein-coupled estrogen receptor (GPER) leads to left ventricular dysfunction and adverse remodeling: A sex-specific gene profiling analysis, Biochim Biophys Acta 1863(8) (2017) 1870–1882. [DOI] [PMC free article] [PubMed] [Google Scholar]
- [18].Tran QK, Firkins R, Giles J, Francis S, Matnishian V, Tran P, VerMeer M, Jasurda J, Burgard MA, Gebert-Oberle B, Estrogen Enhances Linkage in the Vascular Endothelial Calmodulin Network via a Feedforward Mechanism at the G Protein-Coupled Estrogen Receptor 1, J Biol Chem 291(20) (2016) 10805–23. [DOI] [PMC free article] [PubMed] [Google Scholar]
- [19].Terry LE, VerMeer M, Giles J, Tran QK, Suppression of store-operated Ca2+ entry by activation of GPER: contribution to a clamping effect on endothelial Ca2+ signaling, Biochem J (2017). [DOI] [PubMed] [Google Scholar]
- [20].Fredette NC, Meyer MR, Prossnitz ER, Role of GPER in estrogen-dependent nitric oxide formation and vasodilation, The Journal of steroid biochemistry and molecular biology (2017). [DOI] [PMC free article] [PubMed] [Google Scholar]
- [21].Meyer MR, Fredette NC, Howard TA, Hu C, Ramesh C, Daniel C, Amann K, Arterburn JB, Barton M, Prossnitz ER, G protein-coupled estrogen receptor protects from atherosclerosis, Scientific reports 4 (2014) 7564. [DOI] [PMC free article] [PubMed] [Google Scholar]
- [22].Ackers-Johnson M, Li PY, Holmes AP, O'Brien SM, Pavlovic D, Foo RS, A Simplified, Langendorff-Free Method for Concomitant Isolation of Viable Cardiac Myocytes and Nonmyocytes From the Adult Mouse Heart, Circ Res 119(8) (2016) 909–20. [DOI] [PMC free article] [PubMed] [Google Scholar]
- [23].Wu J, Wang X, Chung YY, Koh CH, Liu Z, Guo H, Yuan Q, Wang C, Su S, Wei H, L-Type Calcium Channel Inhibition Contributes to the Proarrhythmic Effects of Aconitine in Human Cardiomyocytes, PloS one 12(1) (2017) e0168435. [DOI] [PMC free article] [PubMed] [Google Scholar]
- [24].Tran QK, VerMeer M, Burgard MA, Hassan AB, Giles J, Hetero-oligomeric Complex between the G Protein-coupled Estrogen Receptor 1 and the Plasma Membrane Ca2+-ATPase 4b, J Biol Chem 290(21) (2015) 13293–307. [DOI] [PMC free article] [PubMed] [Google Scholar]
- [25].Ehlers K, Clements R, VerMeer M, Giles J, Tran QK, Novel regulations of the angiotensin II receptor type 1 by calmodulin, Biochem Pharmacol 152 (2018) 187–200. [DOI] [PMC free article] [PubMed] [Google Scholar]
- [26].Hutson DD, Gurrala R, Ogola BO, Zimmerman MA, Mostany R, Satou R, Lindsey SH, Estrogen receptor profiles across tissues from male and female Rattus norvegicus, Biol Sex Differ 10(1) (2019) 4. [DOI] [PMC free article] [PubMed] [Google Scholar]
- [27].Arefin S, Simoncini T, Wieland R, Hammarqvist F, Spina S, Goglia L, Kublickiene K, Vasodilatory effects of the selective GPER agonist G-1 is maximal in arteries of postmenopausal women, Maturitas 78(2) (2014) 123–30. [DOI] [PubMed] [Google Scholar]
- [28].Bologa CG, Revankar CM, Young SM, Edwards BS, Arterburn JB, Kiselyov AS, Parker MA, Tkachenko SE, Savchuck NP, Sklar LA, Oprea TI, Prossnitz ER, Virtual and biomolecular screening converge on a selective agonist for GPR30, Nature chemical biology 2(4) (2006) 207–12. [DOI] [PubMed] [Google Scholar]
- [29].Hoffmann C, Leitz MR, Oberdorf-Maass S, Lohse MJ, Klotz KN, Comparative pharmacology of human beta-adrenergic receptor subtypes--characterization of stably transfected receptors in CHO cells, Naunyn Schmiedebergs Arch Pharmacol 369(2) (2004) 151–9. [DOI] [PubMed] [Google Scholar]
- [30].Robinson P, Griffiths PJ, Watkins H, Redwood CS, Dilated and hypertrophic cardiomyopathy mutations in troponin and alpha-tropomyosin have opposing effects on the calcium affinity of cardiac thin filaments, Circ Res 101(12) (2007) 1266–73. [DOI] [PubMed] [Google Scholar]
- [31].Dennis MK, Field AS, Burai R, Ramesh C, Petrie WK, Bologa CG, Oprea TI, Yamaguchi Y, Hayashi S, Sklar LA, Hathaway HJ, Arterburn JB, Prossnitz ER, Identification of a GPER/GPR30 antagonist with improved estrogen receptor counterselectivity, The Journal of steroid biochemistry and molecular biology 127(3-5) (2011) 358–66. [DOI] [PMC free article] [PubMed] [Google Scholar]
- [32].Hall DD, Feekes JA, Arachchige Don AS, Shi M, Hamid J, Chen L, Strack S, Zamponi GW, Horne MC, Hell JW, Binding of protein phosphatase 2A to the L-type calcium channel Cav1.2 next to Ser1928, its main PKA site, is critical for Ser1928 dephosphorylation, Biochemistry 45(10) (2006) 3448–59. [DOI] [PubMed] [Google Scholar]
- [33].Smith FD, Samelson BK, Scott JD, Discovery of cellular substrates for protein kinase A using a peptide array screening protocol, Biochem J 438(1) (2011) 103–10. [DOI] [PMC free article] [PubMed] [Google Scholar]
- [34].Raddino R, Manca C, Poli E, Bolognesi R, Visioli O, Effects of 17 beta-estradiol on the isolated rabbit heart, Archives internationales de pharmacodynamie et de therapie 281(1) (1986) 57–65. [PubMed] [Google Scholar]
- [35].Li HY, Bian JS, Kwan YW, Wong TM, Enhanced responses to 17beta-estradiol in rat hearts treated with isoproterenol: involvement of a cyclic AMP-dependent pathway, J Pharmacol Exp Ther 293(2) (2000) 592–8. [PubMed] [Google Scholar]
- [36].Petrie WK, Dennis MK, Hu C, Dai D, Arterburn JB, Smith HO, Hathaway HJ, Prossnitz ER, G protein-coupled estrogen receptor-selective ligands modulate endometrial tumor growth, Obstetrics and gynecology international 2013 (2013) 472720. [DOI] [PMC free article] [PubMed] [Google Scholar]
- [37].Jiang C, Poole-Wilson PA, Sarrel PM, Mochizuki S, Collins P, MacLeod KT, Effect of 17 beta-oestradiol on contraction, Ca2+ current and intracellular free Ca2+ in guinea-pig isolated cardiac myocytes, Br J Pharmacol 106(3) (1992) 739–45. [DOI] [PMC free article] [PubMed] [Google Scholar]
- [38].Liew R, Stagg MA, MacLeod KT, Collins P, The red wine polyphenol, resveratrol, exerts acute direct actions on guinea-pig ventricular myocytes, Eur J Pharmacol 519(1-2) (2005) 1–8. [DOI] [PubMed] [Google Scholar]
- [39].Parks RJ, Bogachev O, Mackasey M, Ray G, Rose RA, Howlett SE, The impact of ovariectomy on cardiac excitation-contraction coupling is mediated through cAMP/PKA-dependent mechanisms, J Mol Cell Cardiol 111 (2017) 51–60. [DOI] [PubMed] [Google Scholar]
- [40].Mathar I, Kecskes M, Van der Mieren G, Jacobs G, Camacho Londono JE, Uhl S, Flockerzi V, Voets T, Freichel M, Nilius B, Herijgers P, Vennekens R, Increased beta-adrenergic inotropy in ventricular myocardium from Trpm4−/− mice, Circ Res 114(2) (2014) 283–94. [DOI] [PubMed] [Google Scholar]
- [41].Hong C, Kim J, Jeon JP, Wie J, Kwak M, Ha K, Kim H, Myeong J, Kim SY, Jeon JH, So I, Gs cascade regulates canonical transient receptor potential 5 (TRPC5) through cAMP mediated intracellular Ca2+ release and ion channel trafficking, Biochem Biophys Res Commun 421(1) (2012) 105–11. [DOI] [PubMed] [Google Scholar]
- [42].Horinouchi T, Higa T, Aoyagi H, Nishiya T, Terada K, Miwa S, Adenylate cyclase/cAMP/protein kinase A signaling pathway inhibits endothelin type A receptor-operated Ca(2)(+) entry mediated via transient receptor potential canonical 6 channels, J Pharmacol Exp Ther 340(1) (2012) 143–51. [DOI] [PubMed] [Google Scholar]
- [43].Akama KT, Thompson LI, Milner TA, McEwen BS, Post-synaptic density-95 (PSD-95) binding capacity of G-protein-coupled receptor 30 (GPR30), an estrogen receptor that can be identified in hippocampal dendritic spines, J Biol Chem 288(9) (2013) 6438–50. [DOI] [PMC free article] [PubMed] [Google Scholar]
- [44].Waters EM, Thompson LI, Patel P, Gonzales AD, Ye HZ, Filardo EJ, Clegg DJ, Gorecka J, Akama KT, McEwen BS, Milner TA, G-protein-coupled estrogen receptor 1 is anatomically positioned to modulate synaptic plasticity in the mouse hippocampus, J Neurosci 35(6) (2015) 2384–97. [DOI] [PMC free article] [PubMed] [Google Scholar]
- [45].Nooh MM, Chumpia MM, Hamilton TB, Bahouth SW, Sorting of beta1-adrenergic receptors is mediated by pathways that are either dependent on or independent of type I PDZ, protein kinase A (PKA), and SAP97, J Biol Chem 289(4) (2014) 2277–94. [DOI] [PMC free article] [PubMed] [Google Scholar]
- [46].Broselid S, Berg KA, Chavera TA, Kahn R, Clarke WP, Olde B, Leeb-Lundberg LM, G Protein-coupled Receptor 30 (GPR30) Forms a Plasma Membrane Complex With Membrane-associated Guanylate Kinases (MAGUKs) and AKAP5 That Constitutively Inhibits cAMP Production, J Biol Chem (2014). [DOI] [PMC free article] [PubMed] [Google Scholar]


