PLOS ONE logoLink to PLOS ONE
. 2020 Jan 9;15(1):e0227636. doi: 10.1371/journal.pone.0227636

Diagnostic performance of serum interferon gamma, matrix metalloproteinases, and periostin measurements for pulmonary tuberculosis in Japanese patients with pneumonia

Momoko Yamauchi 1, Takeshi Kinjo 1,*, Gretchen Parrott 1, Kazuya Miyagi 1, Shusaku Haranaga 1,2, Yuko Nakayama 3, Kenji Chibana 3, Kaori Fujita 3, Atsushi Nakamoto 3, Futoshi Higa 3, Isoko Owan 3, Koji Yonemoto 4,5, Jiro Fujita 1
Editor: Frederick Quinn6
PMCID: PMC6952104  PMID: 31917802

Abstract

Serum markers that differentiate between tuberculous and non-tuberculous pneumonia would be clinically useful. However, few serum markers have been investigated for their association with either disease. In this study, serum levels of interferon gamma (IFN-γ), matrix metalloproteinases 1 and 9 (MMP-1 and MMP-9, respectively), and periostin were compared between 40 pulmonary tuberculosis (PTB) and 28 non-tuberculous pneumonia (non-PTB) patients. Diagnostic performance was assessed by analysis of receiver-operating characteristic (ROC) curves and classification trees. Serum IFN-γ and MMP-1 levels were significantly higher and serum MMP-9 levels significantly lower in PTB than in non-PTB patients (p < 0.001, p = 0.002, p < 0.001, respectively). No significant difference was observed in serum periostin levels between groups. ROC curve analysis could not determine the appropriate cut-off value with high sensitivity and specificity; therefore, a classification tree method was applied. This method identified patients with limited infiltration into three groups with statistical significance (p = 0.01), and those with MMP-1 levels < 0.01 ng/mL and periostin levels ≥ 118.8 ng/mL included only non-PTB patients (95% confidence interval 0.0–41.0). Patients with extensive infiltration were also divided into three groups with statistical significance (p < 0.001), and those with MMP-9 levels < 3.009 ng/mL included only PTB patients (95% confidence interval 76.8–100.0). In conclusion, the novel classification tree developed using MMP-1, MMP-9, and periostin data distinguished PTB from non-PTB patients. Further studies are needed to validate our cut-off values and the overall clinical usefulness of these markers.

Introduction

Tuberculosis (TB) remains a leading cause of death, even in the era of established anti-TB treatment. Africa and South-East Asia account for 85% of TB deaths globally [1], and South-East Asia is estimated to bear one-third of the global TB burden [1]. A recent systematic review [2] found that more than 10% of cases of community-acquired pneumonia in Asia was caused by Mycobacterium tuberculosis. Prompt diagnosis of pulmonary tuberculosis (PTB) as the cause of pneumonia may be delayed because the early clinical presentations of PTB and non-tuberculous pneumonia (non-PTB) are often indistinguishable [3, 4].

Nucleic acid amplification is widely used to diagnose PTB but is not practical in patients with inadequate sputum quality and those who cannot expectorate. The interferon gamma (IFN-γ) release assay is also used to diagnose TB but has drawbacks, including the time required for a patient’s lymphocytes to release IFN-γ against TB antigens in vitro and inability to differentiate active from latent TB infection (LTBI). Routine blood tests performed in patients with pneumonia could be helpful if a diagnostic marker in serum that distinguishes PTB from non-PTB is found.

IFN-γ is a type 2 interferon that plays a critical role in the immune response to TB infection by activating macrophages and other immune cells [5, 6]. Furthermore, some matrix metalloproteinases (MMPs) are responsible for turnover, degradation, and catabolism of the extracellular matrix [7, 8]. MMP-1 and MMP-9 are reportedly associated with formation and cavitation of TB granuloma [9, 10]. Although IFN-γ, MMP-1, and MMP-9 levels in blood collected from patients with PTB have been demonstrated to be elevated [1113], most studies have compared patients with PTB against healthy subjects or patients with LTBI. From the perspective of clinical practice, it is important to investigate serum markers that can differentiate PTB from non-PTB, not from healthy subjects or LTBI patients.

Koguchi et al. reported that osteopontin, a matricellular protein, was elevated in patients with PTB [14]. Periostin, a similar matricellular protein, was shown to be a biomarker of chronic inflammation and fibrosis via its association with type 2 helper T-cell reactions in asthma and idiopathic pulmonary fibrosis [1517]. Periostin is produced by fibroblasts and alveolar epithelial cells, and fibroblasts are known to have a role in formation of TB granuloma [18, 19]; therefore, periostin may also be elevated in patients with PTB. However, thus far, no studies have measured any of the aforementioned serum marker levels to discriminate between PTB and non-PTB.

The aims of this study were to investigate serum IFN-γ, MMP-1, MMP-9, and periostin levels in patients with PTB and those with non-PTB and to assess their value as diagnostic markers.

Materials and methods

Patients

Patients admitted to the University of the Ryukyus Hospital or the National Hospital Organization Okinawa Hospital between January 2012 and December 2016 with a diagnosis of PTB or non-PTB in whom blood samples were collected before treatment were eligible for enrolment in the study. PTB was confirmed by a positive M. tuberculosis polymerase chain reaction test. The data collected included age, sex, underlying diseases, identification of causative bacteria, radiological findings, and serum IFN-γ, MMP-1, MMP-9, and periostin measurements. Serum samples collected between January 2012 and December 2016 were stored at -80°C until testing (between November 2016 and January 2018). The authors of the study had direct access to anonymized patient information. Patients were given the opportunity for opt-out via websites of both the Department of Infectious, Respiratory, and Digestive Medicine, Graduate School of Medicine, University of the Ryukyus, and the National Hospital Organization Okinawa Hospital. Patients who wished not to participate in this study could be excluded via posted phone number on these websites. This study was approved by the Institutional Ethics Committees of both the University of the Ryukyus (approval number 1128) and the National Hospital Organization Okinawa Hospital (approval number 27–31).

Radiographic assessment

Chest radiographs acquired at admission were scored from 0 to 10 based on the extent of infiltration as in previous reports [20, 21]. Scores of 0–4 indicated limited infiltration (in less than one-third of one lung; approximately 50% of patients) and scores of 5–10 indicated extensive infiltration (in one-third or more of one lung; approximately 50%).

Assays

Serum IFN-γ levels were measured using the BD Cytometric Bead Array Human Th1/Th2/Th17 cytokine kit (Becton, Dickinson and Company, Franklin Lakes, NJ) via the BD Accuri C6 flow cytometer with a sequential multi-channel analyzer (Becton Dickinson). Serum periostin was measured using an enzyme-linked immunoassay kit (Phoenix Pharmaceuticals, Burlingame, CA). MMP-1 was measured using the Fluorokine E kit (R&D Systems, Minneapolis, MN) and MMP-9 using the Quantikine enzyme-linked immunoassay kit (R&D Systems). All assays were performed according to the manufacturers’ instructions.

Statistical analysis

The data for PTB and non-PTB patients are shown as the median (range) or number (percentage). The Wilcoxon rank-sum test was used to compare the continuous variables and the Pearson’s chi-square or Fisher’s exact test to compare the nominal variables.

Receiver-operating characteristic (ROC) curves were used to evaluate the diagnostic performance of each biomarker and to determine the specificity corresponding to high sensitivity (90%). A classification tree was also used. This method allows subjects to be sub-grouped by specific levels of explanatory variables and is developed by selecting explanatory variables with the smallest error classification rate of qualitative objective variables within groups [22]. In this study, the patients with extensive or limited infiltration were subgrouped using the classification tree with diagnosis (PTB or non-PTB) as the objective variable and IFN-γ, MMP-1, MMP-9, and periostin as the explanatory variables. The 95% confidence interval (CI) for prevalence of PTB in each subgroup was calculated using the Clopper-Pearson method. All statistical analyses were performed using JMP version 14 (SAS Institute Inc., Cary, NC). A two-sided p-value < 0.05 was considered statistically significant.

Results

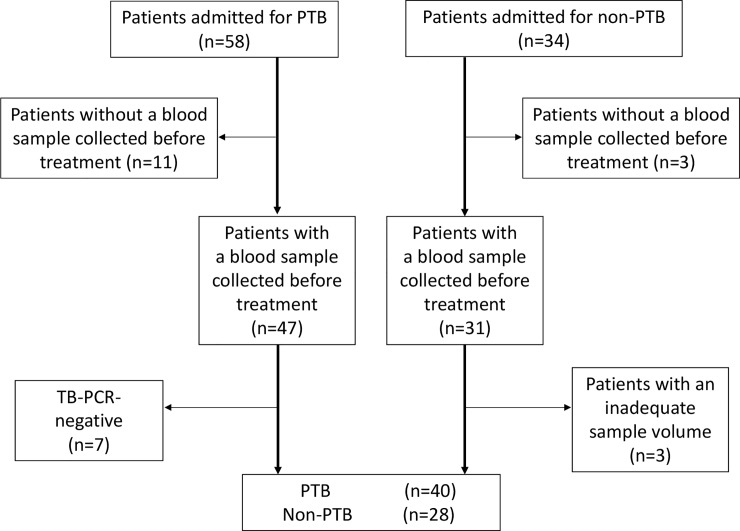
Fifty-eight of 92 patients with pneumonia had a diagnosis of PTB and 34 did not. Eighteen patients in the PTB group were excluded because of a negative TB-polymerase chain reaction result (n = 7) or having no pre-treatment blood sample (n = 11) and 6 in the non-PTB group were excluded for having no pre-treatment blood sample available (n = 3) or an inadequate sample volume (n = 3). After these exclusions, 40 patients were enrolled in the PTB group and 28 in the non-PTB group (Fig 1). The demographics, underlying diseases, and radiographic findings of pneumonia in the study groups are summarized in Table 1. The median age was 78 (range 46–100) years in the PTB group and 74 (range 55–91) years in the non-PTB group. There were no significant between-group differences in sex distribution or the frequency of underlying diseases. Bilateral lesions were present in 65.0% of patients in the PTB group and 57.1% of those in the non-PTB group (p = 0.51) and pleural effusions were present in 22.5% and 17.9%, respectively (p = 0.64); extensive infiltrations were seen on chest radiographs in 72.5% and 39.3% (p = 0.006) and cavities in 32.5% and 0% (p < 0.001). The leading causative pathogen in the non-PTB group was Haemophilus influenzae (25.0%) followed by Streptococcus pneumoniae (17.9%) and Klebsiella pneumoniae (10.7%; S1 Table).

Fig 1. Flow chart showing the selection of PTB and non-PTB patients in this study.

Fig 1

Eligible patients were further extracted by the inclusion criteria described in the Methods section. PCR, polymerase chain reaction; PTB, pulmonary tuberculosis.

Table 1. Patient demographics, underlying diseases, and radiographic findings of pneumonia.

PTB Non-PTB
(n = 40) (n = 28) p-value*
Age 78 (46–100) 74 (55–91) 0.28
Female sex# 40.0% (16) 17.9% (5) 0.052
Underlying disease
    ILD 5.0% (2) 7.1% (2) >0.99
    Asthma 2.5% (1) 7.1% (2) 0.56
    COPD 7.5% (3) 21.4% (6) 0.15
    Bronchiectasis 2.5% (1) 3.6% (1) >0.99
    Malignancy 12.5% (5) 7.1% (2) 0.69
    Cardiovascular# 22.5% (9) 28.6% (8) 0.57
    CKD (non-HD) 7.5% (3) 14.3% (4) 0.43
    Chronic liver disease 2.5% (1) 3.6% (1) >0.99
    Hemodialysis 7.5% (3) 7.1% (2) >0.99
    Diabetes mellitus# 27.5% (11) 14.3% (4) 0.20
    HIV infection 0.0% (0) 7.1% (2) 0.17
Immunosuppressant 2.5% (1) 0.0% (0) >0.99
Radiographic findings of pneumonia#
    Bilateral disease 65.0% (26) 57.1% (16) 0.51
    Extensive infiltration 72.5% (29) 39.3% (11) 0.006
    Pleural effusion 22.5% (9) 17.9% (5) 0.64
    Cavity 32.5% (13) 0.0% (0) < 0.001

The median age (range) and proportion (number) of female patients, patients with each underlying disease, immunosuppressant use, and patients with each radiographic finding are shown.

*Differences between PTB and non-PTB were analyzed by Fisher’s exact test, except variables labelled with the hash sign.

#Differences between two groups were analyzed using the Pearson’s chi-square test. Abbreviations: PTB, pulmonary tuberculosis; ILD, interstitial lung disease; COPD, chronic obstructive pulmonary disease; CKD, chronic kidney disease; HD, hemodialysis; HIV, human immunodeficiency virus

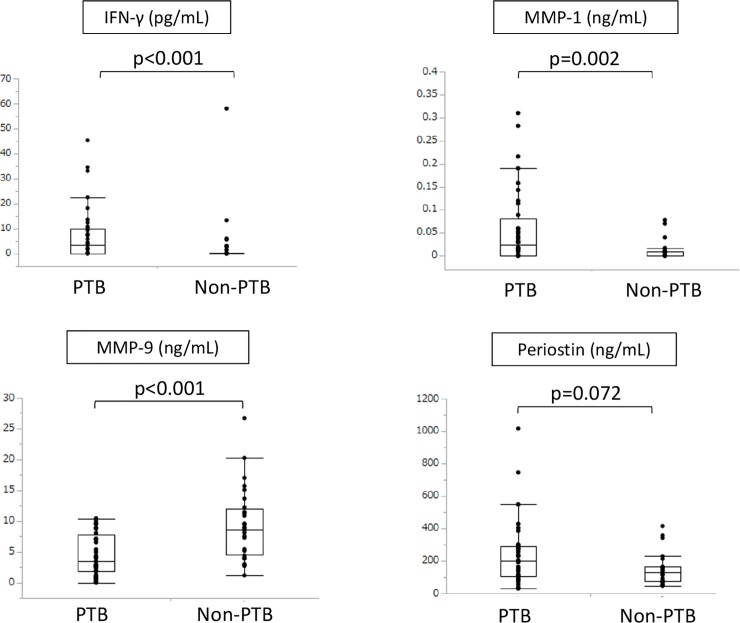
Serum IFN-γ and MMP-1 levels were significantly higher in the PTB group (p < 0.001 and p = 0.002, respectively) whereas MMP-9 levels were significantly lower (p < 0.001; Fig 2). There was no significant between-group difference in the periostin level. The median (interquartile range) IFN-γ, MMP-1, MMP-9, and periostin levels in the PTB group were 3.46 pg/dL (0.11–10.11), 0.024 ng/dL (0.00–0.082), 3.45 ng/dL (1.83–7.81), and 198.86 ng/dL (105.23–289.57), respectively; the respective values in the non-PTB group were 0.00 pg/dL (0.00–0.28), 0.0 ng/dL (0.00–0.0088), 8.66 ng/dL (4.58–12.04), and 131.06 ng/dL (74.80–166.58). Because factors other than PTB may affect serum IFN-γ and MMP-1 levels, we compared these biomarkers by gender and underlying diseases regardless of the presence of PTB. The results show that there were no significant differences in serum IFN-γ levels by gender or underlying diseases. In contrast, serum MMP-1 levels in patients with malignancy were significantly higher than those without malignancy (S1 Fig). However, multivariate analysis showed that only PTB was associated with elevated serum MMP-1 levels (S2 Table).

Fig 2. Comparison of serum markers between PTB and non-PTB patients.

Fig 2

Serum IFN-γ, MMP-1, MMP-9, and periostin levels were compared between the two groups of patients. IFN-γ, interferon gamma; MMP-1, matrix metalloprotein-1; MMP-9, matrix metalloprotein-9.

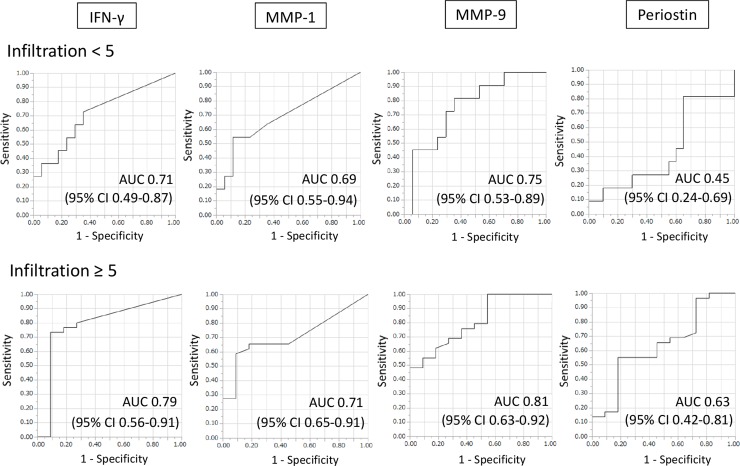
The diagnostic performances of IFN-γ, MMP-1, MMP-9, and periostin were assessed using the ROC curves. The respective areas under the curve for IFN-γ, MMP-1, MMP-9, and periostin were 0.71 (95% CI 0.49–0.87), 0.69 (95% CI 0.55–0.94), 0.75 (95% CI 0.53–0.89), and 0.45 (95% CI 0.24–0.69) in the patients with limited infiltration and 0.79 (95% CI 0.56–0.91), 0.71 (95% CI 0.65–0.91), 0.81 (95% CI 0.63–0.92), and 0.63 (95% CI 0.42–0.81) in those with extensive infiltration (Fig 3). However, when a cut-off value with high sensitivity (90%) was used, the respective specificity values for IFN-γ, MMP-1, MMP-9, and periostin were as low as 0.24, 0.18, 0.47, and 0.00 in the limited infiltration group and 0.35, 0.16, 0.46, and 0.27 in the extensive infiltration group.

Fig 3. Diagnostic performance in PTB patients with limited infiltration and their counterparts with extensive infiltration.

Fig 3

ROC curves showing the diagnostic performance of IFN-γ, MMP-1, MMP-9, and periostin for PTB in patients with radiographic evidence of limited or extensive infiltration. AUC, area under the curve; CI, confidence interval; IFN-γ, interferon gamma; MMP-1, matrix metalloprotein-1; MMP-9, matrix metalloprotein-9.

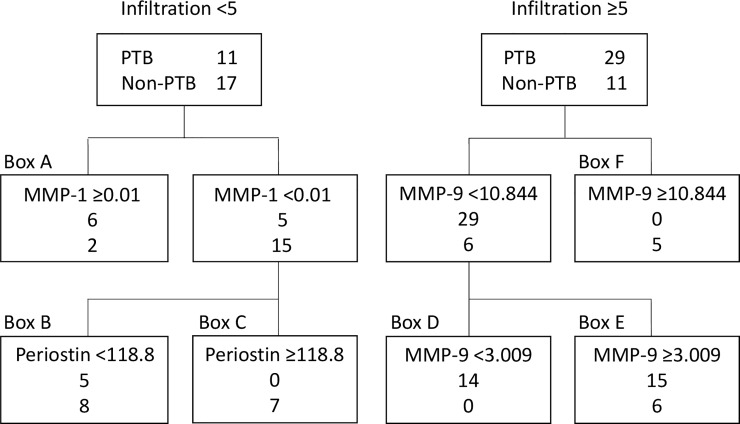
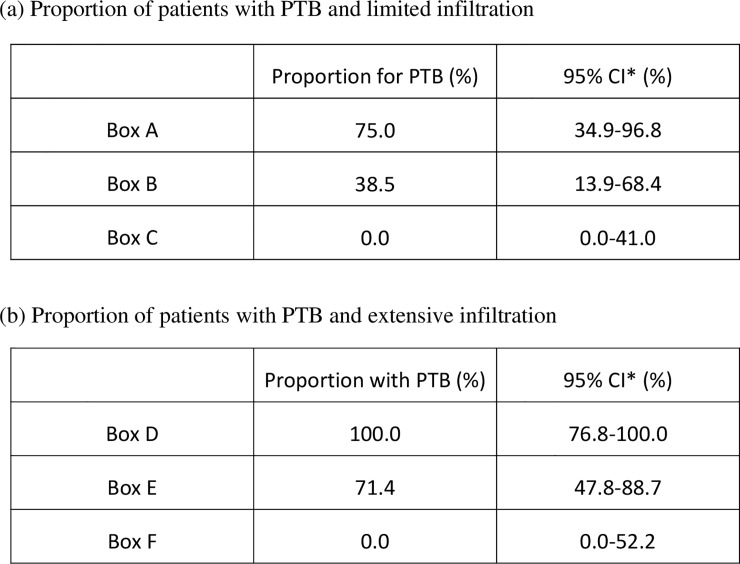
The diagnostic performance of each of the four proteins was then evaluated using the classification tree (Fig 4). Six of the patients with limited infiltration in the PTB group and two in the non-PTB group had an MMP-1 level ≥ 0.01 ng/mL (Fig 4, box A); none of those with an MMP-1 level < 0.01 ng/mL in the PTB group had a periostin level ≥118.8 ng/mL (Fig 4, box C). Five patients in the PTB group and eight in the non-PTB group had an MMP-1 level < 0.01 ng/mL and a periostin level < 118.8 ng/mL (Fig 4, box B); the respective values in the PTB group were 75% (95% CI 34.9–96.8), 38.5% (95% CI 13.9–68.4), and 0% (95% CI 0.0–41.0; Fig 5A). Significant differences were found between the three subgroups (p = 0.01). All patients with extensive infiltration and an MMP-9 level < 3.009 ng/mL were in the PTB group (Fig 4, box D). Fifteen of the patients with an MMP-9 level in the range of 3.009–10.844 ng/mL were in the PTB group and 6 were in the non-PTB group. All patients with an MMP-9 level ≥ 10.844 ng/mL were in the non-PTB group. The proportions of patients with PTB in boxes D, E, and F were 100% (95% CI 76.8–100), 71.4% (95% CI 47.8–88.7), and 0% (95% CI 0.0–52.2), respectively. The between-group differences were statistically significant (p < 0.001, Fig 5B).

Fig 4. Algorithm for discrimination between PTB and non-PTB patients using the classification tree method.

Fig 4

Serum markers were used to differentiate between PTB and non-PTB patients according to the extent of infiltration using the classification tree. The cut-off values used to discriminate between the patient groups are shown on the uppermost line. The second number shows the number of patients with PTB. The lowest line shows the number of non-PTB patients affected by the cut-off value. IFN-γ, interferon gamma; MMP-1, matrix metalloprotein-1; MMP-9, matrix metalloprotein-9; PTB, pulmonary tuberculosis.

Fig 5. Proportion of PTB patients with limited or extensive infiltration.

Fig 5

The proportions and 95% confidence intervals for PTB patients with limited infiltration (a) and extensive infiltration (b) are shown. *Confidence interval. PTB, pulmonary tuberculosis.

Discussion

This study provides early evidence of the ability of IFN-γ, MMP-1, MMP-9, and periostin to differentiate between PTB and non-PTB patients. Although IFN-γ, MMP-1, and MMP-9 are known to be crucial players in the immune response to TB, few studies have investigated their value as markers for differentiating between PTB and non-PTB. Moreover, there are no reports on serum periostin levels in patients with PTB.

Previous reports have demonstrated elevated serum IFN-γ levels in patients with PTB when compared with healthy controls [11, 23, 24]. Yamada et al. reported that the IFN-γ level was significantly higher in patients with radiographic evidence of far-advanced PTB than in their counterparts with minimal or moderately advanced PTB and in healthy controls [11]. In the present study, there was no obvious association between the IFN-γ level and the extent of infiltration in patients with PTB (data not shown), possibly because of individual variation in the immune response and the fact that patients with malignancy, collagen disease, and immunosuppressive therapy were included, unlike in the study by Yamada et al. Another possible reason for this discrepancy may be the time interval between the onset of symptoms and blood collection; however, this interval was not recorded in either study. Min et al. reported that the serum IFN-γ level reached a peak in rhesus monkeys at 6 weeks after infection with M. tuberculosis and returned to baseline after 12 weeks [25]. Therefore, timing of blood collection may influence the IFN-γ level.

MMP-1 can degrade the extracellular (collagen) matrix and destroy caseous granuloma, leading to formation of cavities in the lungs of patients with PTB, and is released during cavity formation in a tuberculous lesion regardless of the existence of cavities [9, 26, 27]. Previous reports have demonstrated plasma MMP-1 levels to be significantly higher in patients with PTB than in healthy controls and patients with LTBI or sarcoidosis [12, 28]. To date, no reports have compared serum MMP-1 levels between PTB and non-PTB patients. Our results show that serum MMP-1 levels in PTB were still higher than those in non-PTB, suggesting MMP-1 can be used to distinguish PTB from non-PTB patients.

We found that the serum MMP-9 levels were significantly lower in PTB than in non-PTB patients, whereas Xu et al. reported that serum MMP-9 levels were significantly higher in PTB than in non-PTB patients [13]. However, there are several reports of increased serum MMP-9 in patients with community-acquired or ventilator-associated pneumonia [2931]. In contrast, Hrabec et al. reported that the serum MMP-9 level was three times higher in patients with TB than in normal subjects [32]. Therefore, MMP-9 may be increased in both PTB and non-PTB. Our data suggest that the MMP-9 level may be lower in patients with PTB; however, further studies are needed to explain the discrepancy between our finding and that of Xu et al.

ROC curves were created to investigate the diagnostic performance of each protein for PTB. Given that the extent of infiltration is likely to be involved, the patients were divided according to whether the infiltration was limited or extensive. MMP-9 was the most useful of the four proteins for discriminating PTB from non-PTB regardless of the extent of infiltration. However, when a protein cut-off value with high sensitivity (90%) was determined, the corresponding specificity was low, so we considered it inappropriate to using these cut-off values to differentiate between PTB and non-PTB. Therefore, a classification tree was created to evaluate the clinical value of each marker. MMP-1 and periostin were selected as the explanatory variables in the group with limited infiltration and MMP-9 as the explanatory variable in the group with extensive infiltration. In the patients with limited infiltration, the 95% CI for the proportion with PTB in box C in Fig 4 was 0–41, indicating that these patients were likely not to have PTB. Moreover, the 95% CI for the patients with extensive infiltration in box D was 76.8–100, implying a high likelihood of PTB. The 95% CIs were broad in the rest of the boxes, so the likelihood of those patients having PTB is unclear. Nevertheless, this classification could be useful in the clinical management of patients, especially those presenting with pneumonia of unknown origin. The classification tree method automatically chooses some appropriate markers and their cut-off values to divide patients into two groups according to its algorithm [22]. Although interpretation of the classification is sometimes difficult, it is possible that MMP-9 was chosen as a useful biomarker especially in patients with extensive infiltration because it was reported that plasma MMP-9 levels are associated with severity of ventilator-associated pneumonia [29]. Therefore, the difference between PTB and non-PTB may become more apparent in patients with extensive infiltration.

Our study has several strengths. First, it compared IFN-γ, MMP-1, MMP-9, and periostin levels between patients with PTB and non-PTB. Except for one study by Xu et al. [13], who focused on MMP-9, previous studies compared these proteins between patients with PTB and healthy controls or patients with LTBI. Given the clinical importance of identifying PTB in patients with pneumonia, our study design is more appropriate for identification of clinically useful diagnostic serum markers. Second, both ROC analysis and a classification tree were used to evaluate the clinical usefulness of these markers. Unlike ROC analysis, a classification tree could prioritize each of the markers and classify patients into subgroups based on their risk, so it was the appropriate method for identifying patients with a high probability of PTB.

There are also some limitations to this research. First, the sample size was small, so the 95% CIs were broad. However, exclusion of patients without pre-treatment blood samples ensured the validity of the study. Second, the study had a retrospective design and some patients were excluded because of our selection criteria, which may have introduced a degree of selection bias. This possibility is considered small because no patients were excluded according to their characteristics. Finally, the study included data from only two hospitals. However, in Okinawa, most patients with PTB who require admission are referred to one of these two institutions, so our results can be considered representative for this region.

In conclusion, serum IFN-γ, MMP-1, MMP-9, and periostin levels could be useful markers for distinguishing between PTB and non-PTB. However, our findings need to be confirmed in larger studies that include more centers before they can be generalized to other populations.

Supporting information

S1 Table. Causative bacteria in patients with non-tuberculous pneumonia.

(DOC)

S2 Table. Factors associated with elevated MMP-1 levels by multivariate analysis.

(DOC)

S1 Fig. Comparison of serum MMP-1 levels between patients with and without malignancy.

(TIFF)

S1 File. Raw data.

(XLSX)

Acknowledgments

We would like to thank laboratory technicians in the Department of Infectious Diseases, Respiratory, and Digestive Medicine, Graduate School of Medicine, University of the Ryukyus, and National Hospital Organization Okinawa Hospital, for their contribution to handling serum samples. We would also like to thank Editage (www.editage.com) for English language editing.

Data Availability

All relevant data are within the manuscript and its Supporting Information files.

Funding Statement

The authors received no specific funding for this work.

References

  • 1.World Health Organization. Global tuberculosis report 2018. Geneva: World Health Organization; 2018. [Google Scholar]
  • 2.Peto L, Nadjm B, Horby P, Ngan TT, van Doorn R, Van Kinh N, et al. The bacterial aetiology of adult community-acquired pneumonia in Asia: a systematic review. Trans R Soc Trop Med Hyg. 2014;108: 326–337. 10.1093/trstmh/tru058 [DOI] [PMC free article] [PubMed] [Google Scholar]
  • 3.Chon SB, Kim TS, Oh WS, Lee SJ, Han SS, Kim WJ. Pulmonary tuberculosis among patients hospitalised with community-acquired pneumonia in a tuberculosis-prevalent area. Int J Tuberc Lung Dis. 2013;17: 1626–1631. 10.5588/ijtld.13.0183 [DOI] [PubMed] [Google Scholar]
  • 4.Jhun BW, Sim YS, Shin TR, Kim DG. The utility of delta neutrophil index in differentiation of pulmonary tuberculosis from community acquired pneumonia. Sci Rep. 2018;8: 12343 10.1038/s41598-018-30967-9 [DOI] [PMC free article] [PubMed] [Google Scholar]
  • 5.Cooper AM, Dalton DK, Stewart TA, Griffin JP, Russell DG, Orme IM. Disseminated tuberculosis in interferon gamma gene-disrupted mice. J Exp Med. 1993;178: 2243–2247. 10.1084/jem.178.6.2243 [DOI] [PMC free article] [PubMed] [Google Scholar]
  • 6.Flynn JL, Chan J, Triebold KJ, Dalton DK, Stewart TA, Bloom BR. An essential role for interferon gamma in resistance to Mycobacterium tuberculosis infection. J Exp Med. 1993;178: 2249–2254. 10.1084/jem.178.6.2249 [DOI] [PMC free article] [PubMed] [Google Scholar]
  • 7.Somerville RP, Oblander SA, Apte SS. Matrix metalloproteinases: old dogs with new tricks. Genome Biol. 2003;4: 216 10.1186/gb-2003-4-6-216 [DOI] [PMC free article] [PubMed] [Google Scholar]
  • 8.Ong CW, Elkington PT, Friedland JS. Tuberculosis, pulmonary cavitation, and matrix metalloproteinases. Am J Respir Crit Care Med. 2014;190: 9–18. 10.1164/rccm.201311-2106PP [DOI] [PMC free article] [PubMed] [Google Scholar]
  • 9.Elkington PT, Ugarte-Gil CA, Friedland JS. Matrix metalloproteinases in tuberculosis. Eur Respir J. 2011;38: 456–464. 10.1183/09031936.00015411 [DOI] [PubMed] [Google Scholar]
  • 10.Dorhoi A, Kaufmann SH. Pathology and immune reactivity: understanding multidimensionality in pulmonary tuberculosis. Semin Immunopathol. 2016;38: 153–166. 10.1007/s00281-015-0531-3 [DOI] [PubMed] [Google Scholar]
  • 11.Yamada G, Shijubo N, Shigehara K, Okamura H, Kurimoto M, Abe S. Increased levels of circulating interleukin-18 in patients with advanced tuberculosis. Am J Respir Crit Care Med. 2000;161: 1786–1789. 10.1164/ajrccm.161.6.9911054 [DOI] [PubMed] [Google Scholar]
  • 12.Andrade BB, Pavan Kumar N, Amaral EP, Riteau N, Mayer-Barber KD, Tosh KW, et al. Heme oxygenase-1 regulation of matrix metalloproteinase-1 expression underlies distinct disease profiles in tuberculosis. J Immunol. 2015;195: 2763–2773. 10.4049/jimmunol.1500942 [DOI] [PMC free article] [PubMed] [Google Scholar]
  • 13.Xu D, Li Y, Li X, Wei LL, Pan Z, Jiang TT, et al. Serum protein S100A9, SOD3, and MMP9 as new diagnostic biomarkers for pulmonary tuberculosis by iTRAQ-coupled two-dimensional LC-MS/MS. Proteomics. 2015;15: 58–67. 10.1002/pmic.201400366 [DOI] [PubMed] [Google Scholar]
  • 14.Koguchi Y, Kawakami K, Uezu K, Fukushima K, Kon S, Maeda M, et al. High plasma osteopontin level and its relationship with interleukin-12-mediated type 1 T helper cell response in tuberculosis. Am J Respir Crit Care Med. 2003;167: 1355–1359. 10.1164/rccm.200209-1113OC [DOI] [PubMed] [Google Scholar]
  • 15.Okamoto M, Hoshino T, Kitasato Y, Sakazaki Y, Kawayama T, Fujimoto K, et al. Periostin, a matrix protein, is a novel biomarker for idiopathic interstitial pneumonias. Eur Respir J. 2011;37: 1119–1127. 10.1183/09031936.00059810 [DOI] [PubMed] [Google Scholar]
  • 16.Matsumoto H. Serum periostin: a novel biomarker for asthma management. Allergol Int. 2014;63: 153–160. 10.2332/allergolint.13-RAI-0678 [DOI] [PubMed] [Google Scholar]
  • 17.Li W, Gao P, Zhi Y, Xu W, Wu Y, Yin J, et al. Periostin: its role in asthma and its potential as a diagnostic or therapeutic target. Respir Res 2015;16: 57 10.1186/s12931-015-0218-2 [DOI] [PMC free article] [PubMed] [Google Scholar]
  • 18.Verma SC, Agarwal P, Krishnan MY. Primary mouse lung fibroblasts help macrophages to tackle Mycobacterium tuberculosis more efficiently and differentiate into myofibroblasts up on bacterial stimulation. Tuberculosis (Edinb). 2016;97: 172–180. [DOI] [PubMed] [Google Scholar]
  • 19.Kaarteenaho-Wiik R, Sademies O, Paakko P, Risteli J, Soini Y. Extracellular matrix proteins and myofibroblasts in granulomas of sarcoidosis, atypical mycobacteriosis, and tuberculosis of the lung. Hum Pathol. 2007;38: 147–153. 10.1016/j.humpath.2006.07.001 [DOI] [PubMed] [Google Scholar]
  • 20.The report of the Committee for the Respiratory System, the Committee of Clinical Evaluation Methods for Antibiotics, Japanese Society of Chemotherapy. Clinical evaluation method for new antimicrobial agents to treat respiratory infections. Jpn J Chemother. 1997;45: 762–778 [In Japanese]. [Google Scholar]
  • 21.Tamayose M, Fujita J, Parrott G, Miyagi K, Maeshiro T, Hirata T, et al. Correlations between extent of X-ray infiltration and levels of serum C-reactive protein in adult non-severe community-acquired pneumonia. J Infect Chemother. 2015;21: 456–463. 10.1016/j.jiac.2015.02.009 [DOI] [PubMed] [Google Scholar]
  • 22.Ootaki A, Horie Y, Steinberg D. Applied Tree-Based Method by CART. Tokyo, Japan: Nikkagiren Publishing; 1998. [Google Scholar]
  • 23.Chandrashekara S, Anupama KR, Sambarey A, Chandra N. High IL-6 and low IL-15 levels mark the presence of TB infection: A preliminary study. Cytokine. 2016;81: 57–62. 10.1016/j.cyto.2016.02.003 [DOI] [PubMed] [Google Scholar]
  • 24.Namuganga AR, Chegou NN, Mubiri P, Walzl G, Mayanja-Kizza H. Suitability of saliva for tuberculosis diagnosis: comparing with serum. BMC Infect Dis. 2017;17: 600 10.1186/s12879-017-2687-z [DOI] [PMC free article] [PubMed] [Google Scholar]
  • 25.Min F, Wu R, Pan J, Huang S, Luo Y, Zhang Y. Positive correlation between IP-10 and IFN-gamma levels in Rhesus monkeys (Macaca mulatta) with either naturally acquired or experimental infection of Mycobacterium tuberculosis. Biomed Res Int. 2017;2017: 5089752 10.1155/2017/5089752 [DOI] [PMC free article] [PubMed] [Google Scholar]
  • 26.Elkington P, Shiomi T, Breen R, Nuttall RK, Ugarte-Gil CA, Walker NF, et al. MMP-1 drives immunopathology in human tuberculosis and transgenic mice. J. Clin. Invest. 2011; 121: 1827–33. 10.1172/JCI45666 [DOI] [PMC free article] [PubMed] [Google Scholar]
  • 27.Al Shammari B, Shiomi T, Tezera L, Bielecka MK, Workman V, Sathyamoorthy T, et al. The extracellular matrix regulates granuloma necrosis in tuberculosis. J. Infect. Dis. 2015; 212: 463–73. 10.1093/infdis/jiv076 [DOI] [PMC free article] [PubMed] [Google Scholar]
  • 28.Sathyamoorthy T, Sandhu G, Tezera LB, Thomas R, Singhania A, Woelk CH, et al. Gender-dependent differences in plasma matrix metalloproteinase-8 elevated in pulmonary tuberculosis. PLoS One. 2015; 10: e0117605 10.1371/journal.pone.0117605 [DOI] [PMC free article] [PubMed] [Google Scholar]
  • 29.Li YT, Wang YC, Lee HL, Lu MC, Yang SF. Elevated plasma matrix metalloproteinase-9 and its correlations with severity of disease in patients with ventilator-associated pneumonia. Int. J. Med. Sci. 2016; 13: 638–45. 10.7150/ijms.16187 [DOI] [PMC free article] [PubMed] [Google Scholar]
  • 30.Yang SF, Chu SC, Chiang IC, Kuo WF, Chiou HL, Chou FP, et al. Excessive matrix metalloproteinase-9 in the plasma of community-acquired pneumonia. Clin. Chim. Acta. 2005; 352: 209–15. 10.1016/j.cccn.2004.09.025 [DOI] [PubMed] [Google Scholar]
  • 31.Bircan HA, Cakir M, Yilmazer Kapulu I, Sutcu R, Kaya S. Elevated serum matrix metalloproteinase-2 and -9 and their correlations with severity of disease in patients with community-acquired pneumonia. Turk. J Med. Sci. 2015; 45: 593–9. 10.3906/sag-1402-51 [DOI] [PubMed] [Google Scholar]
  • 32.Hrabec E, Strek M, Zieba M, Kwiatkowska S, Hrabec Z. Circulation level of matrix metalloproteinase-9 is correlated with disease severity in tuberculosis patients. Int. J. Tuberc. Lung Dis. 2002; 6: 713–9. [PubMed] [Google Scholar]

Decision Letter 0

Frederick Quinn

20 Aug 2019

PONE-D-19-19256

Diagnostic performance of serum interferon gamma, matrix metalloproteinases, and periostin measurements for pulmonary tuberculosis in Japanese patients with pneumonia

PLOS ONE

Dear Dr. Kinjo,

Thank you for submitting your manuscript to PLOS ONE. After careful consideration, we feel that it has merit but does not fully meet PLOS ONE’s publication criteria as it currently stands. Therefore, we invite you to submit a revised version of the manuscript that addresses the points raised during the review process.

We would appreciate receiving your revised manuscript. When you are ready to submit your revision, log on to https://www.editorialmanager.com/pone/ and select the 'Submissions Needing Revision' folder to locate your manuscript file.

If you would like to make changes to your financial disclosure, please include your updated statement in your cover letter.

To enhance the reproducibility of your results, we recommend that if applicable you deposit your laboratory protocols in protocols.io, where a protocol can be assigned its own identifier (DOI) such that it can be cited independently in the future. For instructions see: http://journals.plos.org/plosone/s/submission-guidelines#loc-laboratory-protocols

Please include the following items when submitting your revised manuscript:

  • A rebuttal letter that responds to each point raised by the academic editor and reviewer(s). This letter should be uploaded as separate file and labeled 'Response to Reviewers'.

  • A marked-up copy of your manuscript that highlights changes made to the original version. This file should be uploaded as separate file and labeled 'Revised Manuscript with Track Changes'.

  • An unmarked version of your revised paper without tracked changes. This file should be uploaded as separate file and labeled 'Manuscript'.

Please note while forming your response, if your article is accepted, you may have the opportunity to make the peer review history publicly available. The record will include editor decision letters (with reviews) and your responses to reviewer comments. If eligible, we will contact you to opt in or out.

We look forward to receiving your revised manuscript.

Kind regards,

Frederick Quinn

Academic Editor

PLOS ONE

Journal Requirements:

When submitting your revision, we need you to address these additional requirements.

1. Please ensure that your manuscript meets PLOS ONE's style requirements, including those for file naming. The PLOS ONE style templates can be found at

http://www.journals.plos.org/plosone/s/file?id=wjVg/PLOSOne_formatting_sample_main_body.pdf and http://www.journals.plos.org/plosone/s/file?id=ba62/PLOSOne_formatting_sample_title_authors_affiliations.pdf

2. In the ethics statement in the manuscript and in the online submission form, please provide additional information about the patient records/samples used in your retrospective study. Specifically, please ensure that you have discussed whether all data/samples were fully anonymized before you accessed them and/or whether the IRB or ethics committee waived the requirement for explicit informed consent (an opt-out system does not necessarily fulfil this criterion). If patients provided informed written consent to have data/samples from their medical records used in research, please include this information.

3. Please note that all PLOS journals ask authors to adhere to our policies for sharing of data and materials: https://journals.plos.org/plosone/s/data-availability. According to PLOS ONE’s Data Availability policy, we require that the minimal dataset underlying results reported in the submission must be made immediately and freely available at the time of publication. As such, please remove any instances of 'unpublished data' or 'data not shown' in your manuscript and replace these with either the relevant data (in the form of additional figures, tables or descriptive text, as appropriate), a citation to where the data can be found, or remove altogether any statements supported by data not presented in the manuscript.

[Note: HTML markup is below. Please do not edit.]

Reviewers' comments:

Reviewer's Responses to Questions

Comments to the Author

1. Is the manuscript technically sound, and do the data support the conclusions?

The manuscript must describe a technically sound piece of scientific research with data that supports the conclusions. Experiments must have been conducted rigorously, with appropriate controls, replication, and sample sizes. The conclusions must be drawn appropriately based on the data presented.

Reviewer #1: Partly

Reviewer #2: No

**********

2. Has the statistical analysis been performed appropriately and rigorously?

Reviewer #1: Yes

Reviewer #2: Yes

**********

3. Have the authors made all data underlying the findings in their manuscript fully available?

The PLOS Data policy requires authors to make all data underlying the findings described in their manuscript fully available without restriction, with rare exception (please refer to the Data Availability Statement in the manuscript PDF file). The data should be provided as part of the manuscript or its supporting information, or deposited to a public repository. For example, in addition to summary statistics, the data points behind means, medians and variance measures should be available. If there are restrictions on publicly sharing data—e.g. participant privacy or use of data from a third party—those must be specified.

Reviewer #1: Yes

Reviewer #2: Yes

**********

4. Is the manuscript presented in an intelligible fashion and written in standard English?

PLOS ONE does not copyedit accepted manuscripts, so the language in submitted articles must be clear, correct, and unambiguous. Any typographical or grammatical errors should be corrected at revision, so please note any specific errors here.

Reviewer #1: No

Reviewer #2: No

**********

5. Review Comments to the Author

Please use the space provided to explain your answers to the questions above. You may also include additional comments for the author, including concerns about dual publication, research ethics, or publication ethics. (Please upload your review as an attachment if it exceeds 20,000 characters)

Reviewer #1: Yamauchi et al assess the the Diagnostic performance of serum IFNg, MMP and periostin measurements for PTB in Japanese population. For this, they first performed ROC analysis and found IFNg, MMP-1 higher and MMP-9 lower in PTB pneumonia. The authors further adopt a classification tree based on cut-off values of MMP- 1, -9 and periostin to distinguish PTB and non-PTB pneumonia patients. Since the TB diagnostic field needs a biomarker that has better prognostic value than IFNg particularly in TB endemic regions, the proposed work is appealing as it explores periostin as a novel molecule in PTB. Periostin is an important protein in asthma and airway inflammation and is worth studying its role during M tuberculosis infection. However, this research has several drawbacks and I have reservations in accepting the manuscript in the present form.

One of my major concern is that, the manuscript is not well and thoughtfully written.

- The use of PTB pneumonia is confusing, do authors use this term in place of PTB or PTB pneumonia has clinical features distinct from PTB. It should be explained in the Introduction.

- The Results section and Figure Legends are mixed-up, which is confusing and breaks the continuity of reading the manuscript. Separating out the two sections would have been better.

- In the Discussion section line 240, it is not clear what authors mean by "....early evidence....", is it combination of the 4 biomarkers determine early disease stage or the study is the new evidence of ability of these biomarkers to determine PTB vs non-PTB? Line 260, authors start with description of MMP-1, state no reports of MMP-1 (line 265) and suddenly switch to their findings for MMP-9 (line 267), without discussing about their opinion on MMP-1.

- The study design has a Major flaw that is does not include age matched Healthy control population. Further, sample size is too small to reach any logical conclusion.

- What were the biomarker(s) levels pre-treatment? Does serum Periostin, MMP-1 and MMP-9 levels changed post anti-tuberculosis treatment?

- It is my understanding that the BD CBA Th1/Th2/Th17 used in this study can also determine IL-2,-6,-17A and TNFa quantities. Postn-/- mice increase TNFa production (Carcinogenesis 2019; 40 (1): 102); since TNFa is a prominent cytokine with anti-TB activity, it will be interesting and important to assess modulation of these cytokines in relation to periostin in PTB and non-PTB conditions.

- The claim made by authors to distinguish PTB and non-PTB patients using classification tree method does not corroborate with the results (Figure 4). Firstly, Figure Legend has IFNg included, but neither the Figure 4, nor the text has any mention of IFNg in this analysis. Line 211 explains, all patients (infiltration <5) with MMP-1 <0.01 ng/ml in the non-PTB group had periostin level >118.8 ng/ml, when in fact 7 (46.7%) had > 118.8 and 8 (53.3%) had <118.8 ng/ml periostin level. If periostin is not significantly different in PTB and non-PTB groups, what was the purpose to include it is classification tree and how is it helpful to discriminate the patient groups?

- Similarly, Infiltration>5 group, nearly equal numbers of PTB patients have MMP-9 <3.009 (N=14) and >3.009 (N=15).What is the relevance of these values.

- I highly recommend along with Figure 5 (This is actually a Table) authors include a summary diagram (diagnostic algorithm) that is easy to follow and explains criteria / variables / cut-off values proposed by the authors to discriminate PTB and non-PTB groups.

Reviewer #2: In this study, the authors analyzed the serum levels of IFN-γ, MMP-1, MMP-9 and periostin in tuberculous pneumonia and non-tuberculous pneumonia patients. They also developed a new classification tree by using MMP-1, MMP-9 and periostin level to diagnose tuberculous pneumonia and non-tuberculous pneumonia patients. Their results are of interest. However, there are several major concerns that need to be addressed.

1. MMP-1 and MMP-9 are well known factors involved in many diseases. They are not specific markers for tuberculosis. The sample size in this study is small (40 vs. 28) and patients in each group are with a wide range of ages and diseases. I think it will be more appropriate to perform a more specific analysis. E.g. compare PTD vs non-PTD when both group patients have cardiovascular disorder or bilateral disease (with similar condition)…

2. The authors need to clarify the expression profile of MMP-1, MMP-9 and periostin over the infection time . Is there any dynamics? I am not clear if they compared the samples from the same time after infection.

3. I hope they can provide more explanation on the association between MMP-9 level and pneumonia patients with limited infiltration; also for the association between MMP-1, periostin and pneumonia patients with extensive infiltration.

4. I feel a little bit hard to read this manuscript due to the language. I suggest they have someone to correct the grammar and typos.

**********

6. PLOS authors have the option to publish the peer review history of their article (what does this mean?). If published, this will include your full peer review and any attached files.

If you choose “no”, your identity will remain anonymous but your review may still be made public.

Do you want your identity to be public for this peer review? For information about this choice, including consent withdrawal, please see our Privacy Policy.

Reviewer #1: No

Reviewer #2: No

[NOTE: If reviewer comments were submitted as an attachment file, they will be attached to this email and accessible via the submission site. Please log into your account, locate the manuscript record, and check for the action link "View Attachments". If this link does not appear, there are no attachment files to be viewed.]

While revising your submission, please upload your figure files to the Preflight Analysis and Conversion Engine (PACE) digital diagnostic tool, https://pacev2.apexcovantage.com/. PACE helps ensure that figures meet PLOS requirements. To use PACE, you must first register as a user. Registration is free. Then, login and navigate to the UPLOAD tab, where you will find detailed instructions on how to use the tool. If you encounter any issues or have any questions when using PACE, please email us at figures@plos.org. Please note that Supporting Information files do not need this step.

PLoS One. 2020 Jan 9;15(1):e0227636. doi: 10.1371/journal.pone.0227636.r002

Author response to Decision Letter 0


9 Dec 2019

Reviewer #1: Yamauchi et al assess the the Diagnostic performance of serum IFNg, MMP and periostin measurements for PTB in Japanese population. For this, they first performed ROC analysis and found IFNg, MMP-1 higher and MMP-9 lower in PTB pneumonia. The authors further adopt a classification tree based on cut-off values of MMP- 1, -9 and periostin to distinguish PTB and non-PTB pneumonia patients. Since the TB diagnostic field needs a biomarker that has better prognostic value than IFNg particularly in TB endemic regions, the proposed work is appealing as it explores periostin as a novel molecule in PTB. Periostin is an important protein in asthma and airway inflammation and is worth studying its role during M tuberculosis infection. However, this research has several drawbacks and I have reservations in accepting the manuscript in the present form.

We really appreciate your reading of our manuscript and your comments and suggestions. We revised our manuscript following your comments. It would be most appreciated if you could give us your feedback to our response.

One of my major concern is that, the manuscript is not well and thoughtfully written.

- The use of PTB pneumonia is confusing, do authors use this term in place of PTB or PTB pneumonia has clinical features distinct from PTB. It should be explained in the Introduction.

Thank you for your comments. We totally agree that the submitted version of our manuscript was confusing owing to the wording you pointed out. In the revised version, we used “PTB” or “non-PTB” to make the text clearer.

- The Results section and Figure Legends are mixed-up, which is confusing and breaks the continuity of reading the manuscript. Separating out the two sections would have been better.

This “mixed-up” style is required by the submission guidelines of PLOS ONE journal.

- In the Discussion section line 240, it is not clear what authors mean by "....early evidence....", is it combination of the 4 biomarkers determine early disease stage or the study is the new evidence of ability of these biomarkers to determine PTB vs non-PTB?

We used the expression “early evidence” to express that our data were not conclusive but showed the potential of the identified biomarkers to differentiate PTB from non-PTB. We think our findings should be validated by additional studies in the future as described in the Discussion section of the revised manuscript.

Line 260, authors start with description of MMP-1, state no reports of MMP-1 (line 265) and suddenly switch to their findings for MMP-9 (line 267), without discussing about their opinion on MMP-1.

Thank you for your comments. Following your suggestions, we added our opinion regarding the findings of MMP-1 (lines 270-272). In addition, the description of MMP-9 now starts in a new paragraph (Line 273).

- The study design has a Major flaw that is does not include age matched Healthy control population. Further, sample size is too small to reach any logical conclusion.

As we already mentioned in the Discussion section (lines 309-311), we think one of the strengths of our study is the comparison of serum biomarkers between PTB and non-PTB patients, not healthy subjects. From the perspective of clinical practice, physicians should differentiate PTB from non-PTB patients, not these from healthy subjects. Therefore, serum biomarkers that are higher in patients than in healthy subjects are not helpful to differentiate PTB from non-PTB in clinical practice. To make this point clearer, we added a description to the Introduction section (lines 72-74). In terms of the sample size in our study, we totally agree with your comment. As we mentioned in the Discussion section, this is a limitation of our study. However, we excluded patients without enough pre-treatment blood samples to ensure the validity of the study. Our findings are not conclusive, but we believe our work firstly showed the potential of these biomarkers as a diagnostic aid for PTB, thus it is worthy to report.

- What were the biomarker(s) levels pre-treatment? Does serum Periostin, MMP-1 and MMP-9 levels changed post anti-tuberculosis treatment?

Thank you for your comments. As we explained in the Materials and Methods section, all sera used in the study were collected before TB treatment. We were also interested in the kinetics of these biomarkers during the course of TB treatment. In fact, we compared serum periostin levels between pre- (N=16) and post-TB (N=16) treatment, although no significant difference was found. We totally agree that the data regarding kinetics of these biomarkers deepen our understanding. However, this was not the primary purpose of the study, and serum samples collected after TB treatment were stored in only a subset of patients. This issue will be clarified in future studies.

- It is my understanding that the BD CBA Th1/Th2/Th17 used in this study can also determine IL-2,-6,-17A and TNFa quantities. Postn-/- mice increase TNFa production (Carcinogenesis 2019; 40 (1): 102); since TNFa is a prominent cytokine with anti-TB activity, it will be interesting and important to assess modulation of these cytokines in relation to periostin in PTB and non-PTB conditions.

Thank you for your comments. We actually measured IL-2, IL-6, IL-17A, and TNF-alpha levels with the BD CBA Th1/Th2/Th17 kit, although there were no significant differences in the levels of these cytokines between the PTB and non-PTB groups. Because these cytokines were not our focus, we did not include the corresponding data in our manuscript. We also appreciate your comment regarding the relation between TNF-alpha and periostin. From the viewpoint of basic immunology, it may be important to further evaluate the association between these biomarkers. However, the purpose of this study was to investigate potential biomarkers to help PTB diagnosis in a clinical setting, and therefore we did not perform association analysis among biomarkers.

- The claim made by authors to distinguish PTB and non-PTB patients using classification tree method does not corroborate with the results (Figure 4). Firstly, Figure Legend has IFNg included, but neither the Figure 4, nor the text has any mention of IFNg in this analysis. Line 211 explains, all patients (infiltration <5) with MMP-1 <0.01 ng/ml in the non-PTB group had periostin level >118.8 ng/ml, when in fact 7 (46.7%) had > 118.8 and 8 (53.3%) had <118.8 ng/ml periostin level. If periostin is not significantly different in PTB and non-PTB groups, what was the purpose to include it is classification tree and how is it helpful to discriminate the patient groups?

As we mentioned in the Materials and Methods section (lines 132-135), four proteins, MMP-1, MMP-9, IFN-gamma, and periostin were included in the classification tree analysis, although IFN-gamma was not selected as a marker for PTB diagnosis. The classification method automatically chooses appropriate markers and their cut-off values to divide the patients into two groups (in this study, PTB and non-PTB) according to its algorithm, which is totally different from ROC. The rationale of the classification tree in the study was also explained in the Abstract (lines 36-37) and Discussion (lines 286-289) sections.

We really appreciate your comments regarding the description in line 211 in the previous version. The explanation of box C in Figure 4 was incorrect in the previous version. We corrected this sentence (line 215) in the revised manuscript.

- Similarly, Infiltration>5 group, nearly equal numbers of PTB patients have MMP-9 <3.009 (N=14) and >3.009 (N=15).What is the relevance of these values.

Thank you for your comments. The important point is that non-PTB patients were not included in Box D in Figure 4.

- I highly recommend along with Figure 5 (This is actually a Table) authors include a summary diagram (diagnostic algorithm) that is easy to follow and explains criteria / variables / cut-off values proposed by the authors to discriminate PTB and non-PTB groups.

Thank you for your comments. We already explained the interpretation of the classification tree results in the Discussion section (lines 292-296). If a pneumonia patient with limited infiltration is dropped into “Box C” in Figure 4, the patient is likely not to have PTB (95%CI 0.0-41.0). On the other hand, if a pneumonia patient with extensive infiltration is dropped into “Box D” in Figure 4, the patient is likely to have PTB (95%CI 76.8-100.0).

Reviewer #2: In this study, the authors analyzed the serum levels of IFN-γ, MMP-1, MMP-9 and periostin in tuberculous pneumonia and non-tuberculous pneumonia patients. They also developed a new classification tree by using MMP-1, MMP-9 and periostin level to diagnose tuberculous pneumonia and non-tuberculous pneumonia patients. Their results are of interest. However, there are several major concerns that need to be addressed.

We really appreciate your reading of our manuscript and your comments and suggestions. We revised our manuscript following your comments. It would be most appreciated if you could give us your feedback to our response.

1. MMP-1 and MMP-9 are well known factors involved in many diseases. They are not specific markers for tuberculosis. The sample size in this study is small (40 vs. 28) and patients in each group are with a wide range of ages and diseases. I think it will be more appropriate to perform a more specific analysis. E.g. compare PTD vs non-PTD when both group patients have cardiovascular disorder or bilateral disease (with similar condition)…

Thank you for your comments. As you suggested, we understand that MMP-1 and MMP-9 are not specific markers for PTB, and several conditions might affect these levels in the serum. Following your suggestion, we compared serum IFN-� and MMP-1 levels (these two were evaluated because these were significantly higher in PTB compared to non-PTB) by gender and underlying diseases. No significant differences were observed in serum IFN-γ levels by gender or underlying diseases. In contrast, serum MMP-1 levels in patients with malignancy were significantly higher than in those without malignancy (Figure S1). Therefore, we performed multivariate analysis and showed that only PTB was associated with elevated serum MMP-1 levels (Table S2). We think the more specific analysis you suggested is not appropriate in this case because the number of patients becomes smaller and the statistic power weaker.

2. The authors need to clarify the expression profile of MMP-1, MMP-9 and periostin over the infection time. Is there any dynamics? I am not clear if they compared the samples from the same time after infection.

Thank you for your comments. We understand that the duration between the time of infection (or onset of symptoms) and serum collection is important, although it is difficult to determine the time of infection (or onset of symptoms) because of the nature of TB. In terms of kinetics of these proteins, we compared serum periostin levels between pre- (N=16) and post- (N=16) TB treatment, although no significant difference was observed. We totally agree that the data regarding kinetics of these biomarkers deepen our understanding. However, this was not the primary purpose of the study, and serum samples collected after TB treatment were stored in only a subset of patients. This issue will be clarified in future studies.

3. I hope they can provide more explanation on the association between MMP-9 level and pneumonia patients with limited infiltration; also for the association between MMP-1, periostin and pneumonia patients with extensive infiltration.

Thank you for your comments. We assume this comment is related to Figure 4. The classification tree method automatically chooses appropriate markers and their cut-off values to divide patients into two groups (in this study, PTB and non-PTB) according to its algorithm. Therefore, the interpretation is sometimes difficult. However, we added our interpretation of the results in Figure 4 to the Discussion section (lines 298-305).

4. I feel a little bit hard to read this manuscript due to the language. I suggest they have someone to correct the grammar and typos.

We asked Editage (www.editage.com) for English language editing. We added this information to the Acknowledgements section.

Attachment

Submitted filename: Response to Reviewers.docx

Decision Letter 1

Frederick Quinn

26 Dec 2019

Diagnostic performance of serum interferon gamma, matrix metalloproteinases, and periostin measurements for pulmonary tuberculosis in Japanese patients with pneumonia

PONE-D-19-19256R1

Dear Dr. Kinjo,

We are pleased to inform you that your manuscript has been judged scientifically suitable for publication and will be formally accepted for publication once it complies with all outstanding technical requirements.

Within one week, you will receive an e-mail containing information on the amendments required prior to publication. When all required modifications have been addressed, you will receive a formal acceptance letter and your manuscript will proceed to our production department and be scheduled for publication.

Shortly after the formal acceptance letter is sent, an invoice for payment will follow. To ensure an efficient production and billing process, please log into Editorial Manager at https://www.editorialmanager.com/pone/, click the "Update My Information" link at the top of the page, and update your user information. If you have any billing related questions, please contact our Author Billing department directly at authorbilling@plos.org.

If your institution or institutions have a press office, please notify them about your upcoming paper to enable them to help maximize its impact. If they will be preparing press materials for this manuscript, you must inform our press team as soon as possible and no later than 48 hours after receiving the formal acceptance. Your manuscript will remain under strict press embargo until 2 pm Eastern Time on the date of publication. For more information, please contact onepress@plos.org.

With kind regards,

Frederick Quinn

Academic Editor

PLOS ONE

Additional Editor Comments (optional):

Reviewers' comments:

Reviewer's Responses to Questions

Comments to the Author

1. If the authors have adequately addressed your comments raised in a previous round of review and you feel that this manuscript is now acceptable for publication, you may indicate that here to bypass the “Comments to the Author” section, enter your conflict of interest statement in the “Confidential to Editor” section, and submit your "Accept" recommendation.

Reviewer #1: All comments have been addressed

Reviewer #2: All comments have been addressed

**********

2. Is the manuscript technically sound, and do the data support the conclusions?

The manuscript must describe a technically sound piece of scientific research with data that supports the conclusions. Experiments must have been conducted rigorously, with appropriate controls, replication, and sample sizes. The conclusions must be drawn appropriately based on the data presented.

Reviewer #1: Partly

Reviewer #2: Yes

**********

3. Has the statistical analysis been performed appropriately and rigorously?

Reviewer #1: Yes

Reviewer #2: Yes

**********

4. Have the authors made all data underlying the findings in their manuscript fully available?

The PLOS Data policy requires authors to make all data underlying the findings described in their manuscript fully available without restriction, with rare exception (please refer to the Data Availability Statement in the manuscript PDF file). The data should be provided as part of the manuscript or its supporting information, or deposited to a public repository. For example, in addition to summary statistics, the data points behind means, medians and variance measures should be available. If there are restrictions on publicly sharing data—e.g. participant privacy or use of data from a third party—those must be specified.

Reviewer #1: Yes

Reviewer #2: Yes

**********

5. Is the manuscript presented in an intelligible fashion and written in standard English?

PLOS ONE does not copyedit accepted manuscripts, so the language in submitted articles must be clear, correct, and unambiguous. Any typographical or grammatical errors should be corrected at revision, so please note any specific errors here.

Reviewer #1: Yes

Reviewer #2: Yes

**********

6. Review Comments to the Author

Please use the space provided to explain your answers to the questions above. You may also include additional comments for the author, including concerns about dual publication, research ethics, or publication ethics. (Please upload your review as an attachment if it exceeds 20,000 characters)

Reviewer #1: (No Response)

Reviewer #2: (No Response)

**********

7. PLOS authors have the option to publish the peer review history of their article (what does this mean?). If published, this will include your full peer review and any attached files.

If you choose “no”, your identity will remain anonymous but your review may still be made public.

Do you want your identity to be public for this peer review? For information about this choice, including consent withdrawal, please see our Privacy Policy.

Reviewer #1: No

Reviewer #2: No

Acceptance letter

Frederick Quinn

30 Dec 2019

PONE-D-19-19256R1

Diagnostic performance of serum interferon gamma, matrix metalloproteinases, and periostin measurements for pulmonary tuberculosis in Japanese patients with pneumonia

Dear Dr. Kinjo:

I am pleased to inform you that your manuscript has been deemed suitable for publication in PLOS ONE. Congratulations! Your manuscript is now with our production department.

If your institution or institutions have a press office, please notify them about your upcoming paper at this point, to enable them to help maximize its impact. If they will be preparing press materials for this manuscript, please inform our press team within the next 48 hours. Your manuscript will remain under strict press embargo until 2 pm Eastern Time on the date of publication. For more information please contact onepress@plos.org.

For any other questions or concerns, please email plosone@plos.org.

Thank you for submitting your work to PLOS ONE.

With kind regards,

PLOS ONE Editorial Office Staff

on behalf of

Dr. Frederick Quinn

Academic Editor

PLOS ONE

Associated Data

    This section collects any data citations, data availability statements, or supplementary materials included in this article.

    Supplementary Materials

    S1 Table. Causative bacteria in patients with non-tuberculous pneumonia.

    (DOC)

    S2 Table. Factors associated with elevated MMP-1 levels by multivariate analysis.

    (DOC)

    S1 Fig. Comparison of serum MMP-1 levels between patients with and without malignancy.

    (TIFF)

    S1 File. Raw data.

    (XLSX)

    Attachment

    Submitted filename: Response to Reviewers.docx

    Data Availability Statement

    All relevant data are within the manuscript and its Supporting Information files.


    Articles from PLoS ONE are provided here courtesy of PLOS

    RESOURCES