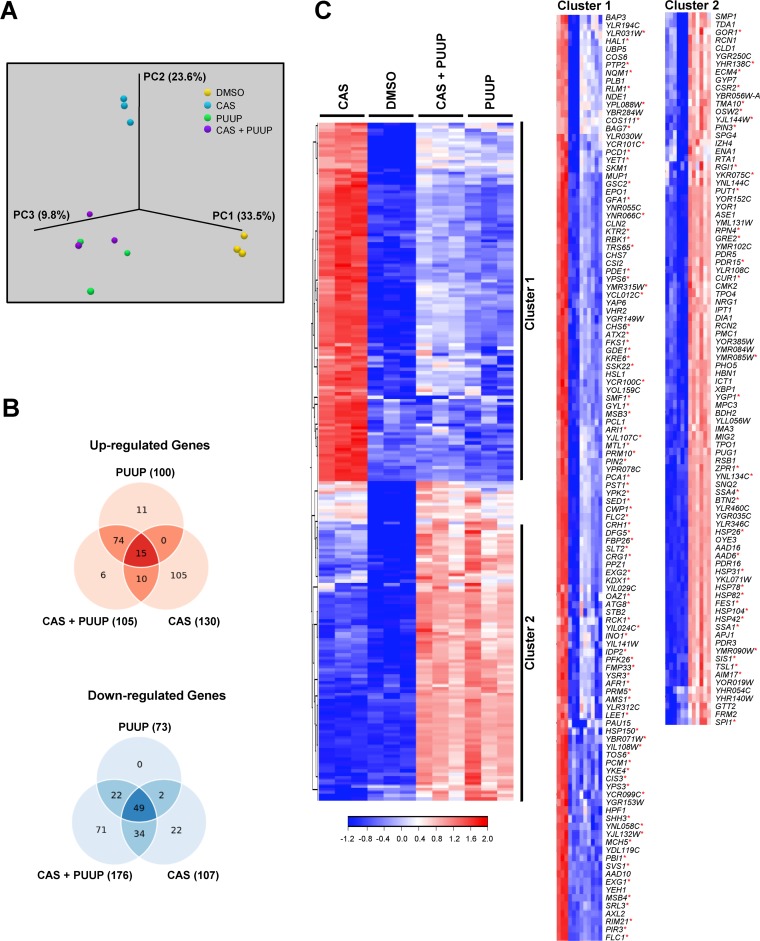
FIG 2.
RNA-seq analysis of yeast cells treated with CAS, PUUP, or CAS+PUUP. (A) The experimental variation between RNA-seq experiments performed on 3 biological replicate samples was analyzed with a PCA plot. (B) Venn diagrams comparing the number of up- or downregulated genes that significantly responded (≥2-fold induction, P < 0.01) to the 3 treatments. (C) Hierarchical cluster analysis was performed on 221 genes that displayed a ≥2-fold induction (P < 0.01) in response to at least one of the three treatments compared to the DMSO control. Clustering was performed on normalized FPKM values using Euclidean distance and complete linkage settings. Clusters 1 and 2 are expanded on the right to display the names of genes within each cluster. Red asterisks indicate genes identified in the YEASTRACT database that are known to be induced by the transcription factors Rlm1 (CWI pathway regulator) and Hsf1 (heat shock response regulator) in clusters 1 and 2, respectively.

