Introductory
Mechanisms to control cell division are essential for cell proliferation and survival 1. Bacterial cell growth and division require the coordinated activity of peptidoglycan synthases and hydrolytic enzymes 2–4 to maintain mechanical integrity of the cell wall 5. Recent studies suggest that cell separation is governed by mechanical forces 6,7. How mechanical forces interact with molecular mechanisms to control bacterial cell division in space and time is poorly understood. Here, we use a combination of atomic force microscope (AFM) imaging, nanomechanical mapping, and nanomanipulation to show that enzymatic activity and mechanical forces serve overlapping and essential roles in mycobacterial cell division. We find that mechanical stress gradually accumulates in the cell wall concentrated at the future division site, culminating in rapid (millisecond) cleavage of nascent sibling cells. Inhibiting cell wall hydrolysis delays cleavage; conversely, locally increasing cell wall stress causes instantaneous and premature cleavage. Cells deficient in peptidoglycan hydrolytic activity fail to locally decrease their cell wall strength and undergo natural cleavage, instead forming chains of non-growing cells. Cleavage of these cells can be mechanically induced by local application of stress with AFM. These findings establish a direct link between actively controlled molecular mechanisms and passively controlled mechanical forces in bacterial cell division.
Marked morphological changes occur when a microbial cell divides to form two daughter cells 1. In Escherichia coli this process involves gradual constriction of the cell envelope and structural remodelling of the new cell poles 2–4. In contrast, other microbial species build a septum without gradual constriction of the cell envelope 8,9. Instead, the cell wall connecting the two daughter cells remains intact and separation of daughter cells occurs only after completion of the septum, with division scars appearing next to the new poles 10,11. The final stages of cell separation involve enzymatic digestion of peptidoglycan, which is thought to be the main tensile stress bearing component of the cell wall 12. Spatial and temporal control of peptidoglycan hydrolytic enzymes is indispensable in order to maintain structural integrity of the cell wall 13.
In the past decade the atomic force microscope (AFM) has become a powerful tool for structural and mechanical studies in microbiology, with wide-ranging applications covering multiple magnitudes of length-scales (from single molecules to biofilms) and time-scales (from milliseconds to days) 14. Force spectroscopy experiments have shed light on interaction forces between bacteria and specific biomolecules or surfaces of different chemistries 15,16, while imaging and mechanical mapping of cell wall components and live cells 17–19 have provided detailed insights into the structural architecture of peptidoglycan as well as growth and division mechanisms 20–23. Here, we use AFM to elucidate the complementary roles of peptidoglycan hydrolytic activity and mechanical mechanisms on cell division in Mycobacterium smegmatis, a relative of the pathogen that causes tuberculosis in humans.
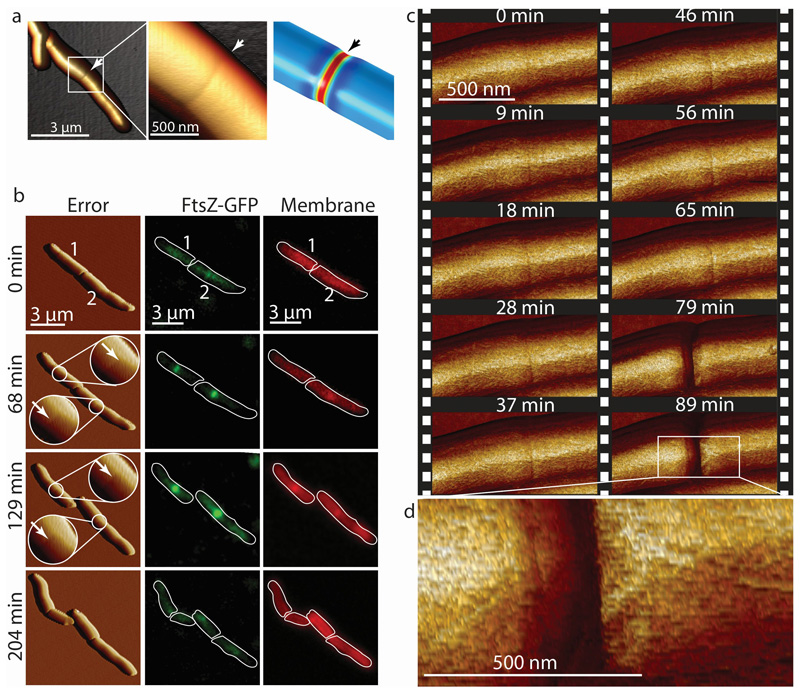
The earliest morphological feature of a nascent division event detected by AFM imaging is the “pre-cleavage furrow” (PCF), a constriction of ~50 nm width and 5-10 nm depth circumscribing the cell’s short axis 20 (Figure 1a). The PCF appears 52±9 minutes (n=15) before cell cleavage and co-localizes with the FtsZ contractile ring. Subsequently, the PCF is the site of septum formation (Figure 1b) and localization of Wag31-GFP, a marker of cytokinesis 24 (Extended data Figure S1). We investigated the nature of the PCF by performing finite element analysis on a simplified model of the bacterial cell wall with a double septum. When this structure is under increased turgor pressure, a PCF-like depression occurs between the two septal walls (Figure 1a). However, other causes for the PCF are conceivable, such as pre-tension in the septum.
Figure 1. The pre-cleavage furrow (PCF) is a nanoscale cell-surface feature that marks the future division site in M. smegmatis.
(a) 3D AFM image and COMSOL finite element model of the deformation of a cell by the PCF. (b) Correlated AFM and fluorescence microscope imaging. The PCF co-localizes with the FtsZ-GFP (green) ring (n=12) and the nascent septum stained with the membrane stain FM4-64 (red) at the future division site (n=5). White arrows indicate the PCFs. The sequence shows two cells undergoing division, with the lower cell being slightly ahead (membrane at septum visible at 68 minutes) of the upper cell (membrane visible at septum at 129 minutes). (c) Time lapse AFM images of the appearance of the PCF and subsequent division. The PCF appears on the bacterial surface on average one hour before cleavage (n=15). In the example shown, cleavage occurs between the images acquired at 65 and 79 minutes. Stiffness channel is shown. (d) Zoom-in image of the daughter cells’ newly formed poles after cleavage. New cell poles and division scars (n>15) on the cell wall envelope are separated by about 200 nm.
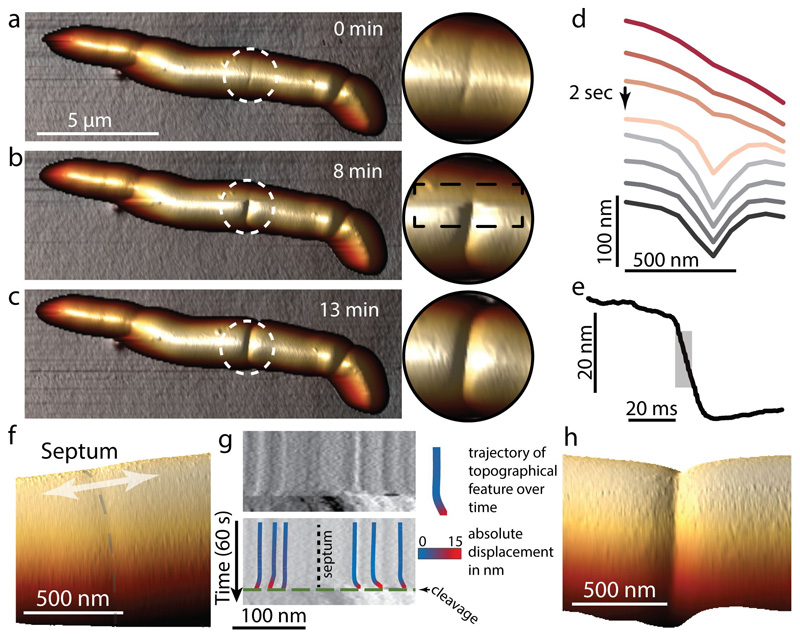
At the time of cell cleavage, hemispherical poles flanked by division scars appear abruptly where the PCF was formerly located (Figure 1c-d and Extended data Movie S1). This morphological transition (Figure 2a-d and Extended data Figure S2) occurs within a few milliseconds (Figure 2e, Extended data Figure S3 and Extended data Figure S4). Rather than gradual enzymatic reshaping of the cell wall, millisecond cell cleavage and elastic deformation of the septal walls to hemispherical poles, inflated by turgor pressure, indicate a circumferential mechanical fracture along the PCF.
Figure 2. Daughter cell cleavage occurs with millisecond kinetics by rupture around the PCF.
(a-c) Consecutive 3D rendered AFM images of cleavage (b) and zoom-ins of the cleavage site. The AFM slow-axis scan direction in (b) is from top to bottom, revealing the transition from the PCF to cleavage. (d) Line sections through the AFM height data around the PCF during cleavage. In the example shown, the PCF progressed to the cleaved state within one scan line (2 seconds, arrow). (e) Constant point measurement of the height at the PCF with a repetition rate of 1 kHz reveals an abrupt drop in height, with 50% of the total decrease (grey area) occurring within 7 milliseconds. In all, similar rapid divisions have been observed >22 times. (f-h) Tracking topographical features (fiducial markers) on either side of the septum prior to cell cleavage reveals material stretching. (f) Zoom-in on center part of a cell with a septum (grey dashed line) prior to cell cleavage. (g) Kymograph of a continuous scan (1 line per second) over time perpendicular across the septum (arrow in (f)) revealing nanometer-sized movement of nanoscale structures on the cell surface (top). Immediately prior to cleavage (green dashed line (bottom)), the material stretches and surface features move apart in opposite directions on either side of the septum (black dotted line). Color-coding of the trajectory of surface features indicates the total lateral displacement away from the septum. (h) 3D height representation of a representative newly cleaved cell (same area as in (f)). See also Extended data Figure S5.
To elucidate the fracture mechanism of cell cleavage, we used nanoscale topographical features on either side of the septum as fiducial markers to monitor local cell wall deformations while continuously scanning the same line across the PCF (Figure 2f-h and Extended data Figure S5). These measurements revealed that just before cleavage occurs, features on opposite sides of the PCF move apart by more than 10 nm, presumably due to stress exerted along the cell’s longitudinal axis.
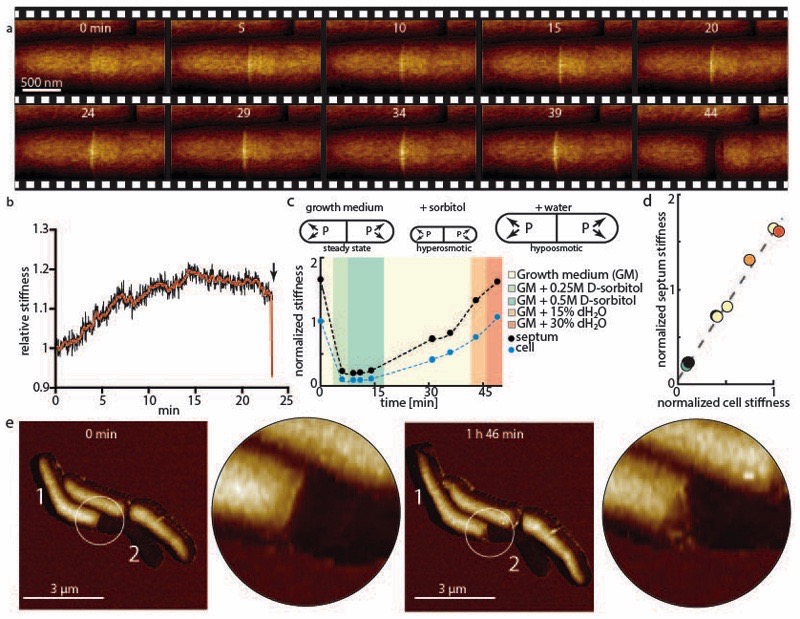
We hypothesized that to initiate a mechanical fracture the ultimate material strength and/or tensile stress should be altered locally. As a proxy to quantify the in-plane tensile stress at the PCF we measured the out-of-plane stiffness, taking advantage of the fact that with increasing in-plane tensile stress a membrane becomes stiffer against out-of-plane deformation by AFM in quantitative nanomechanical mode (QNM). In this mode, force-distance curves are recorded by sinusoidal oscillations of the cantilever at kHz rates in the z-direction 25. QNM data can serve only as an indirect and qualitative proxy for cell wall tension, because QNM measures the stiffness of the sample rather than tension per se. Factors that contribute to the measured stiffness are the compound Young’s modulus of the cell wall, the cell wall stress, and the turgor pressure. These factors are thought to affect different parts of the force curve 22 (see Extended data Figure S6). For the small indentation depths used in QNM, the compound Young’s modulus and the cell wall stress dominate the overall stiffness measurements. From the first appearance of the PCF (0 minutes in Figure 3a and Extended data Movie S2) until cleavage (44 minutes), we observed a significant and steady increase of the stiffness at the surface area surrounding the PCF, reaching a maximum about 10 minutes prior to cleavage followed by a slight decrease during the final phase before cleavage (Figure 3b, see also Extended data Figure S7a-d). We hypothesize that the progressive stiffness increase is the result of increasing tensile stress at the PCF, while the measured stiffness decrease during the final phase before cleavage could result from the action of peptidoglycan hydrolytic enzymes 23.
Figure 3. Turgor pressure drives cell cleavage through stress concentration at the PCF.
(a) Time sequence of measured stiffness map of the cell surface from appearance of the PCF until cleavage (n=22). (b) Changes in the local stiffness at the PCF leading up to cell cleavage (x-axis, time in minutes; y-axis, PCF stiffness normalized to bulk stiffness of cell sidewalls). After an initial gradual increase of the stiffness at the septum, a small decrease occurs before cleavage (red line, average over 20 data points). (c) Measurement of apparent stiffness on top of the septum (black lines) and on top of the cell bodies (blue lines, average of the two nascent sibling cells) as turgor pressure is modulated by hyper-osmotic (green shading) and hypo-osmotic (orange shading) media. Measured stiffness on the PCF and cell bodies is affected by the turgor pressure to a different extent. Measured stiffness values on the cell and on the PCF are normalized to initial stiffness of the cell in normal growth medium. (d) When varying medium osmolarity, the measured PCF stiffness is linearly dependent with the measured cell stiffness with a slope of ~1.5 (r2=0.991), suggesting a stress concentration of 50% on the PCF. Measured stiffness values on the cell and on the septum are normalized to the initial stiffness of the cell in normal growth medium. (e) If one nascent sibling cell is deflated after cytokinesis but before cleavage (0 minutes), rapid cleavage is replaced by gradual shedding of the deflated sibling cell, indicating that rapid cleavage requires turgor pressure in both sibling cells.
To assess the contribution of the turgor pressure to the cell wall tensile stress 19,26, as opposed to other mechanical effects due to septum formation, we quantified the local stiffness at the PCF and the nascent sibling cells as we modulated the turgor pressure. Following a hyperosmotic shock by addition of D-sorbitol (0.25 M or 0.5 M) to the medium, the measured stiffness at the PCF and the sister cells decreased to ~20% of its initial values (Figure 3c). Conversely, the stiffness of the septum and the cells both increased upon hypoosmotic shocks by addition of water (15% and 30%). These measurements revealed a linear relationship between the average stiffness of the sibling cells and the stiffness at the PCF with a slope of ~1.5 (Figure 3d). From these data we conclude that the measured increase in stiffness is indeed the result of the tensile stress in the cell wall exerted by the turgor pressure, and that turgor-induced tensile stress is disproportionately concentrated at the PCF compared to the stress on the sidewalls of the sibling cells. These results suggest that an increase in tensile stress, in conjunction with a decrease of mechanical strength, determines when and where the cell wall integrity catastrophically fails, resulting in abrupt cleavage.
We further explored how turgor pressure affects cell cleavage by piercing one nascent sibling cell after cytokinesis but before cleavage using a sharp AFM cantilever tip (Figure 3e and Extended data Figure S9). Instead of a rapid cleavage event, the intact sibling (cell 1) gradually separated from its sibling as it shed the sacculus of the deflated sibling (cell 2) over the course of several hours (see also Extended data Movie S3). These results suggest that turgor pressure is necessary to provide the energy to drive rapid cell cleavage.
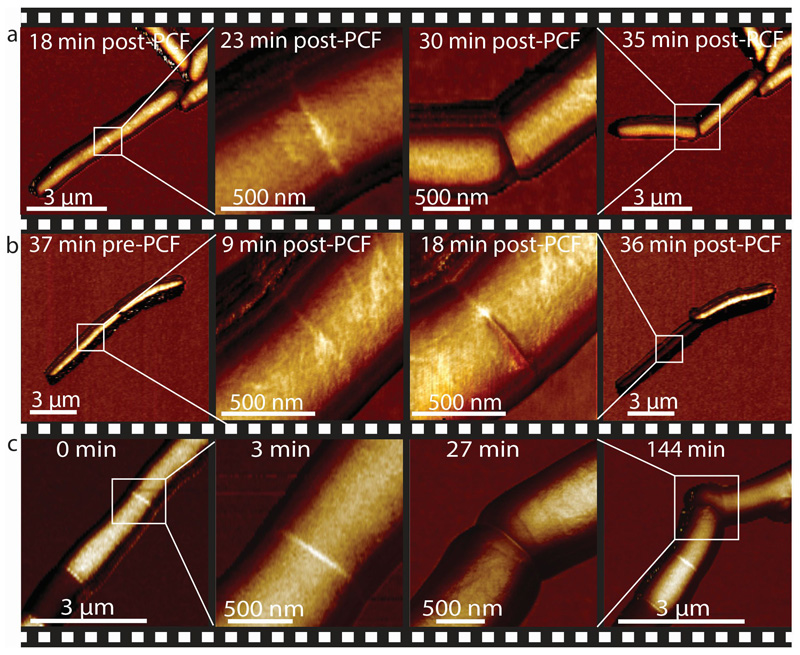
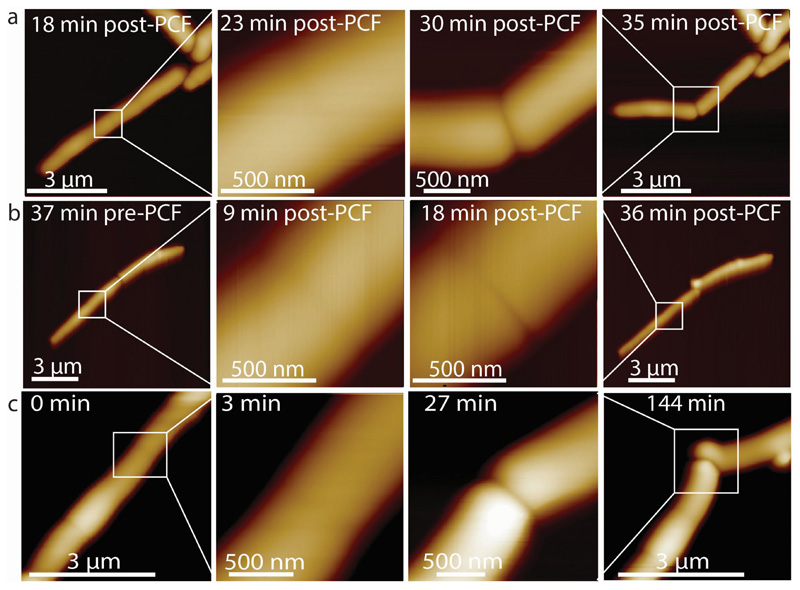
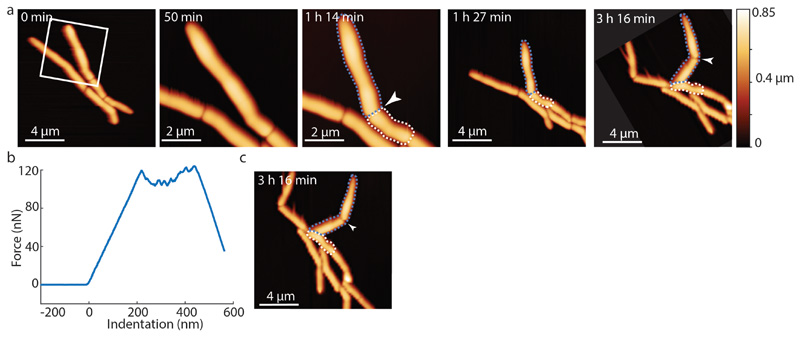
Based on these results, we hypothesize that cell cleavage occurs when tensile stress, driven by turgor pressure, exceeds the ultimate material strength of the cell wall peptidoglycan. In this view, artificially increasing tensile stress should cause premature cell cleavage and, conversely, preventing a decrease in material strength should delay the timing of cell cleavage. We tested this hypothesis by applying mechanical load on the PCF using the AFM cantilever. In cells undergoing normal cell division, the interval between PCF formation and cell cleavage lasts about one hour on average. We found that applying load on the PCF triggered immediate cell cleavage and formation of two viable, growing daughter cells up to 30 minutes earlier than normal (Figure 4a, Extended data Figure S11, Extended data Figure S12a and Extended data Figure S13). Forced cleavage at earlier time points, often resulted in partial cleavage and formation of non-viable daughter cells (Figure 4b and Extended data Figure S12b).
Figure 4. AFM-applied local stress on the PCF can substitute for an essential cell division enzyme (RipA).
(a) AFM stiffness images were recorded at low and high resolution at 18 and 23 minutes after first appearance of the PCF, respectively. Application of a force on the PCF with the AFM cantilever at 25 minutes (force curve, see Extended data Figure S12a) triggers premature cell cleavage (n=11). The forcibly cleaved daughter cells survive and initiate growth from the newly formed cell poles (30 and 35 minutes; see also Extended data Figure S13). (b) Same experimental procedure as in (a) but the load was applied earlier, 18 minutes after first appearance of the PCF. Partial cleavage occurs (18 minutes; force curve, see Extended data Figure S12b) and both cells subsequently deflate (image recorded at 36 minutes) (n=5). (c) Cleavage of RipA-depleted cells can be induced by repeatedly scanning the same line over the PCF at elevated force, resulting in a sudden drop in height (27 minutes; see Extended data Figure S12c). The previously non-growing cells within the chain initiate growth from the newly liberated cell poles following forced cleavage (144 minutes) (n=4). See also Extended data Figure S10 for corresponding height data.
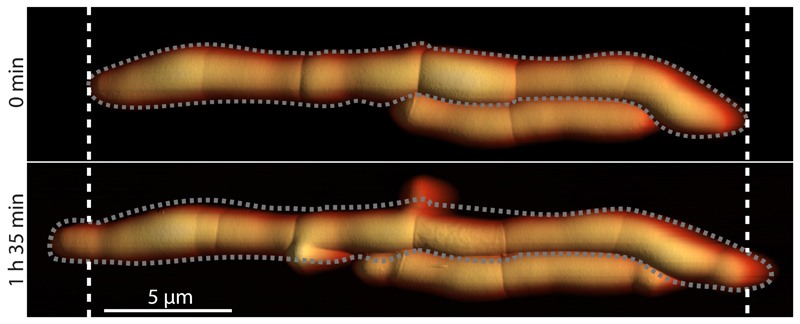
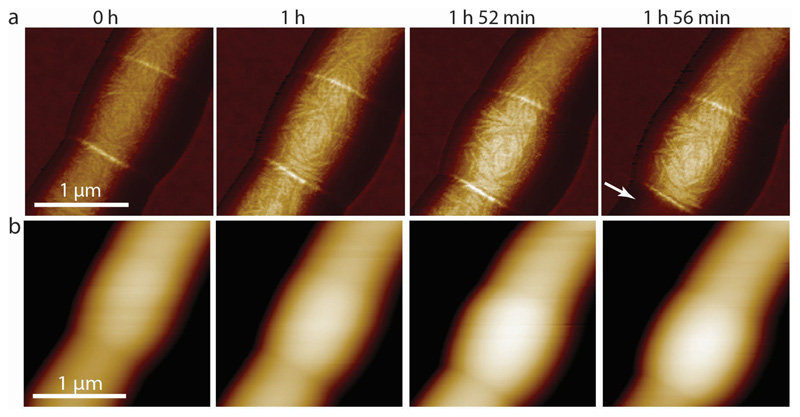
The material strength of the cell wall is modulated by enzymes that add or remove crosslinks in the cell wall peptidoglycan 27,28. In mycobacteria, cells depleted of the peptidoglycan hydrolase RipA 29, which localizes to the septum and cell poles 30, appear to septate normally but fail to undergo cleavage 31. This defect results in the formation of long chains of attached cells in which only the two outermost cell poles at the ends of a chain continue to elongate, while cells interior to the chain, which lack free cell poles, cease growing after septation (Extended data Figure S14). Loss of RipA peptidoglycan hydrolase activity likely prevents the decrease of the cell wall strength at the septum observed in wild-type cells just prior to division. Indeed, we observed that increased tensile stress in the sidewalls of cells within RipA-depleted chains (see Extended data Figure S15) occasionally results in cell lysis (Extended data Figure S16) but not cell cleavage at the septum. In contrast, local application of force on the PCF by the AFM cantilever was sufficient to trigger rapid cleavage of RipA-depleted cell chains (Figure 4c and Extended data Figure S12c), although the force required was significantly higher (beyond the linear regime of our force measurements) compared to wild-type cells. We conclude that RipA-mediated local decrease of material strength of the cell wall at the septum is essential to allow cell cleavage driven by turgor pressure, yet cleavage can still occur if compensatory local stresses are applied externally. These results are consistent with our hypothesis that the timing of cell cleavage is determined by the balance of cell wall tensile stress and the ultimate material strength of the cell wall at the nascent division site.
We observed that the newly free cell poles generated by force-induced cleavage of chained RipA-depleted cells are able to initiate and maintain growth once the sibling cells separate (Figure 4c). This was true even of cells located in the center of long chains, which had persisted in a non-growing but evidently viable state for many hours. These results demonstrate that cleavage and physical separation of sibling cells are essential for initiation of new-pole growth, suggesting the existence of an unknown mechanism of contact-dependent growth inhibition.
Millisecond bacterial cell division, visualized as abrupt spatial reorientation of newborn daughter cells, has been observed by fast optical imaging of Staphylococcus aureus 6. In their pioneering study, Zhou et al. 6 linked division of S. aureus to a fracture process and postulated that it might result from stress accumulation and mechanical failure of the cell wall, thereby laying the groundwork for viewing bacterial cell division from the perspective of physical forces 32. Their observations are reminiscent of the “V-snapping” model of cell division in M. smegmatis 33; more recently, additional bacterial species have been identified that also undergo abrupt spatial reorientation during cell division 7 (see Figure 4a). This phenomenon (V-snapping) is consistent with a model in which rapid cleavage of sibling cells is due to progressive circumferential rupture of the connecting cell wall starting from the weakest section around the PCF. As the crack propagates from one side to the other (see Figure 4b), a bending moment occurs that will spatially displace the cells. The amount of V-snapping hence depends on the bending moment and the friction forces experienced by the bacterium, which are higher if the cells are adhered to a surface than when suspended in solution. These similarities suggest that mechanical forces might play an important role in evolutionarily diverse bacterial species during the final stage of cell division (cleavage of sibling cells).
Using time-lapse AFM to study cell division in M. smegmatis, we observed progressive stiffening of the PCF over time, dependence of PCF stiffness on the internal turgor pressure, stress concentration at the PCF, and rapid (millisecond) physical cleavage of sibling cells. AFM force curves and QNM measurements have recently emerged as powerful tools for characterizing the relative stiffness of biological samples 34. It is important to note, however, that the measured values for stiffness are very sensitive to factors such as cantilever tip geometry, sample topography, and other imaging parameters. Care should therefore be taken in the interpretation to evaluate relative rather than absolute values within a time series.
Our experimental demonstration that the PCF undergoes progressive stiffening prior to rapid cell cleavage, and that applied mechanical forces can induce premature cleavage, further strengthens the hypothesis that localized stress accumulation and mechanical fracture play a central role in mycobacterial cell division. The applied stress, however, is only one of the factors in fracture mechanics; the strength of the material is another important factor determining when and where fracture occurs. Thus, modulation of the ultimate tensile strength of the peptidoglycan by peptidoglycan synthesizing and hydrolytic enzymes is equally important to ensure that cell cleavage occurs at the appropriate time and place.
We propose a model in which increasing tensile stress on the PCF (due to stress concentration) and decreasing material strength at the PCF (due to the activity of the RipA peptidoglycan hydrolase) together create a positive feedback loop that culminates in rapid cell cleavage. Since molecular bonds under tensile stress require a lower activation energy for hydrolysis and are less likely to reform once broken 12, tensile stress around the PCF will locally accelerate the hydrolysis of peptidoglycan by RipA. As more chemical bonds are broken, the mechanical load on each remaining bond will increase, further facilitating hydrolysis. Following a similar reasoning, the vertical septal walls would, before cleavage, experience lower tensile stress compared to the peptidoglycan at the PCF. This, in turn, could act as a mechanical mechanism to protect the pre-cleavage septal walls from hydrolysis by RipA. The same mechanism could explain the observation that chained RipA-depleted cells do not grow, yet retain the ability to initiate growth if cleavage is induced. After cleavage, the previously flat septal wall is rapidly inflated by turgor pressure to form two hemispherical poles that experience the same longitudinal tension as the rest of the cell wall 12, similar to observations in fission yeast 35. Since hydrolysis of existing peptidoglycan bonds is necessary for insertion of new peptidoglycan chains, this might explain why cleavage is essential for initiation of new-pole growth. We conclude that localization of enzymes involved in cell wall biogenesis to subpolar growth zones determines where growth occurs 36, while the balance between cell wall stress and material strength determines when growth occurs. The overlapping and essential contributions of RipA hydrolytic activity and mechanical forces in mycobacterial cell division illustrate the general importance of studying molecular mechanisms and physical factors in conjunction rather than either in isolation.
Materials and Methods
Bacterial culture conditions
Mycobacterium smegmatis mc2155 (wild-type) and derivative strains were grown in Middlebrook 7H9 liquid medium (Difco) supplemented with 0.5% albumin, 0.2% glucose, 0.085% NaCl, 0.5% glycerol, and 0.05% Tween-80. Cultures were grown at 37°C to an optical density at 600 nm (OD600) of ∼ 0.5, corresponding to mid-exponential phase. Aliquots were stored in 15% glycerol at –80°C and thawed at room temperature before use; individual aliquots were used once and discarded.
M. smegmatis RipA depletion strain
The RipA depletion strain was kindly provided by Eric Rubin and grown as described by Hett et al. 31. Briefly, the strain was initially grown in growth medium supplemented with hygromycin B (50 µg/ml), kanamycin (30 µg/ml), and anhydrotetracycline (50 ng/ml) for up to 5 days. The culture was then washed with PBS and grown in fresh 7H9 medium lacking anhydrotetracycline to deplete RipA expression.
Coverslips for AFM imaging
For details, refer to Eskandarian et al.15. In short, polydimethylsiloxane (PDMS) (Sylgard 184, Dow Corning) was mixed in a ratio of 15:1 (elastomer : curing agent) and the coverslip (VWR) was spin-coated at 8,000 rpm (SUSS MicroTec LabSpin6) for 30 seconds on a 22 mm glass and baked at 80°C for 10 minutes before use.
Attachment of bacteria on coverslips
An aliquot from an exponential-phase culture of M. smegmatis was pipetted onto a PDMS-coated glass coverslip, mounted in a custom-made coverslip holder with a built-in heating unit 37, and incubated at 37°C without agitation for ~15 minutes to allow attachment. Unattached bacteria were removed by rinsing the coverslip surface with 7H9 growth medium before imaging. The samples were maintained at 37°C in 7H9 liquid medium heated by a custom-made coverslip heating holder 37 controlled by a TC2-80-150 temperature controller (Bioscience Tools) during imaging. For details, refer to Eskandarian et al. 20.
AFM imaging
AFM images were recorded using a Fast Scan head (Bruker) at 0.5 Hz line rate using ScanAsyst Fluid cantilevers (Bruker) with a nominal spring constant of 0.7 N m-1 in PeakForce quantitative nanomechanical mode (QNM) at an oscillation rate of 1 kHz and a force setpoint < 2 nN. Channels recorded include height sensor, peak force error, and DMT modulus. The abrupt height change during cell cleavage was measured by imaging in peak force tapping node at the same spot (0 nm scan size) on the PCF and data were recorded at a rate of 1 kHz. AFM imaging of stiffness at the PCF was done by repeatedly scanning the same line across the PCF at 1 line per second, at a slightly elevated force setpoint (5 nN). The highest stiffness value from each scan line was plotted over time. Before force curves on the PCF were recorded, a small area on the PCF was scanned to determine its center. To force cell cleavage in RipA-depleted cells, the line along the septum was scanned repeatedly and the force setpoint was increased gradually in order to increase the applied pressure.
Correlated AFM and fluorescence imaging
Correlated AFM and fluorescence images were acquired as described previously 37. Briefly, fluorescence images were acquired with an EMCCD iXon Ultra 888 camera (Andor) mounted on an IX73 inverted optical microscope (Olympus) equipped with a 100X oil immersion objective (UAPON100XOTIRF, Olympus). Illumination was provided by an MLC monolithic laser combiner (Agilent) coupled to an optical fiber. For combined fluorescence imaging of FtsZ-GFP and FM4-64 the excitation filter and dichroic mirror of the EGFP filter cube F36-526 (AHF Analysetechnik, Germany) were used. The emission light was split by an optical system (DV2, Photometrics) equipped with a second dichroic mirror (T565lpxr) placed between the EMCCD camera and the microscope frame to separate the red and green channels each to one half of the EMCCD camera chip. Cleanup filters used were F37-528 (EGFP) for the green channel and F37-624 (TxRed) for the red channel. Additionally, a neutral density filter with OD 0.6 was placed on the red channel. Typically, 5 mW power of 488 nm laser light at the MLC400B output was used for illumination. Images were recorded with EM gain set to 300 and exposure time to 500 milliseconds. The AFM was mounted on top of the inverted microscope (IX73, Olympus) and the AFM laser was switched off before acquiring fluorescence images. Contrast and brightness were adjusted with ImageJ.
Membrane staining
The bacterial cell membrane was stained with FM4-64 (Life Technologies) before fluorescence images were taken. The dye was diluted in 7H9 medium and used at a final concentration of 0.2 µg ml-1. After fluorescence images were taken the sample was washed with 2 ml 7H9 medium to remove unbound FM4-64 in order to minimize any potential effects on cell growth.
AFM data processing
For processing AFM images, standard scanning probe software was used (Gwyddion, Nanoscope Analysis). For Figure 3b each line scanned across the PCF at 1 Hz was smoothed twice with a moving average at a 20-pixel window size and the peaks of each line were then centered with Matlab. The mean of the centermost eight pixels was extracted for each line using ImageJ. For each line, these values were then normalized to the mean of a feature far away from the center peak to correct for small temporal fluctuations during the measurement. Kymograph data in Figure 2g were smoothed two times with a moving average at a 3-pixel window size along the fast scan axis (x-direction).
Finite-element model of a dividing cell
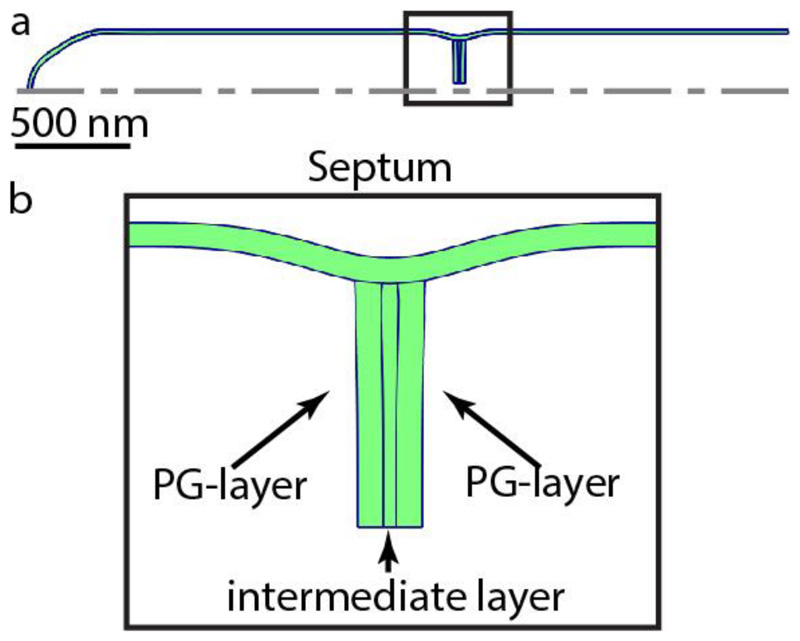
We made a model of a dividing cell building a septum (Extended data Figure S17) with COMSOL Multiphysics ® version 5.3, assuming a linear elastic structure with axial symmetry. The cell was inflated with a uniform internal turgor pressure.
Extended Data
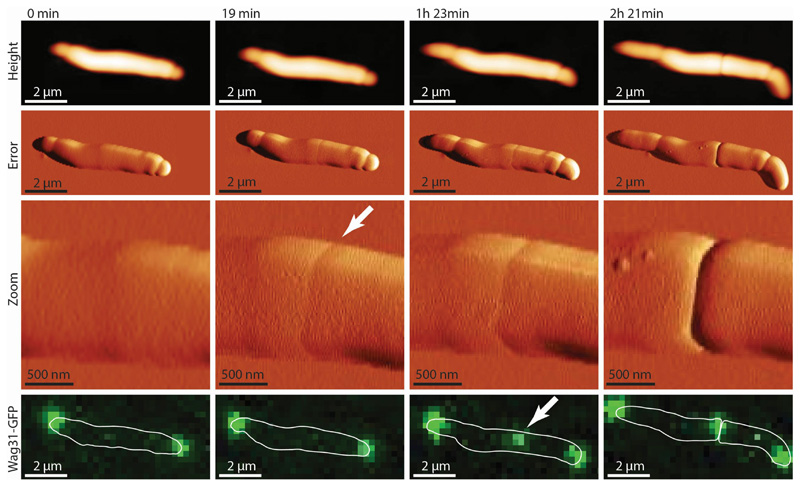
Extended Data Figure S1. The pre-cleavage furrow (PCF) precedes the Wag31-GFP cytokinesis marker at the future cell division site.
Time sequence of cells expressing Wag31-GFP imaged by correlated AFM and fluorescence microscopy. In this example, the PCF appears at 19 minutes (white arrow). Wag31-GFP, a marker of cytokinesis 1, appears much later and co-localizes with the PCF (arrow at 1 hour 23 minutes) (n=2).
Extended Data Figure S2. AFM scan line across the PCF during cleavage.
Cleavage of sibling cells was monitored by constantly scanning perpendicularly across the PCF with the AFM cantilever at 10 Hz. A representative example is shown. The cleavage event corresponds to an abrupt drop in the height profile (grey shading). Cleavage is completed within 10 milliseconds and no gradual constriction is observed leading up to this event (flat line).
Extended Data Figure S3. Height data of millisecond cell cleavage measured at 1 kHz rate (shown in Figure 2e).
(a) Overview of a cell initating septation. (b) Zoom-in (blue square) to the nascent PCF. The cantilever tip was positioned exactly on the center of the PCF (blue cross ‘x’) and the height was recorded without scanning the tip laterally at a rate of 1 kHz. (c) Height data (upper panel) and height profile (lower panel) at cleavage. (d) After the drop in height was observed an image was immediately recorded at the same position to confirm that the drop in height was due to cell cleavage and that the location of the AFM tip remained at the site of cell cleavage.
Extended Data Figure S4. Cell cleavage measured at 1 millisecond time resolution.
The time required for cell cleavage was measured at a 1 kHz rate by constantly measuring the height of a single point on top of the PCF. Two representative examples are shown. The cleavage event corresponds to an abrupt drop in the height profile (grey shading). Cleavage is completed within 21 milliseconds (upper panel) or 15 milliseconds (lower panel) and no gradual constriction is observed leading up to this event (flat line).
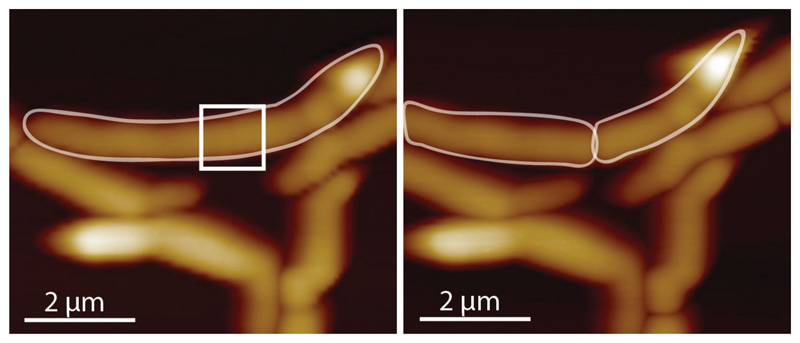
Extended Data Figure S5. Overview height images of cell before (left) and after (right) cleavage shown in Figure 2f-h.
The white square in the image on the left is the region corresponding to the 3D representation in Figure 2f.
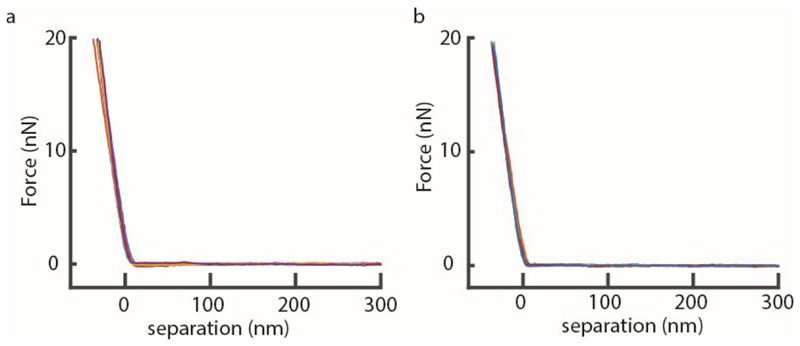
Extended Data Figure S6. AFM force curves at the PCF of two representative cells over time.
(a,b) Force curves on the PCF of two individual cells over time. Compared to measurements in QNM mode, the characteristics of acquiring force curve are significantly different: ~1,000 times lower ramp rate, ~200 times lower indentation velocity, ~20 times higher maximal force applied, and generally larger indentation depth.
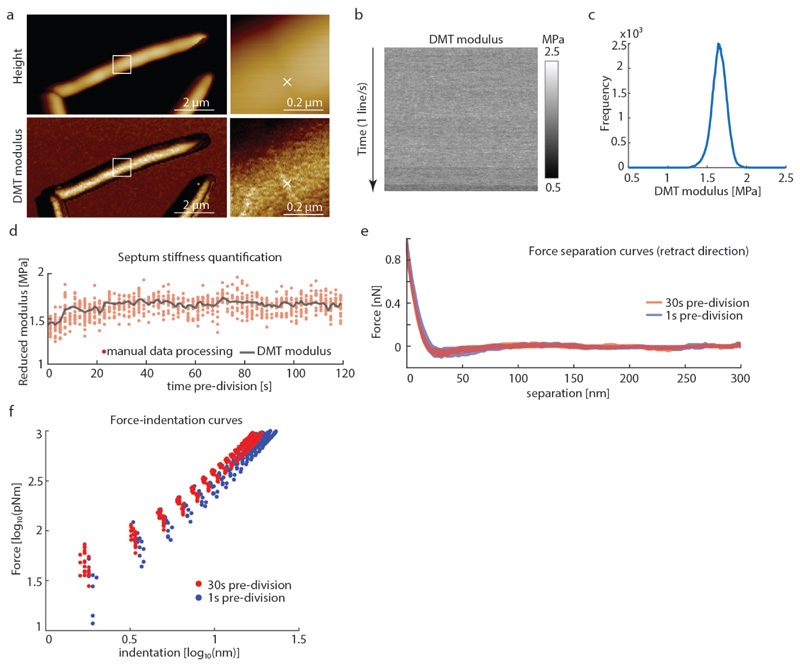
Extended Data Figure S7. Comparison of stiffness values obtained from QNM DMT modulus imaging channel and analysis of the individual force-distance curves.
To compare the stiffness given by the DMT modulus imaging channel with manual analysis of the recorded force curves, force curves were recorded leading up to a cell cleavage event using QNM mode in peak force capture to record the individual force-distance curves at a ramp rate of 1 kHz and a peak force of 1 nN. (a) The cantilever tip was positioned at the center of a PCF (white cross ‘x’). (b) Force-distance curves were recorded at the same spot on top of the PCF without laterally moving the tip. (c) The mean value obtained from the DMT modlus channel was ~1.6 MPa. (d) For each line in the DMT modulus image (corresponding to 128 data points in 0.5 seconds) the average stiffness value was calculated and plotted (black line). Every tenth force curve was then processed manually with Nanoscope Analysis software. Each retract direction of the force curve was corrected to set the baseline to 0 nN, then a moving average filter with a width of 5 units was applied. To extract mechanical property values, a Hertzian fit was used in the range between 4% to 98% of the maximal force (red dots), then 50% of the force curves with the highest r2 values were plotted. The DMT modulus values extracted from the QNM channel image are in good agreement with manual force-distance analysis. Decrease in stiffness at the septum during the last phase of cell division was observed in the DMT modulus channel and the force curve analysis alike (last ~20 seconds). (e) Representative force-separation curves taken at either 30 seconds (red) or 1 second (blue) before cell cleavage. (f) To unveil multiple slopes that could potentially derive from different cell wall layers, the same data as in (e) were used to plot the slope of the force-separation curves in a log-log plot as has been done by others 2 to discriminate between the contribution of the cell wall and the turgor pressure. However, in these measurements there is no clear distinction that would account for two different linear slopes. The decrease in the stiffness at 1 second (blue) before cleavage compared to the stiffness at 30 seconds (red) before cleavage is clearly discernible in the log-log plot.
Extended Data Figure S8. Stiffness at the PCF measured by repeatedly scanning across the PCF.
(a) Zoomed-out view of a cell initiating septation. (b) Zoom-in on the PCF (blue box in (a)). Stiffness evolution over time was measured by repeatedly scanning a line across the PCF at the same location (blue arrow) in QNM mode until a drop in height was observed. (c) Kymogram of PCF stiffness over time, proceeding from top to bottom. The abrupt decrease in stiffness at the bottom of the kymogram corresponds to cell cleavage. From these data the stiffness values were extracted as described in the Methods and plotted in Figure 3b. (d) Following the abrupt decrease in PCF stiffness recorded in (c), zoom-in on the same region of the same cell (pink square in (a)) verifed that cleavage had occurred.
Extended Data Figure S9. Height images of cells before and after deflation induced by piercing with a sharp AFM cantilever tip.
(a,b) Height images of cells shown in Figure 3e at 0 minutes (a) and 1 hour 46 minutes (b). (c) Height profiles of cells before (red line) and after (blue line) AFM-mediated piercing show deflation of the cell pierced with the cantilever tip, confirming loss of turgor pressure.
Extended Data Figure S10. Height images of cells corresponding to stiffness maps shown in Figure 4.
Extended Data Figure S11. Cell cleavage can be induced prematurely by increasing the mechanical stress on the PCF.
Cell cleavage was induced at different time points after the first appearance of the PCF (0 minutes) by applying a point force on the PCF with the AFM cantilever. In the majority of cases, forced cleavage at early time points resulted in two non-viable daughter cells (red dots), while forced cleavage at later time points resulted in two sibling cells that survived and continued to grow (black dots). The average time of natural cleavage of non-induced cells is indicated by the vertical blue dashed line at 52 minutes (n= 15).
Extended Data Figure S12. Premature cleavage can be induced by AFM force curves or AFM scanning along the PCF.
Cleavage of cells shown in Figure 4 was induced by applying force with the AFM cantilever, which was done either by recording a force curve (wild-type cells) or by scanning along the septum at an elevated force (RipA-depleted cells). (a) Force at the PCF was applied by recording a force curve on the center of the PCF. A sudden drop in the force (black arrow) indicates an induced cleavage event. Subsequent AFM images show newly cleaved poles (see Figure 4a). (b) As in (a) force was applied at the PCF by recording a force curve. A drop in the force (black arrow) indicates a rupture event of leading to premature partial cleavage as shown in Figure 4b. Subsequently, the increasing force on the forming septum leads to rupture (*) and cell lysis. (c) Kymogram of the height while continuously scanning the same line (1 line/second) along the PCF of a RipA-depleted cell at high force. A sudden drop in the height (black arrow) indicates an induced cleavage event. AFM images prior and subsequent to induced cleavage events are shown in Figure 4.
Extended Data Figure S13. Cells forced to undergo premature cleavage continue to grow and divide.
(a) Time lapse AFM height images of cells that continue to grow and divide after cleavage was prematurely induced by application of mechanical stress on the PCF using the AFM cantilever. At 50 minutes, a zoom-in shows the area outlined at 0 minutes (white box). At 1 hour 14 minutes, premature cell cleavage was induced by AFM-mediated application of force on the PCF (white arrow). Between 1 hour 27 minutes and 3 hours 16 minutes, the prematurely cleaved new cell poles elongated and the corresponding sibling cells grew and divided (arrowhead at 3 hours 16 minutes, cropped and rotated to align with previous time points). (b) Force curve corresponding to forced cell cleavage at 1 hour 14 minutes. (c) Non-cropped and non-rotated image of time-lapse image shown in (a) at 3 hours 16 minutes.
Extended Data Figure S14. RipA-depleted cells form chains of cells that grow only at the free cell poles.
The two free (outermost) cell poles elongate and new septa continue to form, but failure of septated sibling cells to undergo cleavage, due to depletion of RipA, results in a cell-chaining phenotype. Growth occurs mainly at the free cell poles at the two extremeties of a chain and occasionally at lateral budding locations (cf. 0 minutes and 1 hour 35 minutes). Grey dashed lines indicate the outline of the chain of cells. White dashed lines mark the positions of the free cell poles at 0 minutes.
Extended Data Figure S15. Height and stiffness changes of chained RipA-depleted cells.
(a) Stiffness channel of a centrally located chained and non-elongating RipA-depleted cell over time. While the surface structural features do not change significantly, the measured stiffness at the PCF and the width of the non-elongating central cell increase over time, up to 1 hour 52 minutes (n=3). Upon loss of pressure of the neighboring sibling cell (1 hour 56 minutes, white arrow) the stiffness of the septum and the surviving sibling cell both decrease slightly. (b) Corresponding height images of (a). As the central chained cell becomes stiffer it also becomes higher over time.
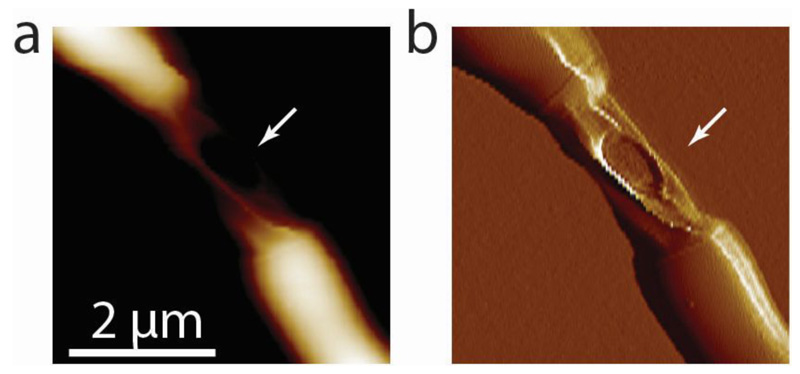
Extended Data Figure S16. Cell wall failure of centrally located cells of RipA-depleted cell chains occurs in between the flanking PCFs.
(a) AFM height image of a representative chained RipA-depleted cell that died (white arrow). (b) AFM error image showing a hole in the middle part of the cell that died.
Extended Data Figure S17. Finite element modeling of the PCF in a dividing cell.
(a) Global cell geometry with a partially closed septum. The dotted line represents the axis of symmetry. (b) Zoom-in on the septum and PCF, showing the top part of the partially closed septum. The peptidoglycan (PG) layer on each side would become the new poles of the two respective daughter cells. These peptidoglycan layers are connected by a soft intermediate layer.
Supplementary Material
One Sentence Summary.
Enzymatic activity and mechanical forces work together to control the timing and location of mycobacterial cell division.
Acknowledgements
We thank E.J. Rubin for generously providing the RipA conditional depletion strain of M. smegmatis. This research was supported in part by grants to G.E.F. from the Swiss National Science Foundation (205321_134786 and 205320_152675), from the European Union FP7/2007-2013/ERC under Grant Agreement No. 307338-NaMic, H2020 - UE Framework Programme for Research & Innovation (2014-2020); ERC-2017-CoG; InCell; Project number 773091, from the Commission for Technology and Innovation under CTI no. 18330.1 PFNM-NM, and by a grant to J.D.M. from the Swiss National Science Foundation (310030B_176397). HAE was supported by an EMBO Long Term Fellowship (191-2014) and an EMBO Advanced Long Term Fellowship (750-2016).
Footnotes
Data availability statement:
The data that support the findings of this study are available from the corresponding author upon reasonable request.
Author contributions:
P.D.O., G.E.F. and J.D.M conceptualized the study. P.D.O., M.T.M.H., A.H.E. developed imaging protocols. P.D.O., M.T.M.H. G.E.F and J.D.M. designed experiments. P.D.O. and M.T.M.H. performed the experiments and analyzed the data. A. P. N. participated in building the instrument and simulations. P.D.O., M.T.M.H., G.E.F and J.D.M. wrote the manuscript.
References
- 1.Cabeen MT, Jacobs-Wagner C. Bacterial cell shape. Nat Rev Microbiol. 2005;3:601–610. doi: 10.1038/nrmicro1205. [DOI] [PubMed] [Google Scholar]
- 2.Egan AJ, Vollmer W. The physiology of bacterial cell division. Ann N Y Acad Sci. 2013;1277:8–28. doi: 10.1111/j.1749-6632.2012.06818.x. [DOI] [PubMed] [Google Scholar]
- 3.Gray AN, et al. Coordination of peptidoglycan synthesis and outer membrane constriction during Escherichia coli cell division. Elife. 2015;4 doi: 10.7554/eLife.07118. [DOI] [PMC free article] [PubMed] [Google Scholar]
- 4.Van Der Hofstadt M, Hüttener M, Juárez A, Gomila G. Nanoscale imaging of the growth and division of bacterial cells on planar substrates with the atomic force microscope. Ultramicroscopy. 2015;154:29–36. doi: 10.1016/j.ultramic.2015.02.018. [DOI] [PubMed] [Google Scholar]
- 5.Chao MC, et al. Protein complexes and proteolytic activation of the cell wall hydrolase RipA regulate septal resolution in mycobacteria. PLoS Pathog. 2013;9 doi: 10.1371/journal.ppat.1003197. [DOI] [PMC free article] [PubMed] [Google Scholar]
- 6.Zhou X, et al. Mechanical crack propagation drives millisecond daughter cell separation in Staphylococcus aureus. Science. 2015;348:574–578. doi: 10.1126/science.aaa1511. [DOI] [PMC free article] [PubMed] [Google Scholar]
- 7.Zhou X, Halladin DK, Theriot JA. Fast mechanically driven daughter cell separation is widespread in actinobacteria. MBio. 2016;7 doi: 10.1128/mBio.00952-16. [DOI] [PMC free article] [PubMed] [Google Scholar]
- 8.Monteiro JM, et al. Cell shape dynamics during the staphylococcal cell cycle. Nat Commun. 2015;6 doi: 10.1038/ncomms9055. [DOI] [PMC free article] [PubMed] [Google Scholar]
- 9.Vijay S, Anand D, Ajitkumar P. Unveiling unusual features of formation of septal partition and constriction in mycobacteria--an ultrastructural study. J Bacteriol. 2012;194:702–707. doi: 10.1128/JB.06184-11. [DOI] [PMC free article] [PubMed] [Google Scholar]
- 10.Takade A, Takeya K, Taniguchi H, Mizuguchi Y. Electron microscopic observations of cell division in Mycobacterium vaccae V1. J Gen Microbiol. 1983;129:2315–2320. doi: 10.1099/00221287-129-7-2315. [DOI] [PubMed] [Google Scholar]
- 11.Dahl JL. Electron microscopy analysis of Mycobacterium tuberculosis cell division. FEMS Microbiol Lett. 2004;240:15–20. doi: 10.1016/j.femsle.2004.09.004. [DOI] [PubMed] [Google Scholar]
- 12.Koch AL. Biophysics of bacterial walls viewed as stress-bearing fabric. Microbiol Rev. 1988;52:337–353. doi: 10.1128/mr.52.3.337-353.1988. [DOI] [PMC free article] [PubMed] [Google Scholar]
- 13.Chao MC, et al. Protein complexes and proteolytic activation of the cell wall hydrolase RipA regulate septal resolution in mycobacteria. PLoS Pathog. 2013;9:e1003197. doi: 10.1371/journal.ppat.1003197. [DOI] [PMC free article] [PubMed] [Google Scholar]
- 14.Dufrêne YF. Atomic force microscopy in microbiology: new structural and functional insights into the microbial cell surface. MBio. 2014;5:e01363–01314. doi: 10.1128/mBio.01363-14. [DOI] [PMC free article] [PubMed] [Google Scholar]
- 15.Herman-Bausier P, et al. Mechanical Strength and Inhibition of the Staphylococcus aureus Collagen-Binding Protein Cna. MBio. 2016;7 doi: 10.1128/mBio.01529-16. [DOI] [PMC free article] [PubMed] [Google Scholar]
- 16.Oh YJ, et al. Curli mediate bacterial adhesion to fibronectin via tensile multiple bonds. Sci Rep. 2016;6 doi: 10.1038/srep33909. [DOI] [PMC free article] [PubMed] [Google Scholar]
- 17.Deng Y, Sun M, Shaevitz JW. Direct measurement of cell wall stress stiffening and turgor pressure in live bacterial cells. Phys Rev Lett. 2011;107 doi: 10.1103/PhysRevLett.107.158101. [DOI] [PubMed] [Google Scholar]
- 18.Touhami A, Jericho MH, Beveridge TJ. Atomic force microscopy of cell growth and division in Staphylococcus aureus. J Bacteriol. 2004;186:3286–3295. doi: 10.1128/JB.186.11.3286-3295.2004. [DOI] [PMC free article] [PubMed] [Google Scholar]
- 19.Dover RS, Bitler A, Shimoni E, Trieu-Cuot P, Shai Y. Multiparametric AFM reveals turgor-responsive net-like peptidoglycan architecture in live streptococci. Nat Commun. 2015;6 doi: 10.1038/ncomms8193. [DOI] [PMC free article] [PubMed] [Google Scholar]
- 20.Eskandarian HA, et al. Division site selection linked to inherited cell surface wave troughs in mycobacteria. Nat Microbiol. 2017;2 doi: 10.1038/nmicrobiol.2017.94. [DOI] [PubMed] [Google Scholar]
- 21.Turner RD, Hurd AF, Cadby A, Hobbs JK, Foster SJ. Cell wall elongation mode in Gram-negative bacteria is determined by peptidoglycan architecture. Nat Commun. 2013;4 doi: 10.1038/ncomms2503. [DOI] [PMC free article] [PubMed] [Google Scholar]
- 22.Bailey RG, et al. The interplay between cell wall mechanical properties and the cell cycle in Staphylococcus aureus. Biophys J. 2014;107:2538–2545. doi: 10.1016/j.bpj.2014.10.036. [DOI] [PMC free article] [PubMed] [Google Scholar]
- 23.Loskill P, et al. Reduction of the peptidoglycan crosslinking causes a decrease in stiffness of the Staphylococcus aureus cell envelope. Biophys J. 2014;107:1082–1089. doi: 10.1016/j.bpj.2014.07.029. [DOI] [PMC free article] [PubMed] [Google Scholar]
- 24.Santi I, Dhar N, Bousbaine D, Wakamoto Y, McKinney JD. Single-cell dynamics of the chromosome replication and cell division cycles in mycobacteria. Nat Commun. 2013;4 doi: 10.1038/ncomms3470. [DOI] [PubMed] [Google Scholar]
- 25.Dufrêne YF, Martínez-Martín D, Medalsy I, Alsteens D, Müller DJ. Multiparametric imaging of biological systems by force-distance curve-based AFM. Nat Methods. 2013;10:847–854. doi: 10.1038/nmeth.2602. [DOI] [PubMed] [Google Scholar]
- 26.Sun SX, Jiang H. Physics of bacterial morphogenesis. Microbiol Mol Biol Rev. 2011;75:543–565. doi: 10.1128/MMBR.00006-11. [DOI] [PMC free article] [PubMed] [Google Scholar]
- 27.Francius G, Domenech O, Mingeot-Leclercq MP, Dufrêne YF. Direct observation of Staphylococcus aureus cell wall digestion by lysostaphin. J Bacteriol. 2008;190:7904–7909. doi: 10.1128/JB.01116-08. [DOI] [PMC free article] [PubMed] [Google Scholar]
- 28.Wheeler R, et al. Bacterial cell enlargement requires control of cell wall stiffness mediated by peptidoglycan hydrolases. MBio. 2015;6 doi: 10.1128/mBio.00660-15. [DOI] [PMC free article] [PubMed] [Google Scholar]
- 29.Ruggiero A, et al. Structure and functional regulation of RipA, a mycobacterial enzyme essential for daughter cell separation. Structure. 2010;18:1184–1190. doi: 10.1016/j.str.2010.06.007. [DOI] [PubMed] [Google Scholar]
- 30.Hett EC, et al. A partner for the resuscitation-promoting factors of Mycobacterium tuberculosis. Mol Microbiol. 2007;66:658–668. doi: 10.1111/j.1365-2958.2007.05945.x. [DOI] [PubMed] [Google Scholar]
- 31.Hett EC, Chao MC, Deng LL, Rubin EJ. A mycobacterial enzyme essential for cell division synergizes with resuscitation-promoting factor. PLoS Pathog. 2008;4 doi: 10.1371/journal.ppat.1000001. [DOI] [PMC free article] [PubMed] [Google Scholar]
- 32.Jiang Y, Liang X, Guo M, Cao Y, Cai S. Fracture mechanics modeling of popping event during daughter cell separation. Biomech Model Mechanobiol. 2018;17 doi: 10.1007/s10237-018-1019-6. [DOI] [PubMed] [Google Scholar]
- 33.Thanky NR, Young DB, Robertson BD. Unusual features of the cell cycle in mycobacteria: polar-restricted growth and the snapping-model of cell division. Tuberculosis (Edinb) 2007;87:231–236. doi: 10.1016/j.tube.2006.10.004. [DOI] [PubMed] [Google Scholar]
- 34.Smolyakov G, Formosa-Dague C, Severac C, Duval RE, Dague E. High speed indentation measures by FV, QI and QNM introduce a new understanding of bionanomechanical experiments. Micron. 2016;85:8–14. doi: 10.1016/j.micron.2016.03.002. [DOI] [PubMed] [Google Scholar]
- 35.Atilgan E, Magidson V, Khodjakov A, Chang F. Morphogenesis of the fission yeast cell through cell wall expansion. Curr Biol. 2015;25:2150–2157. doi: 10.1016/j.cub.2015.06.059. [DOI] [PMC free article] [PubMed] [Google Scholar]
- 36.Meniche X, et al. Subpolar addition of new cell wall is directed by DivIVA in mycobacteria. Proc Natl Acad Sci USA. 2014;111 doi: 10.1073/pnas.1402158111. [DOI] [PMC free article] [PubMed] [Google Scholar]
- 37.Odermatt PD, et al. High-resolution correlative microscopy: bridging the gap between single molecule localization microscopy and atomic force microscopy. Nano Lett. 2015;15:4896–4904. doi: 10.1021/acs.nanolett.5b00572. [DOI] [PubMed] [Google Scholar]
Associated Data
This section collects any data citations, data availability statements, or supplementary materials included in this article.


