Abstract
The Magnetospheric Multiscale (MMS) spacecraft encounter an electron diffusion region (EDR) of asymmetric magnetic reconnection at Earth’s magnetopause. The EDR is characterized by agyrotropic electron velocity distributions on both sides of the neutral line. Various types of plasma waves are produced by the magnetic reconnection in and near the EDR. Here we report large-amplitude electron Bernstein waves (EBWs) at the electron-scale boundary of the Hall current reversal. The finite gyroradius effect of the outflow electrons generates the crescent-shaped agyrotropic electron distributions, which drive the EBWs. The EBWs propagate toward the central EDR. The amplitude of the EBWs is sufficiently large to thermalize and diffuse electrons around the EDR. The EBWs contribute to the cross-field diffusion of the electron-scale boundary of the Hall current reversal near the EDR.
Subject terms: Space physics, Magnetospheric physics
Various types of plasma waves are generated around electron diffusion regions (EDRs). Here the authors show electron Bernstein waves (EBWs), at the electron-scale boundary of the Hall current reversal near EDR, are sufficiently strong to diffuse electrons and modify electron pressure tensor.
Introduction
Magnetic reconnection is a fundamental and universal process, which transfers energy stored in the magnetic field to kinetic energy of charged particles1,2. Magnetic reconnection powers eruptive processes in space and laboratory plasmas. Earth’s magnetosphere provides a unique environment to study magnetic reconnection by analyzing in situ spacecraft measurements. NASA’s MMS mission was designed to resolve the particles and fields at electron scales. The goal of MMS is to investigate the EDR, which is the core region of reconnection where the magnetic field lines break and reconnect1,3. Reconnection at the dayside magnetopause is asymmetric due to the large plasma and magnetic field differences between the magnetosheath and the magnetosphere4,5. Numerical simulations and MMS observations of asymmetric reconnection show that the crescent-shaped agyrotropic electrons can be found on both magnetospheric and magnetosheath sides of the neutral line3,6–9.
Waves are suggested to generate anomalous resistivity and plasma diffusion, potentially enabling magnetic fields to break and reconnect10. Various types of waves produced by reconnection have been reported outside of EDRs10–16. In and near EDRs, MMS has observed upper-hybrid (UH)9,17,18 and whistler19 waves and low-frequency turbulent fluctuations20. Among these waves, the high-frequency electrostatic UH waves are driven by the agyrotropic electron beams near an EDR encounter. The amplitudes of the upper-hybrid waves are sufficiently large to interact with electrons and contribute to electron diffusion and scattering near the EDR9. Here we report an MMS observation of large-amplitude EBWs driven by electron crescents near an EDR. The EBWs have sufficient large amplitude to thermalize and diffuse electrons around the EDR. The EBWs contribute to the cross-field diffusion of the electron-scale boundary.
Results
Electron diffusion region encounter by MMS
The EDR event was encountered near Earth’s subsolar magnetopause on December 24, 2016. MMS were located at [9.4, 3.7, 1.6] R (Earth radii) in geocentric solar ecliptic (GSE) coordinates. We use magnetic field B data from the fluxgate magnetometer21 and the search-coil magnetometer22. The electric field E data are from the electric field double probes23,24. The particle data are from the fast plasma investigation (FPI)25. All data presented are in high-resolution burst mode. The burst-mode electron data are sampled at 30 ms resolution. The vectors are shown in boundary-normal (LMN) coordinates based on minimum variance analysis (MVA)26 of B over the magnetopause crossing, unless otherwise stated. Here, L = [0.09, 0.08, 0.99] is along the reconnecting magnetic field direction, M = [0.23, −0.97, 0.06] is the out-of-plane direction, and N = [0.97, 0.22, −0.10] is the normal direction in GSE coordinates.
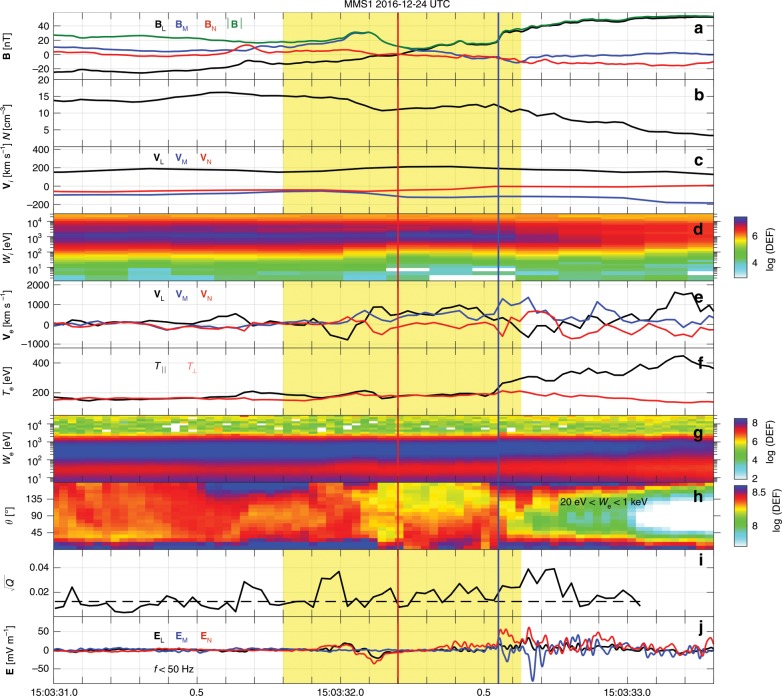
Figure 1 presents an overview of the magnetopause crossing observed by MMS1, which is sketched in Fig. 2. The crossing from the reconnection outflow to the magnetosphere is characterized by a B reversal (see Fig. 1a), a decrease in plasma density (see Fig. 1b), and an ion outflow (V 0) (see Fig. 1c). The magnetic shear angle between the magnetosheath and magnetosphere is about 162°, and so the guide field (~12 nT) in this event is relatively weak. In Fig. 1, the neutral line is located at the time indicated by the red vertical line, determined by the B zero-crossing point. On the magnetosheath side of the neutral line, MMS1 observes a strong increase in B, which corresponds to the Hall magnetic field5,28,29. The magnetospheric separatrix is located at the time indicated by the blue vertical line, and is characterized by a fast electron flow along M direction (see Fig. 1e), an increase in (see Fig. 1f), a rapid increase of B (see Fig. 1a), and an E (see Fig. 1j). After the separatrix crossing, the enhanced electron fluxes along the directions parallel and antiparallel to B (see Fig. 1h) are trapped electrons in the magnetospheric inflow region30,31. The parameter provides a measure of agyrotropy based on the magnitude of the off-diagonal terms of the electron pressure tensor in field-aligned coordinates27. Typical values are about 0.1 around the electron diffusion region at the magnetopause8,9,14. As shown in Fig. 1i, electron velocity distributions with enhanced agyrotropies are observed over the magnetopause crossing, including the magnetosheath and magnetospheric sides of the neutral line. All these features indicate that MMS are in or near an electron diffusion region of the magnetopause reconnection3,5–7,9,20,31–36.
Fig. 1. Magnetopause crossing observed by MMS1.
a B. b Number density . c V. d Ion differential energy flux (color scale, in unit of keV s cm sr keV). e V. f Electron and . g Electron differential energy flux. h Electron pitch-angle distribution between 20 eV and 1 keV. i Agyrotropy measure 27 with a background of 0.012 (black dashed line). j E with frequencies 50 Hz. The vectors are all presented in LMN coordinate system. The red and blue vertical lines represent the neutral line and the magnetospheric separatrix, respectively. The agyrotropy measure with 5 cm is neglected. A detailed overview of the yellow-shaded region is presented in Fig. 3.
Fig. 2. Sketch of asymmetric reconnection with J.
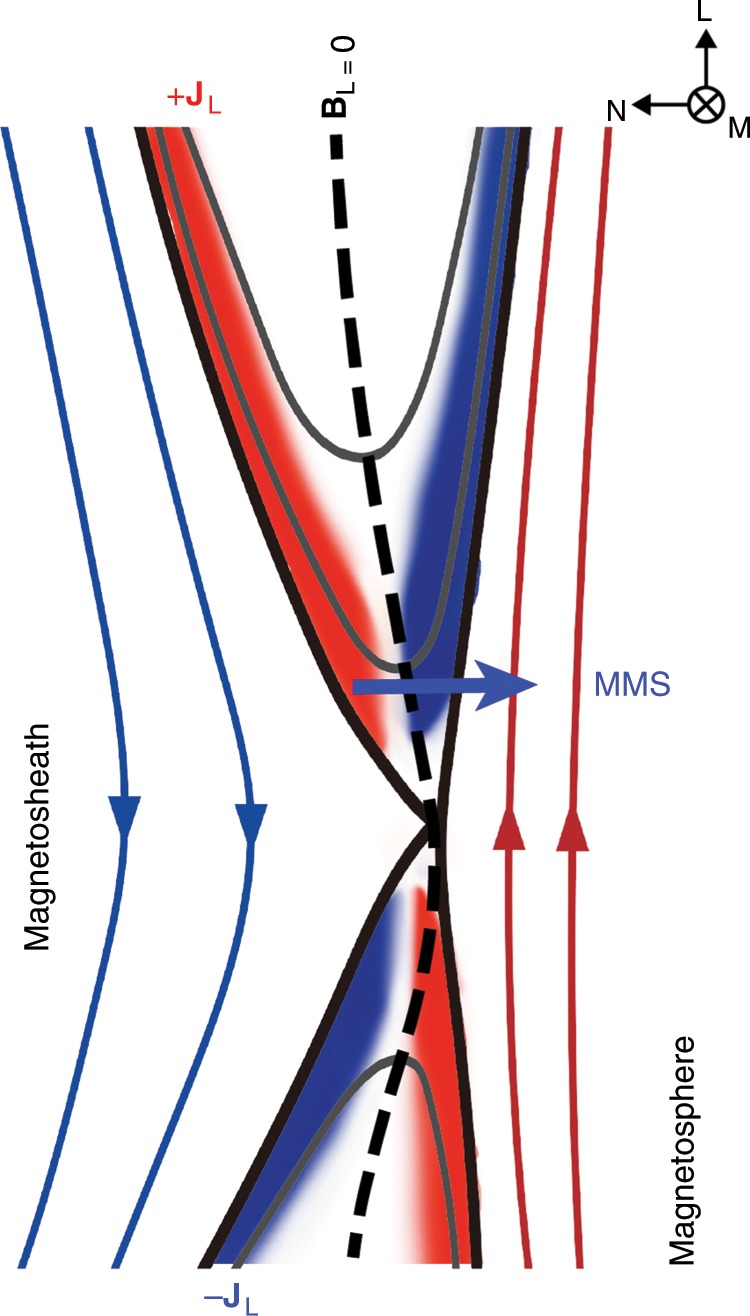
The black dashed curve shows the neutral line (defined where B = 0), and the blue arrowed line denotes the MMS trajectory near the electron diffusion region. The large-amplitude electron Bernstein waves are observed on the magnetosheath side of the neutral line.
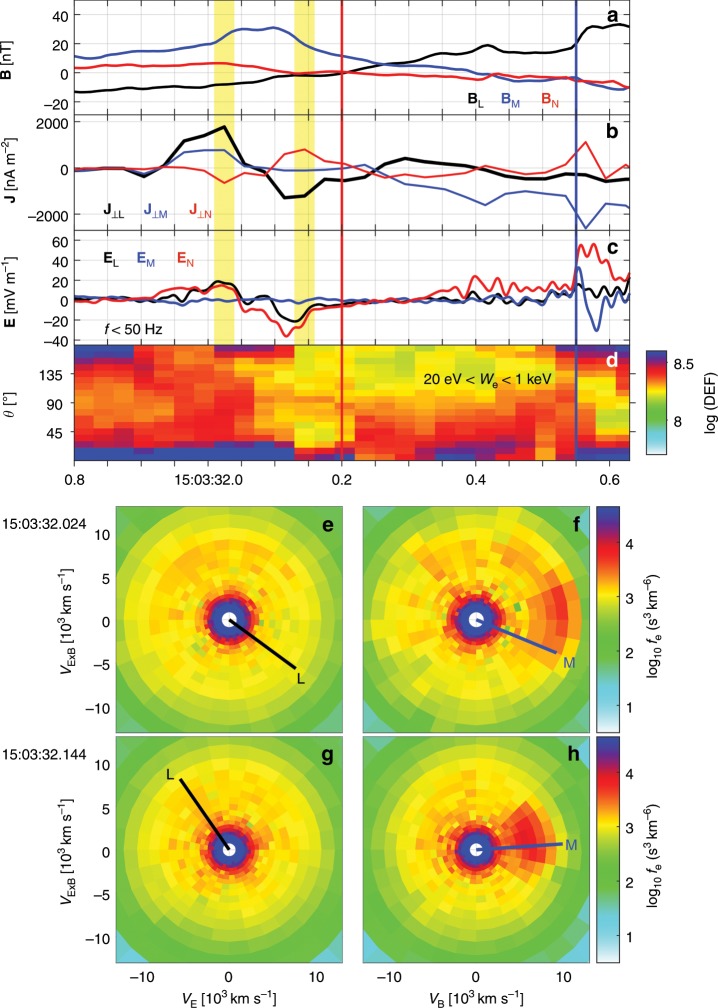
Figure 3a–d presents a detailed overview of the yellow-shaded region in Fig. 1. Figure 3b shows the electric current J perpendicular to B calculated from the particle moments37,38. The strong Hall magnetic field B (see Fig. 3a) is located at the J reversal from L to −L, which is mainly carried by an electron flow reversal from −L to L (see Fig. 1e). Here, the electron thermal gyroradius is 1.7 km, similar to the electron inertial length (1.4 km). The normal speed V50 km s of the magnetopause motion is estimated from multispacecraft timing analysis39 of B around the neutral line. The peak-to-peak time duration of the Hall-current region is about 0.12 s, which corresponds to a normal scale of 3.5 .
Fig. 3. Electron-scale boundary of the Hall current reversal.
a B. b Perpendicular components of J calculated by high-resolution FPI particle moments. c E with 50 Hz. d Electron pitch-angle distribution between 20 eV and 1 keV. The red and blue vertical lines represent the neutral line and the magnetospheric separatrix, respectively. e–h Electron distributions at times indicated by the two vertical yellow bars in (a–c), respectively. J calculated by FPI data agrees well with the current estimated by the curlometer method40, which has been verified by the current event and other MMS events37,38. The vectors are all presented in LMN coordinate system, and the L and M directions normalized by 10 km s are projected on (e–h).
We observe electron distributions with enhanced agyrotropies on both sides of the Hall current reversal (see Fig. 1i). Figure 3e, h shows the electron distributions at times indicated by the two yellow bars in Fig. 3a, c, respectively, which are the Hall current peaks. MMS1 observes dense crescents in the plane perpendicular to B and close to the E × B directions (more details in the section “Electron velocity distribution functions”). The electron crescents point close to the −L and L directions (shown by black lines in Fig. 3e, g) on the magnetosheath and the magnetospheric edges of the Hall B, respectively. The electron beams parallel to B (see Fig. 3f, h), seen as the enhanced energy fluxes parallel to B in Fig. 3d, are the magnetosheath inflow electrons moving towards the central diffusion region. Here, B is dominated by the Hall magnetic field, B.
Large-amplitude EBWs
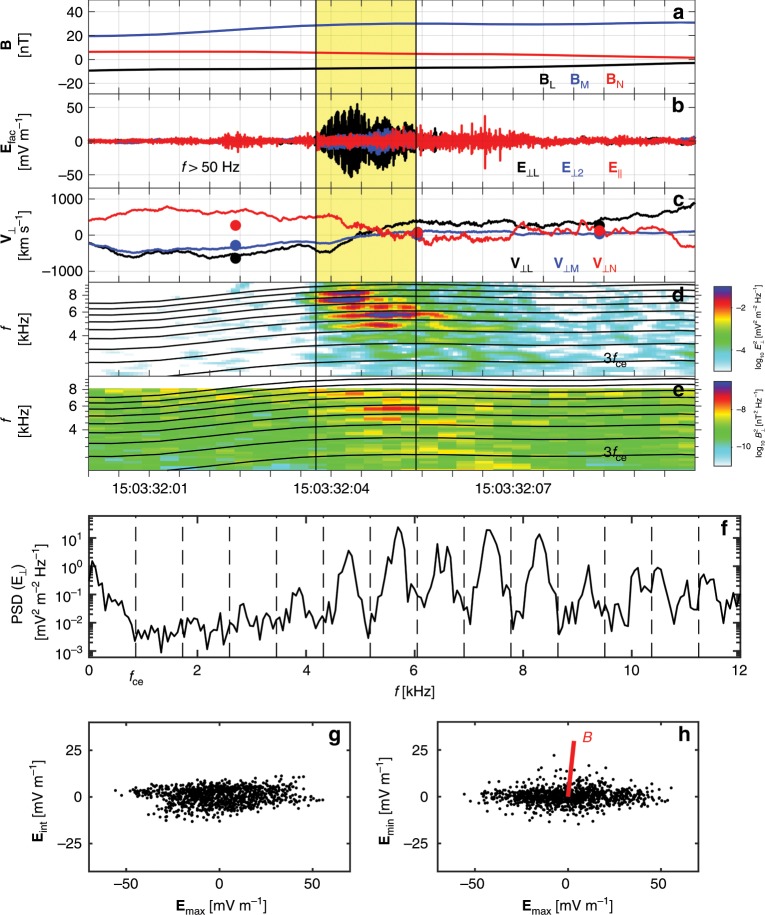
Large-amplitude high-frequency waves are observed at the electron-scale boundary of the Hall current reversal. Figure 4b shows the waveform of the high-frequency E and E (with respect to B) around the point where V = E × B/B changes sign (curves in Fig. 4c). In the yellow-shaded region, we can see that E E. E is much larger than the other perpendicular component E, making the E direction about 19 away from the L direction. We see distinct spectral peaks separated in frequency by approximately the electron cyclotron frequency (see Fig. 4d, e). The power spectrum of E within the yellow-shaded region is presented in Fig. 4f. The largest wave powers are observed in a range between 4.5 and 8.5 kHz, i.e., between the fifth and the ninth harmonics of (860 Hz).
Fig. 4. EBWs observed near EDR.
a B. b Perpendicular and parallel components of the high-frequency E with 50 Hz. (c) EB/B (lines) and 30-ms resolution V (dots). d Power spectrogram of E. e Power spectrogram of B. The electron cyclotron harmonic frequencies are plotted in (d, e). The yellow-shaded region from 15:03:32.037 to 15:03:32.054 UTC highlights the E fluctuations with amplitudes larger than E/, where E is the peak of the fluctuating E, and e is the Euler identity. f Power spectrum of E within the yellow-shaded region. The average and the harmonic frequencies are over-plotted. g, h Hodograms of E versus E, and E versus E. The red line in (h) denotes the B direction. During the EBWs observations, the electron plasma frequency 32.9 kHz is well above the electron cyclotron frequency 860 Hz.
Figure 4g, h presents the hodograms of E versus E and E versus E, respectively. Here, E, E, and E are the electric fields in the maximum ([−0.97, −0.16, 0.19], in LMN), intermediate ([0.21, −0.11, 0.98]), and minimum ([−0.13, 0.98, 0.14]) variance directions based on MVA of the E waveform high-pass filtered above 50 Hz, so all electron Bernstein modes are included. The high-frequency waves have a well-defined maximum variance direction, which is 166 away from the reconnecting magnetic field direction L and approximately 84 away from B. In addition, the wave fluctuations exhibit approximately linear polarization. We also observe extremely weak (0.02 nT) B fluctuations (see Fig. 4e) due to a small angle between the wave propagation direction and E fluctuation direction. All these observed properties of the high-frequency quasi-electrostatic waves are consistent with the characteristics of electron Bernstein waves41 expected in an over-dense plasma. Therefore, E direction provides a good estimation of the wave vector direction . In space plasma environments, the EBWs can also be observed around the bow shock42 and inside the magnetosphere43,44. In fusion devices, the EBWs are widely used to heat plasmas45.
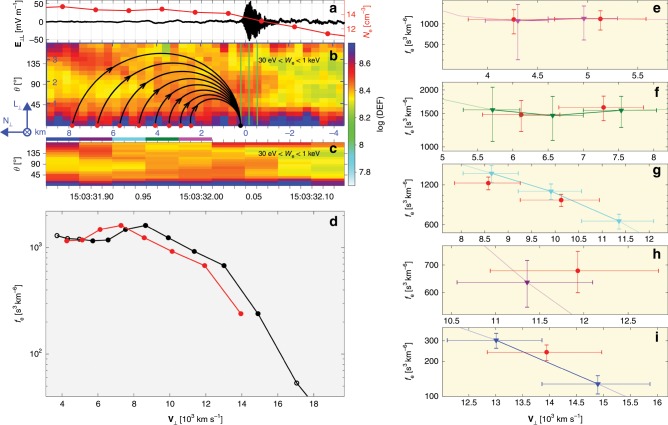
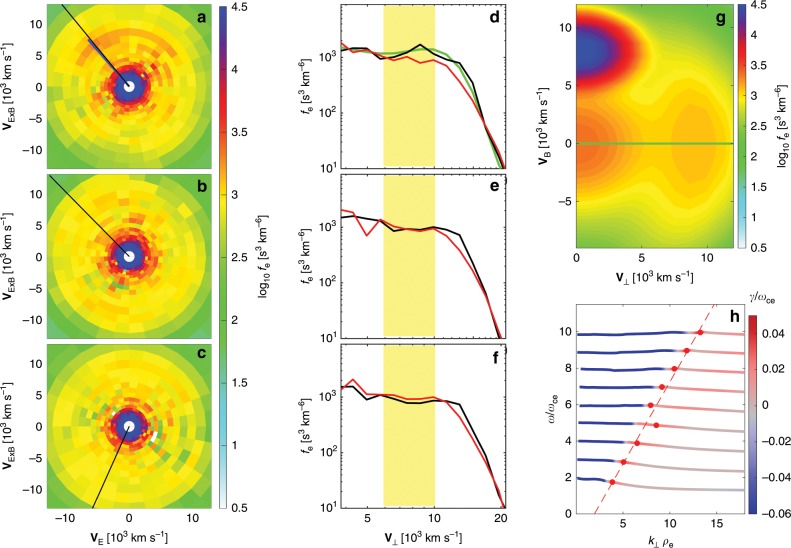
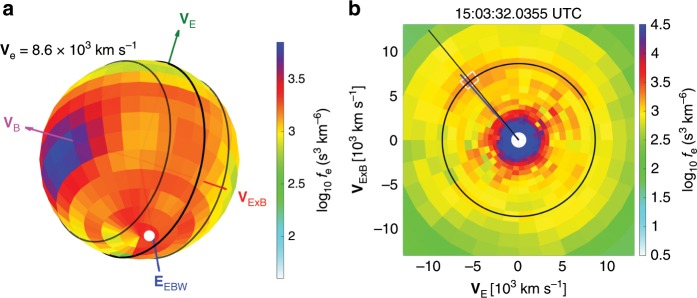
The EBWs are observed for about 17 ms, corresponding to a spatial scale of 0.5 normal to the magnetopause. We adopt the 7.5 ms electron distribution function data46 for detailed analysis of the generation of EBWs. In this case, the 7.5 ms electron data do not change substantially around the EBWs interval, which means that the 7.5 ms data provide nonaliased electron distribution functions before and during the large-amplitude EBWs. The electron distributions at times indicated by the three green lines in Fig. 5b are presented in Fig. 6a–c. Figure 6a shows the electron distribution just before the large-amplitude EBWs. The crescent-shaped electron distributions are oriented close to the E × B direction (see Fig. 7). The crescents have a clear positive gradient in the direction with the largest phase-space density (black curve in Fig. 6d), which is 7.3 away from the E direction (blue line in Fig. 6a) of the EBWs. The typical speed of the electrons constituting the crescents is 10 km s, and the number density of the crescents is of the total number density. The crescent energy density is about four orders of magnitudes larger than the maximum wave energy density. It is likely that the crescent-shaped electrons are the driving source of the large-amplitude EBWs. The electron speed with the positive gradient, 8 × 10³ km s, provides a good estimation of the phase velocity V of the EBWs. The frequency of peak wave power (5.7 kHz, between 6 and 7 , see Fig. 4f) corresponds to a wavelength of 1.4 km, which is comparable to . The direction with the largest crescent phase-space density (black line in Fig. 6a), [−0.97, −0.14, 0.15] (in LMN), is closely aligned with , suggesting the electron crescent is the source of the EBWs.
Fig. 5. Electron crescents generated by finite gyroradius effect.
a E with 50 Hz and . b Electron pitch-angle spectrogram using 7.5 ms FPI data and trajectories of 93−631 eV electrons. c Electron pitch-angle spectrogram using 30 ms FPI data. In (d), the black curve with dots denotes the electron distribution profile along at the time indicated by the first vertical green line in (b), and its corresponding Liouville mapping distribution profile is shown by the red curve with dots (see the section “Liouville mapping of the electron crescents” and Table 1). e–i Comparison of the mapping distributions (red curve) with five observed ones color-coded on top of (c). The errors along velocity are from the energy resolution of FPI, and the electron distribution errors loaded from the MMS data files are from the noise of the particle measurements25.
Fig. 6. Generation mechanism of the EBWs.
a–c Electron distributions at times indicated by the vertical green lines in Fig. 5b. The black lines in each panel denote the direction. The blue line in (a) denotes the E direction. d–f 1D electron distribution profiles along and from (a) to (c), respectively. The yellow shading denotes the domain of electron trapping by the EBWs potential. g Electron model distribution for the observed distribution in (a). The 1D profile along V (green line) is presented in (d). h Dispersion relation of the unstable electron Bernstein mode. The red dots denote the maximum growth rates (fitted by the red-dashed line).
Fig. 7. Two-dimensional (2D) slice from 3D electron distribution functions.
a Electron distribution functions with electron kinetic velocity of 8.6 km s (corresponding to 212 eV). The green, magenta, and red arrowed lines denote the directions of VE, VB, and VE×B, respectively. The black circle represents the VE − VE×B plane perpendicular to the magnetic field B, and the two dashed circles show the ranges of away from the VE − VE×B plane. The blue arrowed line labeled as E, show the E direction of the EBWs. The white dot in panel (a) and the white square in panel (b) highlight the location with the largest phase-space density of the electron crescent. The intense phase-space densities close to the VB direction corresponds to the parallel magnetosheath electrons moving towards the X line (see Fig. 3f). b 2D slice of the distribution function on the VE − VE×B plane is from the average phase-space densities within from the perpendicular plane. The black circle denotes the electron velocity of 8.6 km s. The black and blue lines show the projected directions with the peak phase-space density of the electron crescents and the E direction, respectively.
Electron crescents drive the EBWs
Since BM > 0, the source of the crescents with large phase-space densities at the time of Fig. 6a should be from the high-density (magnetosheath) side (see Fig. 5a) of the neutral line. The black curves with arrows in Fig. 5b show the Liouville mapping47 trajectories of 93–631 eV electrons in the plane perpendicular to B (more details in the section “Liouville mapping of the electron crescents” and Table 1). Liouville mapping of the measured distribution along at the time of Fig. 6a (black curve in Fig. 5d) gives the red curve in Fig. 5d. Figure 5e–i presents the detailed comparison of the mapping phase-space densities with the observed ones at different locations (highlighted by the colored bars on the top of Fig. 5c) for 93–631 eV electrons. The good consistency demonstrates that the electron crescents with a positive gradient along of EBWs are generated by the electron finite gyroradius effect at the electron-scale boundary with a density gradient and a normal electric field.
Table 1.
Liouville tracing of the phase-space densities of the crescents in velocity space.
| [eV] | [10 km s] | [km] | [eV] | [eV] | [10 km s] | [10 km s] |
|---|---|---|---|---|---|---|
| 93 | 5.7 | 2.4 | −42 | 51 | 4.2 | −1.5 |
| 122 | 6.6 | 2.9 | −48 | 74 | 5.1 | −1.5 |
| 161 | 7.5 | 3.4 | −56 | 105 | 6.1 | −1.4 |
| 212 | 8.6 | 4.1 | −62 | 150 | 7.2 | −1.4 |
| 279 | 9.9 | 4.8 | −71 | 208 | 8.5 | −1.4 |
| 367 | 11.4 | 5.7 | −80 | 287 | 10.0 | −1.4 |
| 481 | 13.0 | 6.7 | −81 | 400 | 11.8 | −1.2 |
| 631 | 14.9 | 7.8 | −83 | 548 | 13.9 | −1.0 |
We use a fully kinetic dispersion solver48,49 to verify the generation mechanism of the EBWs. The electron distribution function at the time of Fig. 6a is modeled by a combination of a ring-type distribution49 for the electron crescents, a parallel-moving Maxwellian, and Maxwellian cores, as shown in Fig. 6g (more details in the section “Electron model distribution function for dispersion relation”). The perpendicular profile (green curve in Fig. 6d) of the model distribution is in good agreement with the observations (black curve in Fig. 6d). Solving the dispersion relation for the model distribution using a kinetic dispersion solver, we find several unstable electron Bernstein modes (see Fig. 6h), The maximum growth rate (0.05 ) is found to be along k direction, pointing towards the perpendicular ring, which models the perpendicular crescent observed by MMS. The phase speed estimated from the maximum growth rates in each of the electron Bernstein branches is 8070 km s, which is consistent with V predicted from the location of the maximum slope in the distribution function (see Fig. 6d). We find similar results by solving a dispersion relation of coupling between electron Bernstein mode and drifting electron beam mode50,51. One can note a difference between the MMS observations and the linear theory that the observed EBWs powers peak between the gyro-harmonics, while the peak growth rates locate close to the gyro-harmonics. This difference can possibly be due to the nonlinear effects of the large-amplitude EBWs51 and using a ring-type distribution instead of a crescent to model the instability.
We estimate the wave electric potential to be , and the EBWs can trap electrons with perpendicular speed between . The electron distributions presented in Fig. 6b, c were observed at the times of the large-amplitude EBWs, and their 1D electron distribution profiles along and are shown in Fig. 6e, f, respectively. The potential of EBWs is sufficiently large to trap nearly half of the electron crescents and to form the observed plateau in the distributions.
We present an MMS observation of large-amplitude quasi-electrostatic waves at the electron-scale boundary of the Hall current reversal near an EDR encounter. All the properties prove that the quasi-electrostatic waves are EBWs in an over-dense plasma environment. We conclude that the EBWs are driven by the crescent-shaped electron distributions perpendicular to B. Here, the local B is dominated by the Hall magnetic field embedded in a Hall current reversal. The electron crescents are generated by finite gyroradius effect of the outflow electrons from the magnetosheath side of the neutral line. The EBWs propagate toward the central EDR. The EBWs electric potentials are large enough to thermalize and diffuse the electron crescents near the EDR.
Discussion
Agyrotropic electron distributions are widely observed in and near EDRs from MMS observations52. The agyrotropic electrons may have sufficient free energy to generate different types of intense electrostatic waves. The EBWs reported here and the UH waves in ref. 9 are both driven by the agyrotropic electrons in the plane perpendicular to B via wave-mode coupling between beam-type mode and fundamental wave modes. The two cases are both observed on the magnetosheath side of the reconnection neutral line. The types of the electrostatic waves are probably determined by the specific distribution functions of the agyrotropic electrons and the others. The electron populations in the EBWs case are thermalized (188 eV) electron outflows. The source of the agyrotropic electrons is from the magnetosheath (+N) side, and the crescents have a significant density proportion () of the total density. The dominant electron populations in the case of the UH waves9 are magnetosheath (46 eV) electron inflows. The agyrotropic electrons ( of the total electrons) gyrate from the −N direction, and may undergo the meandering orbits across the neutral line8,36. The EBWs here and the UH waves in ref. 9 are mainly due to the different density proportions of the agyrotropic electrons and the different properties of the background electrons.
The electron agyrotropic distribution functions, that drive the EBWs, are found in the electron outflow near the electron diffusion region. MMS observed unstable distributions just before the EBWs, and diffused distribution while the EBWs were observed. This suggests that the large-amplitude EBWs can change the electron pressure tensor and modify the balance of the reconnection electric field. MMS trajectories of the two events in refs. 8,53 crossed EDRs in a similar way as shown in Fig. 2. We find electrostatic waves with frequencies above the electron cyclotron frequencies at similar electron-scale boundaries of the Hall current reversals. The agyrotropic electron distributions observed at these boundaries are likely to be the source of these electrostatic waves. The EBWs reported here and the high-frequency electrostatic waves in refs. 8,53 are highly structured at the electron-scale boundaries of the Hall current reversals near EDRs. The cross-field diffusion coefficient of the EBWs is estimated to be 3.6 × 10⁵ m s, using Eqs. (4) and (9) in ref. 54, and the observed wave amplitude of 60 mV m and local plasma conditions. The diffusion time is 1.6 s for the electron-scale (0.75 km) boundary shown in Figs. 4 and 5. The high-frequency electrostatic waves reported here and in refs. 8,53 may contribute significantly to the cross-field diffusion of the Hall current reversal boundaries near the electron diffusion regions. The observed magnetic reconnection events are already the results of mixture of all the possible effects. It is difficult to reveal the diffusion effects of the high-frequency waves separately from the data. Further numerical simulations using particle-in-cell models are needed to quantify the systematic effects of the large-amplitude high-frequency waves from linear to nonlinear stages.
Methods
Electron velocity distribution functions
FPI25 onboard the MMS spacecraft measures the electrons and ions with high time resolution to resolve kinetic-scale plasma dynamic. The burst-mode FPI data provide three-dimensional (3D) electron distribution functions with temporal resolutions of 30 and 7.5 ms46. The 32 energy bands of FPI cover electron energies from 10 eV to 30 keV. The angular resolution is 11.25 along both the azimuthal and polar directions. Figure 7a shows the 3D electron distribution functions with V = 8.6 × 10³ km s of the unstable electron crescents. As shown in Fig. 7b as an example, all the 2D slices used in this study are from the average phase-space densities within from a particular plane, while unit vectors are projected when they are within respect to the plane.
Liouville mapping of the electron crescents
The crescents generating the large-amplitude electron Bernstein waves gyrate from the magnetosheath (+N) side of the neutral line. We get the mapped electron phase-space density by using the Liouville’s theorem47 that the electron phase-space density are conserved along the particle trajectories throughout the gyro-motion at the electron-scale boundary (see Fig. 5). We assume one-dimensional variation of the magnetic field B and the electric field E around the EBWs observations. Here, B is dominated by B. The electric potential of the electron increases when tracing towards the high-density region55 (see Fig. 5a, b, d). The electron trajectories (see Fig. 5b) in the plane perpendicular to B are obtained by solving the electron motion equation based on observed electric and magnetic fields. Table 1 shows the details of the electron distribution function tracing in velocity space, while the curves in Fig. 5e–i also consider the energy resolution and errors of the phase-space densities.
Electron model distribution function for dispersion relation
We use a gyrotropic ring-type distribution function to model the observed crescents, while the rest of the observed electron populations is modeled by one drifting (along the field line) Maxwellian and two nondrifting Maxwellian cores. The background magnetic field is 30 nT, and the electron total number density is 14.1 cm. The gyrotropic ring is from superposition of multiple ring-type distribution functions49:
| 1 |
| 2 |
where erfc is the complementary error function. The parameters, number density (, in cm), parallel and perpendicular thermal speeds ( and , in km s), the parallel speed (, in km s), and the perpendicular ring speed (, in km s), are listed in Supplementary Data 1. The Maxwellian cores contain 65 eV electrons with a number density of 1.35 cm and 320 eV electrons with a number density of 2.02 cm. The parallel-moving Maxwellian electrons have a number density of 3.38 cm, a parallel speed of 8000 km s, perpendicular temperature of 20 eV and parallel temperature of 10 eV. All the parameters are adjusted to have a best fitting of the crescents and a relatively good fitting of the rest.
Supplementary information
Description of Additional Supplementary Files
Acknowledgements
We thank the MMS team and instrument principal investigators for data access and support. W.Y.L. appreciates the helpful discussion with Dr. B. Lembège from LATMOS Laboratoire, France and Dr. Lynn B. Wilson III from Goddard Space Flight Center, USA. This work was supported by the NNSFC Grant Nos. 41504114, 41731070, 41574159 and 41974170, Swedish National Space Board, Grant Nos. 164/14, 128/17 and 176/15, Swedish Research Council 2016-05507, Strategic Pioneer Program on Space Science of Chinese Academy of Sciences, Grant No. XDA15052500, and in part by the Specialized Research Fund for State Key Laboratories of China. W.Y.L. is also supported by the Youth Innovation Promotion Association (2018177) and opening fund of State Key Laboratory of Lunar and Planetary Sciences (Macau FDCT Grand No. 119/2017/A3). S.T.-R. acknowledges support of the of the Ministry of Economy and Competitiveness (MINECO) of Spain (Grant FIS2017-90102-R). The work at IRAP and the French involvement (SCM) on MMS were supported by CNES and CNRS.
Author contributions
W.Y.L. and D.B.G. carried out the data analysis, interpretation and manuscript preparation. Y.V.K., A.V., M.A., B.B.T., C.W., K.F., C.N. and S.T.-R. contributed to the data interpretation and manuscript preparation. K.M. and K.L. performed the wave analysis and contributed to the data interpretation. P.-A.L., Y.V.K., D.B.G., R.E.E. and R.B.T. contributed to the development and operation of the electric-field measurements. A.C.R., J.C.D., D.J.G., B.L.G. and B.L. contributed to the development and operation of the Fast Plasma instruments. F.P., W.M., O.L.C. and C.T.R. contributed to the development and operation of the magnetic-field measurements. J.L.B. led the design and operation of the MMS mission.
Data availability
MMS L2 data are available from the MMS Science Data Center (https://lasp.colorado.edu/mms/sdc/public).
Code availability
All of the data plots in this study are generated with the IRFU-Matlab software applied to the publicly available MMS database. The IRFU-Matlab software is available by downloading from https://github.com/irfu/irfu-matlab.
Competing interests
The authors declare no competing interests.
Footnotes
Peer review information Nature Communications thanks Xuanye Ma, and other, anonymous, reviewer(s) for their contribution to the peer review of this work. Peer reviewer reports are available.
Publisher’s note Springer Nature remains neutral with regard to jurisdictional claims in published maps and institutional affiliations.
Contributor Information
W. Y. Li, Email: wyli@spaceweather.ac.cn
D. B. Graham, Email: dgraham@irfu.se
Supplementary information
Supplementary information is available for this paper at 10.1038/s41467-019-13920-w.
References
- 1.Burch JL, Moore TE, Torbert RB, Giles BL. Magnetospheric multiscale overview and science objectives. Space Sci. Rev. 2016;199:5–21. doi: 10.1007/s11214-015-0164-9. [DOI] [Google Scholar]
- 2.Yamada M, Kulsrud R, Ji H. Magnetic reconnection. Rev. Mod. Phys. 2010;82:603–664. doi: 10.1103/RevModPhys.82.603. [DOI] [Google Scholar]
- 3.Burch JL, et al. Electron-scale measurements of magnetic reconnection in space. Science. 2016;352:aaf2939. doi: 10.1126/science.aaf2939. [DOI] [PubMed] [Google Scholar]
- 4.Cassak PA, Shay MA. Scaling of asymmetric magnetic reconnection: general theory and collisional simulations. Phys. Plasmas. 2007;14:102114. doi: 10.1063/1.2795630. [DOI] [Google Scholar]
- 5.Pritchett PL. Collisionless magnetic reconnection in an asymmetric current sheet. J. Geophys. Res. Space Phys. 2008;113:A06210. doi: 10.1029/2007JA012930. [DOI] [Google Scholar]
- 6.Hesse M, Aunai N, Sibeck D, Birn J. On the electron diffusion region in planar, asymmetric systems. Geophys. Res. Lett. 2014;41:8673–8680. doi: 10.1002/2014GL061586. [DOI] [Google Scholar]
- 7.Zenitani S, Hasegawa H, Nagai T. Electron dynamics surrounding the X line in asymmetric magnetic reconnection. J. Geophys. Res. Space Phys. 2017;122:7396–7413. doi: 10.1002/2017JA023969. [DOI] [Google Scholar]
- 8.Norgren C, et al. Finite gyroradius effects in the electron outflow of asymmetric magnetic reconnection. Geophys. Res. Lett. 2016;43:6724–6733. doi: 10.1002/2016GL069205. [DOI] [Google Scholar]
- 9.Graham DB, et al. Instability of agyrotropic electron beams near the electron diffusion region. Phys. Rev. Lett. 2017;119:025101. doi: 10.1103/PhysRevLett.119.025101. [DOI] [PubMed] [Google Scholar]
- 10.Fujimoto M, Shinohara I, Kojima H. Reconnection and waves: a review with a perspective. Space Sci. Rev. 2011;160:123. doi: 10.1007/s11214-011-9807-7. [DOI] [Google Scholar]
- 11.Farrell WM, Desch MD, Kaiser ML, Goetz K. The dominance of electron plasma waves near a reconnection X-line region. Geophys. Res. Lett. 2002;29:1902. [Google Scholar]
- 12.Vaivads A, et al. Cluster observations of lower hybrid turbulence within thin layers at the magnetopause. Geophys. Res. Lett. 2004;31:L03804. doi: 10.1029/2003GL018142. [DOI] [Google Scholar]
- 13.Tang X, et al. THEMIS observations of the magnetopause electron diffusion region: large amplitude waves and heated electrons. Geophys. Res. Lett. 2013;40:2884–2890. doi: 10.1002/grl.50565. [DOI] [Google Scholar]
- 14.Khotyaintsev YV, et al. Electron jet of asymmetric reconnection. Geophys. Res. Lett. 2016;43:5571–5580. doi: 10.1002/2016GL069064. [DOI] [Google Scholar]
- 15.Graham DB, Khotyaintsev YV, Vaivads A, André M. Electrostatic solitary waves with distinct speeds associated with asymmetric reconnection. Geophys. Res. Lett. 2015;42:215–224. doi: 10.1002/2014GL062538. [DOI] [Google Scholar]
- 16.Zhou M, et al. Observation of high-frequency electrostatic waves in the vicinity of the reconnection ion diffusion region by the spacecraft of the magnetospheric multiscale (MMS) mission. Geophys. Res. Lett. 2016;43:4808–4815. doi: 10.1002/2016GL069010. [DOI] [Google Scholar]
- 17.Burch J, et al. High-frequency wave generation in magnetotail reconnection: linear dispersion analysis. Geophys. Res. Lett. 2019;46:4089–4097. doi: 10.1029/2019GL082471. [DOI] [PMC free article] [PubMed] [Google Scholar]
- 18.Dokgo K, et al. High-frequency wave generation in magnetotail reconnection: nonlinear harmonics of upper hybrid waves. Geophys. Res. Lett. 2019;46:7873–7882. doi: 10.1029/2019GL083361. [DOI] [PMC free article] [PubMed] [Google Scholar]
- 19.Cao D, et al. MMS observations of whistler waves in electron diffusion region. Geophys. Res. Lett. 2017;44:3954–3962. doi: 10.1002/2017GL072703. [DOI] [Google Scholar]
- 20.Ergun RE, et al. Drift waves, intense parallel electric fields, and turbulence associated with asymmetric magnetic reconnection at the magnetopause. Geophys. Res. Lett. 2017;44:2978–2986. doi: 10.1002/2016GL072493. [DOI] [Google Scholar]
- 21.Russell CT, et al. The magnetospheric multiscale magnetometers. Space Sci. Rev. 2016;199:189–256. doi: 10.1007/s11214-014-0057-3. [DOI] [Google Scholar]
- 22.Le Contel O, et al. The search-coil magnetometer for MMS. Space Sci. Rev. 2016;199:257–282. doi: 10.1007/s11214-014-0096-9. [DOI] [Google Scholar]
- 23.Lindqvist P-A, et al. The spin-plane double probe electric field instrument for MMS. Space Sci. Rev. 2016;199:137–165. doi: 10.1007/s11214-014-0116-9. [DOI] [Google Scholar]
- 24.Ergun RE, et al. The axial double probe and fields signal processing for the MMS mission. Space Sci. Rev. 2016;199:167–188. doi: 10.1007/s11214-014-0115-x. [DOI] [Google Scholar]
- 25.Pollock C, Moore T, Jacques A, et al. Fast plasma investigation for magnetospheric multiscale. Space Sci. Rev. 2016;199:331–406. doi: 10.1007/s11214-016-0245-4. [DOI] [Google Scholar]
- 26.Sonnerup BUÖ, Cahill LJ., Jr Explorer 12 observations of the magnetopause current layer. J. Geophys. Res. Space Phys. 1968;73:1757–1770. doi: 10.1029/JA073i005p01757. [DOI] [Google Scholar]
- 27.Swisdak M. Quantifying gyrotropy in magnetic reconnection. Geophys. Res. Lett. 2016;43:43–49. doi: 10.1002/2015GL066980. [DOI] [Google Scholar]
- 28.Vaivads A, et al. Structure of the magnetic reconnection diffusion region from four-spacecraft observations. Phys. Rev. Lett. 2004;93:105001. doi: 10.1103/PhysRevLett.93.105001. [DOI] [PubMed] [Google Scholar]
- 29.Zhang YC. Distinct characteristics of asymmetric magnetic reconnections: observational results from the exhaust region at the dayside magnetopause. Sci. Rep. 2016;6:27592. doi: 10.1038/srep27592. [DOI] [PMC free article] [PubMed] [Google Scholar]
- 30.Egedal J, Daughton W, Le A. Large-scale electron acceleration by parallel electric fields during magnetic reconnection. Nat. Phys. 2012;8:321–324. doi: 10.1038/nphys2249. [DOI] [Google Scholar]
- 31.Egedal J, et al. Spacecraft observations and analytic theory of crescent-shaped electron distributions in asymmetric magnetic reconnection. Phys. Rev. Lett. 2016;117:185101. doi: 10.1103/PhysRevLett.117.185101. [DOI] [PMC free article] [PubMed] [Google Scholar]
- 32.Chen L-J, et al. Electron energization and mixing observed by MMS in the vicinity of an electron diffusion region during magnetopause reconnection. Geophys. Res. Lett. 2016;43:6036–6043. doi: 10.1002/2016GL069215. [DOI] [Google Scholar]
- 33.Graham DB, et al. Lower hybrid waves in the ion diffusion and magnetospheric inflow regions. J. Geophys. Res. Space Phys. 2017;122:517–533. doi: 10.1002/2016JA023572. [DOI] [Google Scholar]
- 34.Lavraud B, et al. Currents and associated electron scattering and bouncing near the diffusion region at earth’s magnetopause. Geophys. Res. Lett. 2016;43:3042–3050. doi: 10.1002/2016GL068359. [DOI] [Google Scholar]
- 35.Hesse M, et al. Theory and modeling for the magnetospheric multiscale mission. Space Sci. Rev. 2014;199:1–54. [Google Scholar]
- 36.Shay MA, et al. Kinetic signatures of the region surrounding the X line in asymmetric (magnetopause) reconnection. Geophys. Res. Lett. 2016;43:4145–4154. doi: 10.1002/2016GL069034. [DOI] [Google Scholar]
- 37.Phan TD, et al. MMS observations of electron-scale filamentary currents in the reconnection exhaust and near the X line. Geophys. Res. Lett. 2016;43:6060–6069. doi: 10.1002/2016GL069212. [DOI] [Google Scholar]
- 38.Graham DB, et al. Electron currents and heating in the ion diffusion region of asymmetric reconnection. Geophys. Res. Lett. 2016;43:2016GL068613. doi: 10.1002/2016GL068613. [DOI] [Google Scholar]
- 39.Schwartz SJ. Shock and discontinuity normals, Mach numbers, and related parameters. ISSI Sci. Rep. Ser. 1998;1:249–270. [Google Scholar]
- 40.Dunlop M, Southwood D, Glassmeier K-H, Neubauer F. Analysis of multipoint magnetometer data. Adv. Space Res. 1988;8:273–277. doi: 10.1016/0273-1177(88)90141-X. [DOI] [Google Scholar]
- 41.Bernstein IB. Waves in a plasma in a magnetic field. Phys. Rev. 1958;109:10–21. doi: 10.1103/PhysRev.109.10. [DOI] [Google Scholar]
- 42.Wilson LB, III, et al. Large-amplitude electrostatic waves observed at a supercritical interplanetary shock. J. Geophys. Res. Space Phys. 2010;115:A12104. [Google Scholar]
- 43.Christiansen P, et al. GEOS I: Identification of natural magnetospheric emissions. Nature. 1978;272:682. doi: 10.1038/272682a0. [DOI] [Google Scholar]
- 44.Rönnmark K, Christiansen PJ. Dayside electron cyclotron harmonic emissions. Nature. 1981;294:335. doi: 10.1038/294335a0. [DOI] [Google Scholar]
- 45.Laqua HP. Electron Bernstein wave heating and diagnostic. Plasma Phys. Control. Fusion. 2007;49:R1–R42. doi: 10.1088/0741-3335/49/4/R01. [DOI] [Google Scholar]
- 46.Rager AC, et al. Electron crescent distributions as a manifestation of diamagnetic drift in an electron scale current sheet: Magnetospheric multiscale observations using new 7.5 ms fast plasma investigation moments. Geophys. Res. Lett. 2018;45:578–584. doi: 10.1002/2017GL076260. [DOI] [PMC free article] [PubMed] [Google Scholar]
- 47.Murugeshan R, Kiruthiga S. Modern Physics. New Delhi: S. Chand Publishing; 2017. [Google Scholar]
- 48.Min K, Liu K. Fast magnetosonic waves driven by shell velocity distributions. J. Geophys. Res. Space Phys. 2015;120:2739–2753. doi: 10.1002/2015JA021041. [DOI] [Google Scholar]
- 49.Min K, Liu K. Understanding the growth rate patterns of ion Bernstein instabilities driven by ring-like proton velocity distributions. J. Geophys. Res. Space Phys. 2016;121:3036–3049. doi: 10.1002/2016JA022524. [DOI] [Google Scholar]
- 50.Fujimoto K, Machida S. An electron heating mechanism in the outflow region from the X-type neutral line. J. Geophys. Res. Space Phys. 2003;108:1349. doi: 10.1029/2002JA009810. [DOI] [Google Scholar]
- 51.Muschietti L, Lembége B. Microturbulence in the electron cyclotron frequency range at perpendicular supercritical shocks. J. Geophys. Res. Space Phys. 2013;118:2267–2285. doi: 10.1002/jgra.50224. [DOI] [Google Scholar]
- 52.Fuselier SA, et al. Large-scale characteristics of reconnection diffusion regions and associated magnetopause crossings observed by MMS. J. Geophys. Res. Space Phys. 2017;122:5466–5486. doi: 10.1002/2017JA024024. [DOI] [Google Scholar]
- 53.Hwang K-J, et al. Magnetospheric multiscale mission observations of the outer electron diffusion region. Geophys. Res. Lett. 2017;44:2049–2059. doi: 10.1002/2017GL072830. [DOI] [Google Scholar]
- 54.Labelle J, Treumann RA. Plasma waves at the dayside magnetopause. Space Sci. Rev. 1988;47:175–202. doi: 10.1007/BF00223240. [DOI] [Google Scholar]
- 55.Wang S, et al. Electron heating in the exhaust of magnetic reconnection with negligible guide field. J. Geophys. Res. Space Phys. 2016;121:2104–2130. doi: 10.1002/2015JA021892. [DOI] [Google Scholar]
Associated Data
This section collects any data citations, data availability statements, or supplementary materials included in this article.
Supplementary Materials
Description of Additional Supplementary Files
Data Availability Statement
MMS L2 data are available from the MMS Science Data Center (https://lasp.colorado.edu/mms/sdc/public).
All of the data plots in this study are generated with the IRFU-Matlab software applied to the publicly available MMS database. The IRFU-Matlab software is available by downloading from https://github.com/irfu/irfu-matlab.


