

Abstract
The present study sought to encapsulate oleuropein as a nutraceutical compound in order to investigate its physical properties and stability. We extracted the phenolic compounds of virgin olive leaf by ethanol–water and acetone–water solvents. The purity of this extract was confirmed by analytical high-performance liquid chromatography using oleuropein standard. Oleuropein was encapsulated with different components (lecithin, linoleic acid, glycerol monostearate, soybean oil, and Tween 80), and the effect of their contents on oleuropein-nanostructured lipid carrier (NLC) characteristics was checked by dynamic light scattering test. Moreover, several features of the optimal nanocarrier, including zeta potential, structural, morphology, stability, as well as thermal behavior were studied. The results of optimal NLC exhibited a high zeta potential as well as supreme stability versus aggregation. Thermal study indicated that oleuropein was well embedded into NLCs. The scanning electron microscope images showed that NLC samples had many spherical particles in the form of chain structure. The stable nanocarriers did not exhibit any oleuropein leakage following their analyses for 90 days at − 18, 6, and 25 °C in aqueous suspension.
Keywords: Oleuropein, Nanostructure lipid carriers, DSC, XRD, FE-SEM
Introduction
A nutraceutical is a nutrient with a valuable and health-enhancing biological activity whose basic nutritional properties enable it to prevent and treat certain diseases (Rajakumar 2003). It is believed that the olive plant has several nutritional and medicinal advantages. Oleuropein and its derivatives such as tyrosol and hydroxytyrosol have been indicated to be the principal components of olive leaf. Several compounds in oleuropein are potentially capable of performing antimicrobial activities against fungi, bacteria, as well as mycoplasma (Furneri et al. 2002) and antioxidant activity (Ziogas et al. 2010). Moreover, it was indicated in a research that acute infection and the cell-to-cell transmission of HIV-1 are repressed by oleuropein (Lee-Huang et al. 2003). Due to poor solubility in water and bitter taste, it cannot be used to enrich food. Scientists maintain that encapsulation is one of the methods that could be used to save bioactive food ingredients from environmental damage and disguise their displeasure properties (Fathi and Varshosaz 2013). It is believed that encapsulation leads to increased functionality of bioactive compounds, antibiotics, and probiotics (Ying et al. 2013). Nanostructure lipid carriers (NLC) are the novel types of nanostructures. Researchers argue that these lipid carriers are the novel colloidal sensitive carriers that can be used for industrial as well as scientific usages (Pardeike et al. 2009). A certain amount of fluid lipid is found in NLC that impedes the formation of complete crystals and the exclusion process during the storage phase (Fathi et al. 2012).
The main purpose of the present study was to design and develop new lipid nanocarriers to resolve the issues of oleuropein bitterness, low solubility and stability. The present research attempted to study the effect of concentrations of components on dynamic light scattering and encapsulation efficiency properties of oleuropein-NLC by the application of one-at-time method. It was also tried to propose an optimum formulation of oleuropein-NLC. Zeta-potential, X-ray diffraction (XRD), Differential scanning calorimetry (DSC), Field emission scanning electron microscope (FE-SEM), and physical stability were applied to study the features of the optimum formulation in the end.
Materials and methods
Materials
Oleuropein (molecular weight 540.51 g/mol), lecithin, chloroform, linoleic acid, acetone, ethanol, hydrochloric acid, phosphoric acid and sodium phosphate dihydrogen potassium, acetonitrile (at HPLC analytical grade) and methanol (at HPLC analytical grade) were supplied by Sigma–Aldrich. Tween 80) and Glycerol monostearate were purchased from Merck Co. (Germany). All other used chemicals were at of least analytical grade. The raw soybean oil was purchased from the local market of Iran, Gorgan. Also, healthy Olive leaves were collected from Iran, Khoramabad in spring and summer seasons and then were stored in cold place after washing, drying and grinding.
Extracting olive leaf powder extracts using different solvents
In olive leaf extraction, composition of ethanol–water solvents (with ratio of 70:30) and composition of acetone–water solvents (with ratio of 70:30) were used in hot and cold water methods, respectively. The best hot water extraction method as follows: the 10:1 solvent with the olive leaf powder was placed in the hot water bath at 40 °C for 30 min, while in the cold water extraction, the 10:1 solvent was mixed with olive leaf powder and was placed on the pallet shaker (moving shaker) with the speed of 1000 rpm for 24 h at 25 °C. After filtering the resulting extracts from both hot and cold methods using a 0.45 μ filter, the extracts filtered in the plate at the room temperature (25 °C) were dried and stored in the refrigerator.
HPLC analysis
In order to inject the sample into an HPLC system, a 25 μl microsphere (F-LC25 model manufactured by SGE, Australia) was used. For the separation and quantitative measurement of oleuropein in the extracted samples, the HPLC system with a C-8 column, Shim-Pack clc-c8 (M) model with the length of 25 cm, diameter of 4.6 mm, and filler particle size of 5 μm and protective column of 1 cm was used. This system was equipped with two reciprocating pumps, an oven, a continuous gas discharge, a 20-μl sample loop, and a UV–visible detector of SPD-10 AVP model equipped with 8-μl cell quartz. The software was Class-vp v.R 6.1, and the HPLC solvents (phosphate buffer, acetonitrile and distilled water) and extraction specimens were filtered before use by the 0.45 μ membrane filtration system (Millipore model). The peak oleuropein was identified using a comparison of retention time (RT) and the standard sample. For more certainty, a part of standard oleuropein was added and re-injected. As expected, the height of the identified peak was increased as oleuropein. For the quantitative measurement of the oleuropein, the calibration curve was employed by the standard sample based on the sub-peak level. To separate the species on an HPLC column, a gradient elution program (0.2, 0.4, 0.6, 0.8 and 1 mL/min) was used using two solvents of A: acetate phosphate buffer (0.05 mol) (pH = 2.8) and B: acetonitrile. The flow rate of the moving phase was 1 mL/min (Kheirandish et al. 2016; Soleimanifard et al. 2019).
NLC production
Preparation method of nano-carriers was conducted with a few modifications using method Fathi et al. (2013). In this method, the solid lipid (glycerol monostearate) was heated at 5 to 10 °C above the solid lipid’s melting point (60–70 °C). Initially, the olive leaf extract powder was dispersed in water (1:10), then, the aqueous dispersion containing extract powder was added to the melted lipid phase (melted fat and oil with lecithin emulsifier), which underwent stirring or large shearing force (2000–5000 rpm by homogenizer, Pro250, USA), by the sampler and in the drop by drop method within the time interval of 2 s for 2 h. The particle size in the final emulsion was reduced using 15 min sonication at 40 °C in the ultrasonic bath (Powersonic 505, South Korea) and, then, 15 min probe/bar ultrasound (in 5 three-min cycles in the time intervals of 1 min, frequency of 1 Hz, power of 100 watts, and amplitude of 50%) by the probe sonicator (Bandelin, Berlin, Germany). After the above-mentioned steps for centrifuging, 1 M chloride acid was added to each falcon tube (containing 35 mL of suspension) for contributing to the sequestration of the added nanoparticles. Then, the colloidal system was centrifuged for 15 min with 15,000 rpm at 20 °C. After the separation in the centrifuge, the sediment containing the nanoparticle carrying olive leaf extract powder was separated and dried by sublimation drying method (at − 80 °C and pressure of 0.001 mbar during 24 h) by a sublimation dryer (Christ Alpha LD, Germany) and the powder of lipid nano-carriers was obtained. Table 1 shows the concentration changes for compounds.
Table 1.
Formulation composition (percent weight/weight of emulsion) of nanostructure lipid carriers
| Formulation codea | Water (ml) | Glycerol monostearate (g) | Linoleic acid (g) | Soybean oil (g) | Lecithin (g) | Olive leaf extracts powder (g) | |
|---|---|---|---|---|---|---|---|
| Changes of water | 1 | 50 | 1.33 | 0.1 | 0.1 | 0.1 | 0.1 |
| 2 | 60 | 1.33 | 0.1 | 0.1 | 0.1 | 0.1 | |
| 3 | 120 | 1.33 | 0.1 | 0.1 | 0.1 | 0.1 | |
| Changes of lipid | 4 | 120 | 0.93 | 0.2 | 0.2 | 0.1 | 0.1 |
| 5 | 120 | 1.00 | 0.166 | 0.166 | 0.1 | 0.1 | |
| 6 | 120 | 1.06 | 0.13 | 0.13 | 0.1 | 0.1 | |
| 7 | 120 | 1.33 | 0.1 | 0.1 | 0.1 | 0.1 | |
| Changes of lecithin | 8 | 120 | 0.93 | 0.2 | 0.2 | 0.02 | 0.1 |
| 9 | 120 | 0.93 | 0.2 | 0.2 | 0.05 | 0.1 | |
| 10 | 120 | 0.93 | 0.2 | 0.2 | 0.2 | 0.1 | |
| 11 | 120 | 0.93 | 0.2 | 0.2 | 0.3 | 0.1 | |
| Changes of olive leaf extracts powder | 12 | 120 | 0.93 | 0.2 | 0.2 | 0.3 | 0.05 |
| 13 | 120 | 0.93 | 0.2 | 0.2 | 0.3 | 0.2 | |
| 14 | 120 | 0.93 | 0.2 | 0.2 | 0.3 | 0.4 | |
| 15 | 120 | 0.93 | 0.2 | 0.2 | 0.3 | 0.5 |
aFor all formulation 2 percent tween 80 were added
Dynamic light scattering
In order to study the particle size, poly dispersity index (PDI) and zeta-potential/average of the samples, a Zeta sizer (30 HS model, Nanoseries, Germany) was applied. Next, the particle size, PDI and zeta- average were measured using photonic correlation spectrometry at the angle of 90° and ambient temperature of 25 °C. The same instrument/machine applied by the Helmholtz–Smoluchowski equation to convert/transform the specified particle electrophoretic dynamism into zeta-average was used to determine the electrical charge of lipid nanoparticles in a capillary cell. Prior to analysis, the nanostructure lipid carrier samples were diluted 1:10 with a dilute phosphate buffer to elude multiple scattering effects (Nash and Haeger 1966; Soleimanian et al. 2018).
Designation of encapsulation efficiency (EE)
First, 10 mL of nano-carrier containing olive leaf extract powder was solved in 10 mL of acetonitrile solvent. After filtering with a 0.45 μ filter, the filtered solutions were ultrasounded for removing the effective substance from the lipid nanocarriers in an ultrasonic bath for 15 min at 25 °C. The resulting solution was diluted with further acetonitrile (10 mL) and, then, analyzed using an HPLC apparatus at the wavelength of 254 nm (maximum absorption wavelength of oleuropein). After calculating the amount of oleuropein, the efficiency of encapsulation was calculated using the following equation (Varshosaz et al. 2010).
XRD analysis
This method was carried out using X-ray diffraction by an X-ray diffraction device. In order to detect the crystal or non-shaped structure of the nano-carriers, X-RD patterns were determined by X-RD (STADIP, STOE, Germany). The data collection was done using copper anode (λα1 = 1.54443, λα2 = 1.39225, λβ = 1.39225) and monochromator voltage of 40 kV with the scan speed of 0.05 s. The refractive patterns were performed within 1 ≤ 2θ ≤ 79.99 by continuous scanning.
DSC analysis
Before thermal evaluation using the differential scanning thermometer (DSC 200 F3, Netzsch, Germany), the new optimal lipid nano-carrier formulas were frozen (− 18 °C) and dried using a sublimation dryer for 48 h. The thermal evaluation of the optimal nanostructure lipid carrier, control nanostructure lipid carrier, and optimal nanostructure lipid carrier ingredients was conducted by placing 1 mg of the sample in a standard aluminum container and heating 10 °C/min (temperature range of 25–400 °C) under a nitrogen flow of 70 mL min−1. In this device, the empty aluminum container was used as the reference.
Morphology study
Features of the morphology of the nanostructure lipid carriers were specified using a field emission scanning electron microscope (FE_SEM, TESCAN, Czech). Also, 10 mg of the sample was coated with a gold-plated metal. Then, the surface features and shape of the samples were investigated using FE-SEM (voltage of 20 kV).
Stability study
To show whether the novel nanocarriers can trap oleuropein, the polyethylene micro-tubes were utilized to keep the dispersions under the room temperature (25 ± 1 °C) and freezer (− 18 °C) for three months. Then, the samples were analyzed regarding the amount and size of remaining oleuropein in nanocarriers (Fathi et al. 2013).
Statistical analysis
Initial component concentrations were chosen by the Design Expert Software (version 7.0.0) and one-factor-at-a-time method/one-variable-at-a-time method at various levels. Data was obtained in triplicate. Data analysis were carried out using a SPSS software package (version 16) by analysis of variance (ANOVA). Statistical significance was set at P < 0.05. X-pert High Score Plus (version 4) and OriginPro software, 2016 were used to analyze XRD patterns.
Results and discussion
HPLC analysis
Oleuropein standard, ethanol–water and acetone–water samples chromatograms have been indicated in Fig. 1. The evaluation of the mixture of ethanol–water revealed that the extracts of ethanol–water and acetone–water had 221.370 and 120.8877 mg/g of oleuropein respectively. According to the data obtained in this section, a mixture of ethanol–water solvents with the ratios of 70:30 had the highest adsorption rate during the absorption wavelength of oleuropein (254 nm). The large amount of olive leaf extract in extraction with ethanol could be due to the better solubility of the active compounds (polyphenols) in organic solvents such as ethanol. Hence, the optimal method mentioned above was employed to continue the study for the high yield of olive leaf extract, high oleuropein, and safe solvent applied in the food and medicine industry.
Fig. 1.

Chromatogram of olive leaf extracted sample under optimized conditions using semipreparative HPLC (a: oleuropein standard, b: extracted sample with ethanol, c: extracted sample with aceton). Detection was performed at 254 nm
Particle size and polydispersity index (PDI) analysis
The average particle diameter for all freshly produced oleuropein-loaded NLC formulations ranged between 0.00 and 5767 nm (Table 2). The results indicated that the ratio of increased glycerol monostearate to oil phase (soybean and linoleic acid) could lead to the inconsistent increase of the particle size of the oleuropein-loaded NLC, which could be due to reduced interfacial tension with the rise of the ratio of glycerol monostearate to oil phase. Apparently, the surface-activity of glycerol monostearate is reduced compared with the oil phase, which increases the interfacial tension, and makes the droplet disruption easier. These findings are consistent with the results reported in literature. Lecithin reduction initially decreased particle size but later increased it. Reduced concentrations of emulsifier increased the interfacial tension and vice versa. Based on Laplace pressure, with the increased ease of the destruction of a droplet during homogenization, the interfacial tension decreases (McClements 2005). Some researchers have reported that high concentrations of emulsifier leads to the growth or increase of the droplet size, which can be due to the merging/re-accumulation of droplets caused by homogenization process (Kentish et al. 2008), drop size reduction, and the surplus concentration of surface emulsifier (Walstra 2003). These findings are consistent with the results reported in literature (Tamjidi et al. 2014). Moreover, increased olive leaf extracted powder in formulation led to increased particle size NLCs. NLCs particles are quite large in size, which could be because of the shape of the powder that affects the light scattering measurements. The particle size of lipid carriers can be affected by the distinctions related to shape. PDI is usually used to distinguish the width of the particle size distribution. Oleuropein-NLC formulations that were prepared freshly had a PDI value between 0.153 and 1.00. Formulation no 12 (high levels of oil phase to solid phase ratio) and formulation no 6 (high levels of solid phase to oil phase ratio) had the highest and lowest PDI values respectively. It is likely that the presence of many big particles of solid phase caused by insufficient droplet disruption resulted in increased PDI. Nevertheless, the increase in PDI could be due to intense re-coalescence as well as the presence of tiny nanoparticles or micelles.
Table 2.
Average values of size, PDI and encapsulation efficiency of developed carriers
| Formulation code | Particle size (nm) | Polydispersity index (PDI) | Encapsulation efficiency (EE) |
|---|---|---|---|
| 1 | 2144 ± 112.58b* | 0.561 ± 0.17d | 4.14 ± 0.04k |
| 2 | 1729 ± 115.16c | 0.935 ± 0.21b | 4.47 ± 0.29j |
| 3 | 464.7 ± 35.24e | 0.323 ± 0.05g | 6.25 ± 0.00i |
| 4 | 108.8 ± 7.11m | 0.196 ± 0.02k | 9.51 ± 0.34h |
| 5 | 134.7 ± 4.64i | 0.201 ± 0.01j | 22.79 ± 0.86d |
| 6 | 5767 ± 640.15a | 1.00 ± 0.02a | 39.54 ± 1.13c |
| 7 | 1631 ± 148.12d | 0.839 ± 0.16c | 1.27 ± 0.10n |
| 8 | 146.4 ± 15.37h | 0.280 ± 0.11h | 3.42 ± 0.00l |
| 9 | 99.07 ± 3.64n | 0.278 ± 0.08h | 12.04 ± 0.11g |
| 10 | 112.2 ± 6.27l | 0.225 ± 0.14i | 18.79 ± 5.54e |
| 11 | 120.9 ± 5.46k | 0.202 ± 0.06j | 70.54 ± 2.12b |
| 12 | 121.9 ± 4.18j | 0.153 ± 0.05l | 82.00 ± 0.08a |
| 13 | 382.6 ± 18.67g | 0.428 ± 0.11f | 18.27 ± 3.16e |
| 14 | 0.10 ± 0.00o | 0.638 ± 0.08d | 16.36 ± 4.15f |
| 15 | 400.4 ± 48.26f | 0.435 ± 0.13e | 1.84 ± 0.07m |
*Different letters in each column depict a significantly difference (P < 0.05)
Zeta-average analysis
Zeta-average has a negative or positive load depending on the chemical characteristics of the particles, which is a significant agent to express the physical stability of the colloidal and nanoparticle systems. In other words, Zeta potential indicates the repulsive force among particles that have similar charges in the formulation, and the repulsive forces do not allow the particle to aggregate during storage (Das et al. 2012). Hence, the likely physical stability of a formulation could be shown by Zeta potential (Das et al. 2012). However, aggregation would not take place significantly because of the evident same electrical charge caused by electrostatic repulsion. A negative zeta-average in the range of − 43.3 mV is observed for the optimal oleuropein-NLC formulation. The negative loads on the surface of nano-carriers were probably due to the presence of lipophilic surfactants with negative loads (i.e. lecithin) and free fatty acids (i.e. linoleic acid and linolenic acid, oleic acid, and free fatty acids in soybean oil) (Kumbhar and Pokharkar 2013). These results are consistent with the findings reported in the literature (Fathi et al. 2012; Tamjidi et al. 2014; Soleimanian et al. 2018).
Encapsulation efficiency analysis
Microencapsulation refers to the potential of wall materials in preserving or trapping encapsulation materials within microspheres. This factor is affected by the components of nanoparticles (the composition and amount of wall materials, emulsifier, and the amount of encapsulation material), production method, and the amount and solubility of the encapsulation material in the lipid (Tamjidi et al. 2014). Microencapsulation values of nano-carriers varied from 1.27 ± 0.11 to 82 ± 8.41 (Table 2) and the formula with code 12 had the highest efficiency of microencapsulation. As the ratio of the lipid liquid phase to the lipid solid phase increased and particle size reduced, the microencapsulation efficiency of nano-carriers increased. This could be probably due to the greater solubility of the encapsulation material in the liquid part of the lipid. Fathi et al. (2013) indicated that nano-structure lipids were crystallized after getting cold from the forms with more energy (α, β′) to the forms with less energy (β). As the result of this process, the new form of the resulting lipids could not have any space for encapsulation materials and exclusive exhaust. Nevertheless, adding liquid lipid to the lipid mixture, and increasing the liquid part to solid part ratio resulted in the formation of a more amorphous state and less crystalline state of the nano-carriers. This process eventually led to the defective and increased encapsulation materials in nano-carriers (increased efficiency of microencapsulation). The results of this study were consistent with the findings of other researchers (Yuan et al. 2015; Kiani et al. 2016; Soleimanian et al. 2018).
XRD and stability analysis
X-ray diffraction was carried out in order to recognize the physical conditions of optimal oleuropein-loaded nanocarrier. The diffractograms of oleuropein-free NLC and oleuropein-loaded NLC have been demonstrated in Fig. 2a, b. The wide diffraction peaks (decrease peak intensity) of oleuropein-loaded nanocarriers implies that they have less crystallinity compared to oleuropein-free nanocarriers and β/β′form (Liu and Wu 2010), which could be because of increased impurity (residues of olive leaf extracted powder). These results are consistent with the findings reported in the literature (Jenning and Gohla 2000; Fathi et al. 2013). There is a considerable overlap between the diffractograms of oleuropein-loaded NLC and oleuropein-free NLC. Nonetheless, it is likely that the additional reflections are induced by certain organic residual moieties of the plant extract. The oleuropein-loaded NLC formulation exactly revealed four reflections highly similar to those of oleuropein-free NLC. The diffraction patterns exhibit considerable diffraction peaks at 2θ-scattered angles of 3.74, 5.60, 7.47, and 11.213 for oleuropein-free NLC formulation, and 3.69, 5.54, 7.40, 11.12 for the oleuropein-loaded NLC formulation, which is indicative of the similarity in their crystalline nature. The crystallinity quantities of the different formulations were significantly different, and the quantity was 48 percent and 52 percent for oleuropein-loaded/free NLC respectively. It is likely that the differences in diffractogram peaks of the optimal and control nano-carriers could be attributed to the presence of olive leaf extract powder and its effect on the characteristics of particle light dispersion.
Fig. 2.

XRD patterns of powder of oleuropein -free nanocarrier (a) and oleuropein-loaded nanocarrier (b); effect of temperature on average particle diameter of oleuropein-loaded NLC formulations (c: T = 25 °C, d: T = − 20 °C)
Figure 2c, d indicates the diagrams of the size distribution. The sequestration rate of nano-carriers during the storage phase depends on the low kinetic energy of lipid matrix at − 18 °C and the magnitude of zeta-average. Given the large amount of zeta potential (− 43.3 mV), the accumulation of particles during the 3 months of storage was slow, so that the optimal nano-carrier particle size (121.9 nm) and PDI (0.153) after 3 months of storage at − 18 and 25 °C reached 129.3 and 281.4 nm, and their PDI was 0.372 and 0.442 respectively. Substantially, changes were not observed in the size of optimal oleuropein-loaded carrier formulation at − 18 °C. It seems that the optimal formulation had well stability at reported temperature. These results are consistent with the results reported in literature (Fathi et al. 2013; Wang et al. 2014; Zhu et al. 2015; Li et al. 2016; Soleimanian et al. 2018). Oleuropein did not have any leakage.
Structural properties
Morphological studies were carried out using FE-SEM. The image in Fig. 3 demonstrates the structure of NLCs with diameters of ~ 15–32 nm. According to the presented forms, the particles of nanostructured lipid carriers had a highly regular platy or scaly structure. These images revealed that the resulting nanostructured lipid carriers had a homogeneous structure with regular and continuous chains of spherical particles with low inter-particle cavitation percent. Moreover, the lipid chains had a sticky structure, intact wall, spherical and uniform shape, and non-gap and wrinkle-free wall. These properties indicated the appropriate characteristics of powders prepared by sublimation drying.
Fig. 3.
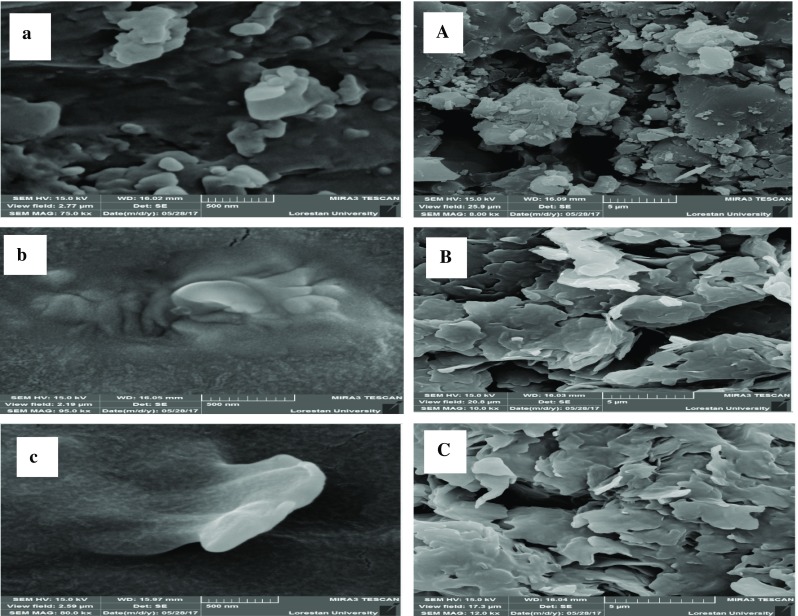
FE-SEM images of olive leaf extracted powder (a: 500 nm, A: 5 nm), oleuropein-free NLC (b: 500 nm, B: 5 nm) and oleuropein-loaded NLC (c: 500 nm, C: 5 nm)
Thermal properties study
Thermal attributes were assessed using DSC analysis to check the melting point as well as the crystallization condition of the materials and created nanocarriers. Figure 4 indicates the results of the thermography of the pure materials, optimal oleuropein-loaded NLC oleuropein-free NLC. Wide endothermic and exothermic peaks were observed in the pure component (except the extract powder sample and oleuropein) and oleuropein-free NLC. The endothermic peaks were caused by removing the moisture removal or the pure crystalline structure. However, exothermic peaks were induced by depolymerization and pyrolytic decomposition because of dehydration and depolymerization reactions that occur following the partial decarboxylation of the protonated carboxylic groups and oxidation reactions (Sarmento et al. 2006; Zohuriaan and Shokrolahi 2004; Fathi and varshosaz 2013). In the nano-carrier sample, the emergence of a melting point at 390 °C indicated the increase in hydrogen bonds between hydroxyl and ester groups in lecithin, linoleic acid, soybean oil, and hydrophobic, and Van der Waals bonds between non-polar parts in the colloid state. In the optimal sample, the melting temperature changed to 80. The removal of positive and negative peaks, and the emergence of a peak at 80 °C represented the crystallization of the compounds and proper compatibility of these ingredients. The presence of the separate peaks of the components in the heating curve of nanoparticles containing the active substance is due to the absence of chemical interactions between them (Rudra et al. 2010). Some researchers have reported that with the addition of active substances to the composition of nanoparticles, the melting point was reduced and the peak of the active substance was removed in the nanoparticle curve. They suggested that the amorphous active substance was encapsulated in the crystalline nanoparticles. Furthermore, by placing the active substance in two lipid layers, the degree of compression and order of the lipid crystals were reduced, which in turn altered the fluidity of the membrane structure. Consequently, the melting point of the nanoparticles containing active substances was reduced compared with the mass of the material (Mohammadhasani 2013).
Fig. 4.

Thermal properties of optimal oleuropein-loaded carrier, oleuropein-free carrier and pure materials (a: oleuropein, b: optimal oleuropein-loaded carrier, c: soybean oil, d: extract powder sample, e: glycerol monostearates, f: lecithin, g: linoleic acid, h: oleuropein-free carrier
Conclusion
The principal purpose of the present research was to investigate the possibility of utilizing new nanocarriers to encapsulate herbal bioactive components. As a natural nutraceutical compound, oleuropein was loaded into NLC, and then its features were examined. Oleuropein-loaded NLC was produced by hot high-shear homogenization accompanied with ultrasonication techniques (bath and probe sonicator). Compared to other oleuropein-loaded NLC samples, optimal oleuropein-loaded NLC samples were smaller and more efficient for encapsulation. According to the stability analysis, significant oleuropein leakage was not observed in the optimal nanocarrier within the 3 months´ storage. According to the structural as well as thermal results, the crystalline state of prepared oleuropein-loaded nanocarrier was not highly ordered compared with the oleuropein-free nanocarrier and pure materials respectively. Hence, it could be concluded that oleuropein was well accommodated in lipid matrix.
Acknowledgements
The cost of part of this article is sponsored by Gorgan University of Agricultural Sciences and Natural Resources.
Footnotes
Publisher's Note
Springer Nature remains neutral with regard to jurisdictional claims in published maps and institutional affiliations.
References
- Das S, Ng WK, Tan RBH. Are nanostructured lipid carriers (NLCs) better than solid lipid nanoparticles (SLNs): development, characterizations and comparative evaluations of clotrimazole-loaded SLNs and NLCs? Eur J Pharm Sci. 2012;47:139–151. doi: 10.1016/j.ejps.2012.05.010. [DOI] [PubMed] [Google Scholar]
- Fathi M, Varshosaz J. Novel hesperetin loaded nanocarriers for food fortification: production and characterization. J Funct Foods. 2013;5:1382–1391. doi: 10.1016/j.jff.2013.05.006. [DOI] [Google Scholar]
- Fathi M, Mozafari MR, Mohebbi M. Nanoencapsulation of food ingredients using lipid based delivery systems. Trends Food Sci Technol. 2012;23:13–27. doi: 10.1016/j.tifs.2011.08.003. [DOI] [Google Scholar]
- Fathi M, Varshoosaz J, Mohebbi M, Shahidi F. Hesperetin loaded solid lipid nanoparticles and nanostructure lipid carriers for food fortification: preparation, characterization and modeling. Food Bioprocess Tech. 2013;6:1464–1475. doi: 10.1007/s11947-012-0845-2. [DOI] [Google Scholar]
- Furneri PM, Marino A, Saija A, Uccella N, Bisignano G. In vitro antimycoplasmal activity of oleuropein. Int J Antimicrob Agents. 2002;20:293–296. doi: 10.1016/S0924-8579(02)00181-4. [DOI] [PubMed] [Google Scholar]
- Jenning V, Gohla S. Comparison of wax and glyceride solid lipid nanoparticles. Int J Pharm. 2000;196(2):219–222. doi: 10.1016/S0378-5173(99)00426-3. [DOI] [PubMed] [Google Scholar]
- Kentish S, Wooster TJ, Ashokkumar M, Balachandran S, Mawson R, Simons L. The use of ultrasonics for nanoemulsion preparation. Innov Food Sci Emerg Technol. 2008;9(2):170–175. doi: 10.1016/j.ifset.2007.07.005. [DOI] [Google Scholar]
- Kheirandish F, Delfan B, Mahmoudvand H, Moradi N, Ezatpour B, Ebrahimzadeh F, Rashidipour M. Antileishmanial, antioxidant, and cytotoxic activities of Quercus infectoria olivier extract. Biomed Pharmacother. 2016;82:208–215. doi: 10.1016/j.biopha.2016.04.040. [DOI] [PubMed] [Google Scholar]
- Kiani A, Fathi M, Ghasemi SM. Production of novel vitamin D3 loaded lipid nanocapsules for milk fortification. Int J Food Prop. 2016;3:1–11. [Google Scholar]
- Kumbhar DD, Pokharkar VB. Engineering of a nanostructured lipid carrier for the poorly water-soluble drug, bicalutamide: physicochemical investigations. Colloids Surf A. 2013;416:32–42. doi: 10.1016/j.colsurfa.2012.10.031. [DOI] [Google Scholar]
- Lee-Huang S, Zhang L, Huang PL, Chang YT, Huang PL. Anti-HIV activity of olive leaf extract (OLE) and modulation of host cell gene expression by HIV-1 infection and OLE treatment. Biochem Biophys Res Commun. 2003;307:1029–1037. doi: 10.1016/S0006-291X(03)01292-0. [DOI] [PubMed] [Google Scholar]
- Li M, Zahi MR, Yuan Q, Tian F, Liang H. Preparation and stability of astaxanthin solid lipid nanoparticles based on stearic acid. Eur J Lipid Sci Technol. 2016;118(4):592–602. doi: 10.1002/ejlt.201400650. [DOI] [Google Scholar]
- Liu CH, Wu CT. Optimization of nanostructured lipid carriers for lutein delivery. Colloids Surf A. 2010;353:149–156. doi: 10.1517/17425247.2014.945416. [DOI] [Google Scholar]
- McClements DJ. Food emulsions: principles, practice, and techniques. 2. London: CRC Press; 2005. [Google Scholar]
- Mohammadhasani Z (2013) Preparation and evaluation of nanoliposomes containing oryzanol (a food-drug combination). Master thesis, Tabriz University
- Nash RA, Haeger BE. Zeta potential in the development of pharmaceutical suspensions. J Pharm Sci. 1966;55:829–837. doi: 10.1002/jps.2600550816. [DOI] [PubMed] [Google Scholar]
- Pardeike J, Hommoss A, Muller RH. Lipid nanoparticles (SLN, NLC) in cosmetic and pharmaceutical dermal products. Int J Pharm. 2009;366(1–2):170–184. doi: 10.1016/j.ijpharm.2008.10.003. [DOI] [PubMed] [Google Scholar]
- Rajakumar K. Vitamin D, cod-liver oil, sunlight, and rickets: a historical perspective. J Pediatr. 2003;112:132–135. doi: 10.1542/peds.112.2.e132. [DOI] [PubMed] [Google Scholar]
- Rudra A, Deepa RM, Ghosh MK, Ghosh S, Mukherjee B. Doxorubicin-loaded phosphatidylethanolamine conjugated nanoliposomes: in vitro characterization and their accumulation in liver, kidneys, and lungs in rats. Int J Nanomed. 2010;5:811–823. doi: 10.2147/IJN.S13031. [DOI] [PMC free article] [PubMed] [Google Scholar]
- Sarmento B, Ferreira D, Veiga F, Ribeiro A. Characterization of insulin-loaded alginate nanoparticles produced by ionotropic pre-gelation through DSC and FTIR studies. Carbohydr Polym. 2006;66:1–7. doi: 10.1016/j.carbpol.2006.02.008. [DOI] [Google Scholar]
- Soleimanian Y, Hossein Goli SA, Varshosaz J, Sayed Mohammad Sahafi SM. Formulation and characterization of novel nanostructured lipid carriers made from beeswax, propolis wax and pomegranate seed oil. Food Chem. 2018;244:83–92. doi: 10.1016/j.foodchem.2017.10.010. [DOI] [PubMed] [Google Scholar]
- Soleimanifard M, Sadeghi Mahoonak AR, Sepahvand A, Heydari R, Farhadi S. Spanish Olive leaf extract -loaded nanostructured lipid carriers: production and physicochemical characterization by Zeta-Sizer, FT-IR, DTA/TGA, FE-SEM and XRD. J Food Process Preserv. 2019;43(7):1–13. doi: 10.1111/jfpp.13994. [DOI] [Google Scholar]
- Tamjidi F, Shahedi M, Varshosaz J, Nasirpour A. Design and characterization of astaxanthin-loaded nanostructured lipid carriers. Innov Food Sci Emerg Technol. 2014;26:366–374. doi: 10.1016/j.ifset.2014.06.012. [DOI] [Google Scholar]
- Varshosaz J, Ghaffari S, Khoshayand MR, Atyabi F, Azarmi S, Kobarfard F. Development and optimization of solid lipid nanoparticles of amikacin by central composite design. J Liposome Res. 2010;20(2):97–104. doi: 10.3109/08982100903103904. [DOI] [PubMed] [Google Scholar]
- Walstra P. Physical chemistry of foods. New York: Marcel Decker; 2003. [Google Scholar]
- Wang JL, Dong XY, Wei F, Zhong J, Liu B, Yao MH, Chen H. Preparation and characterization of novel lipid carriers containing microalgae oil for food applications. J Food Sci. 2014;79(2):169–177. doi: 10.1111/1750-3841.12334. [DOI] [PubMed] [Google Scholar]
- Ying D, Schwander S, Weerakkody R, Sanguansri L, Gantenbein-Demarchi C, Augustin MA. Microencapsulated Lactobacillus rhamnosus GG in whey protein and resistant starch matrices: probiotic survival in fruit juice. J Funct Foods. 2013;5:98–105. doi: 10.1016/j.jff.2012.08.009. [DOI] [Google Scholar]
- Yuan JJ, Wang CZ, Ye JZ, Tao R, Zhang YS. Enzymatic hydrolysis of Oleuropein from Olea europea (Olive) leaf extract and antioxidant activities. Molecules. 2015;20:2903–2921. doi: 10.3390/molecules20022903. [DOI] [PMC free article] [PubMed] [Google Scholar]
- Zhu J, Zhuang P, Luan L, Sun Q, Cao F. Preparation and characterization of novel nanocarriers containing krill oil for food application. J Funct Food. 2015;19:902–912. doi: 10.1016/j.jff.2015.06.017. [DOI] [Google Scholar]
- Ziogas V, Tanou G, Molassiotis A, Diamantidis G, Vasilakakis M. Antioxidant and free radical-scavenging activities of phenolic extracts of olive, fruits. Food Chem. 2010;120:1097–1103. doi: 10.1016/j.foodchem.2009.11.058. [DOI] [Google Scholar]
- Zohuriaan MJ, Shokrolahi F. Thermal studies on natural and modified gums. Polym Test. 2004;23:575–579. doi: 10.1016/j.polymertesting.2003.11.001. [DOI] [Google Scholar]