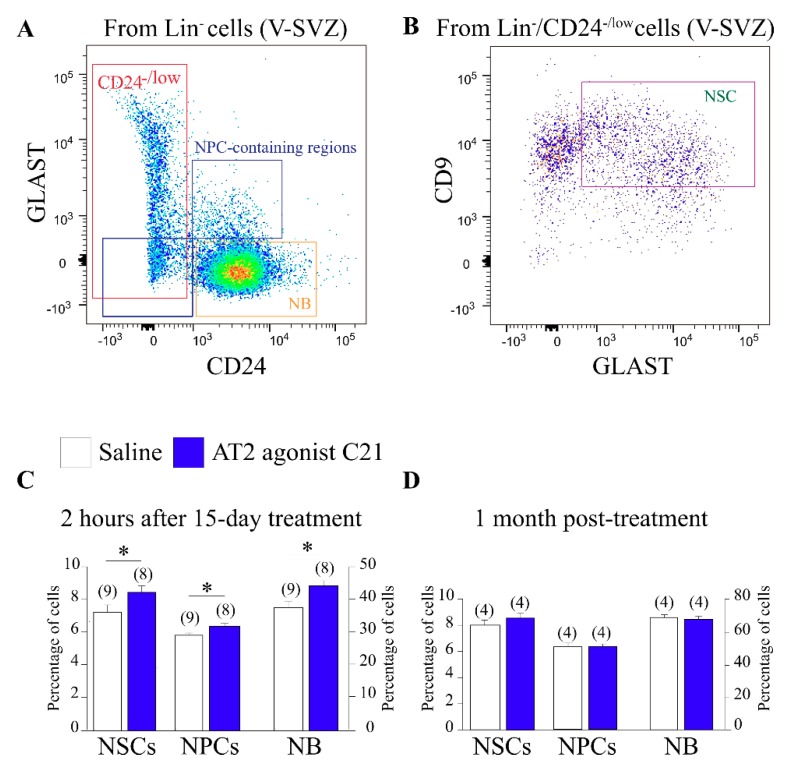
Figure 2.
(A) FACS analysis of neural stem cell (NSC), neural progenitor (NP), and neuroblast (NB) populations in the ventricular–subventricular zone (V-SVZ) within the Lin- population discriminated by levels of CD24 and GLAST. (B) FACS analysis of NSCs within the Lin-/CD24-/low cells discriminated by levels of GLAST and CD9. (C) Histogram showing the quantification of NSCs, NP, and NB FACS analyses 2 h after the last dose of 15 days C21 treatment; the levels of these three populations of cells raised up after 15 days of treatment. (D) Histogram showing FACS analyses quantification of NSC, NP, and NB populations 1 month after C21 treatment showing no differences between experimental groups. Data are means ± standard error of the mean (SEM). * p < 0.05 (Student’s t-test).

